Original article | Odaily Odaily( @OdailyChina )
Author|jk

Since reaching an all-time high of $126,198 in October 2025, Bitcoin has undergone a long seven-month period of decline and consolidation. Entering May 2026, BTC formed a highly concentrated battleground between bulls and bears near the $80,000 mark. Accumulated bullish signals and bearish liquidation pressure appeared simultaneously at the same price level with unprecedented intensity.
As of press time, the current BTC price is around $80,832, and the market is at a critical juncture: a breakout or a second pullback?
The bulls' confidence stems from the fact that almost all on-chain data points to a bottoming out.
The evidence supporting the bullish outlook mainly focuses on two lines: supply-side contraction and institutional demand .
On the supply side, BTC reserves on exchanges have fallen to 2.21 million, the lowest level in seven years since December 2017. Long-term holders account for 78.3% of the total supply, and whale wallets saw a net accumulation of approximately 270,000 BTC in April. The amount of BTC available for immediate sale in the market has been compressed to historically low levels. If new demand continues to enter the market, the price's sensitivity to capital inflows may further increase.
On the demand side and institutional data, US spot BTC ETFs saw net inflows of $2.44 billion in April, the strongest month since October 2025 , with BlackRock's IBIT accounting for approximately 70% ($1.71 billion). Strategy (formerly MicroStrategy) holds 818,334 BTC at an average cost of $ 75,537, with a paper profit of over 7%. Saylor posted a "back to work" message on May 10, which the market interpreted as a signal to continue increasing his holdings. JPMorgan Chase estimates that Strategy's total BTC purchases this year may reach $30 billion.
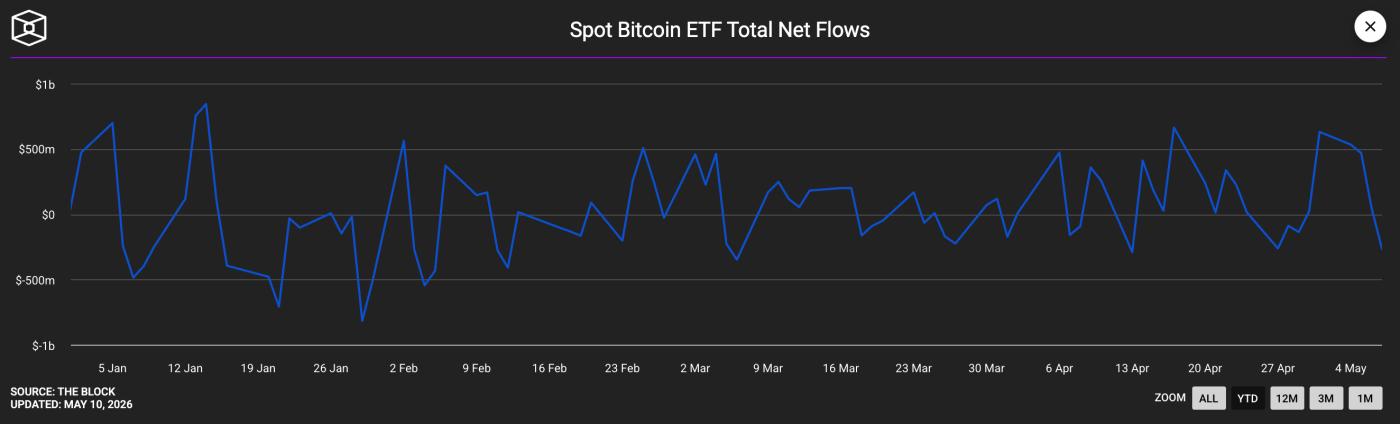
Bitcoin ETF inflow data, source: The Block
Valuation metrics are also unusually low. The MVRV Z-value is only 0.91, a range historically recognized as a strategic accumulation window; the RHODL ratio is 4.5, the third highest in Bitcoin's history. This is only the third time in history, the previous two being in 2015 and 2020, both of which marked the bottom of the cycle.
Glassnode data shows that Bitcoin has regained its footing above the true market average around $78,200 and the short-term holder cost base around $79,100. These two levels are crucial for market structure. If the price continues to hold above these levels, it indicates that recent buyers are back in a profitable position, and the market is gradually shifting from being dominated by loss-making selling pressure to a recovery in holding confidence.
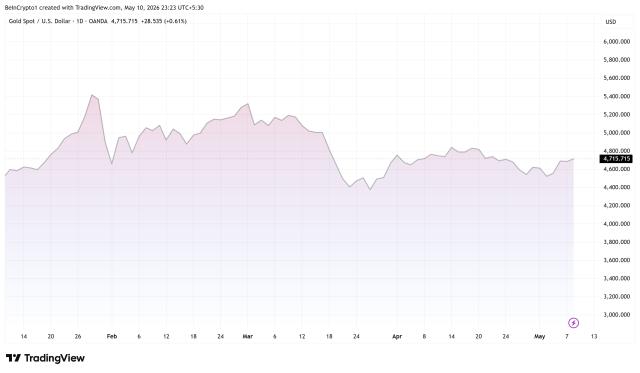
On a macro level, the 30-day correlation coefficient between BTC and the US Dollar Index (DXY) hit -0.90 in late April, the most extreme negative correlation level since September 2022. If the US dollar continues to weaken, it will provide almost mechanical price support for BTC.
Pressure from short sellers: Seven consecutive rejections, mining companies selling off their holdings, and abnormal derivatives structure.
However, there is resistance of equal strength to the accumulated signal from another direction.
Regarding liquidation selling pressure, Glassnode data shows that the 14-day average realized loss remains at $479 million per day, 140% of the cyclical benchmark of $200 million. Historical experience indicates that this figure must be compressed below the benchmark before a bull market begins . Currently, approximately 43% of Bitcoin across the entire network is at a paper loss, and the number of wallet addresses holding BTC has decreased by 245,000 in the past 5 days, the fastest rate of loss in nearly two years. The cost basis of newly emerging whales (holding for less than 155 days) is approximately $80,300. BTC must continue to trade above this level to turn these holdings into profits; otherwise, they face selling pressure at any time to break even.
The structure of the derivatives market also sends a signal on this side: On April 27th, the 30-day average funding rate for perpetual contracts was -5%, while the historical normal level is +8%, a figure that has just turned positive. On Binance, the BTC long/short ratio is only 36.7% long/63.3% short, the most crowded short position structure among mainstream assets. Markus Thielen, an analyst at 10x Research, explicitly stated that this abnormal funding rate indicates institutions are hedging their ETF long positions by short futures, creating systemic pressure, and potentially signaling a further harvesting of short-term long positions. Glassnode statistics show that nearly $2 billion in short Gamma options positions are also concentrated around the $82,000 strike price, and market makers' hedging activities will amplify two-way volatility around this price level.
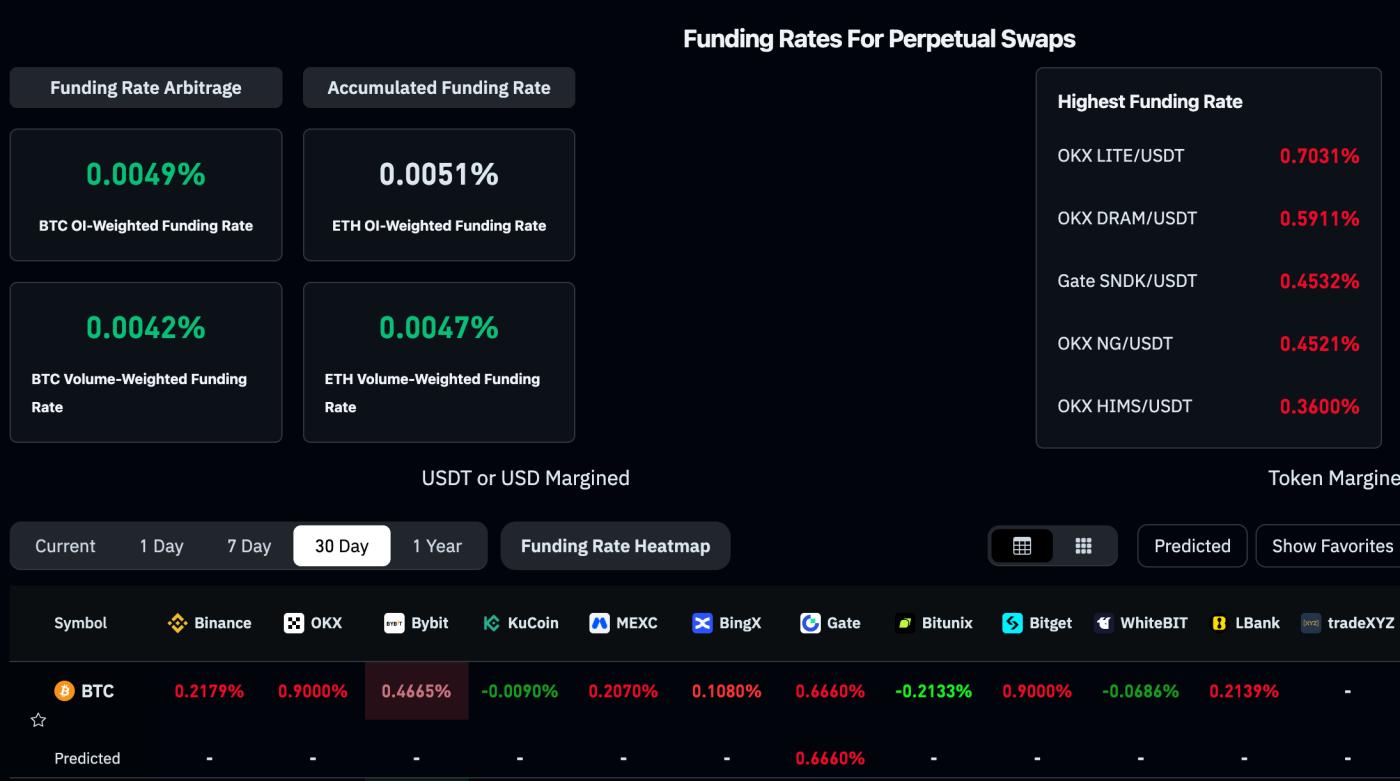
The 30-day average funding rate has just turned positive. (Source: Coinglass)
On the selling side, listed mining companies sold over 32,000 BTC in the first quarter of 2026, exceeding the total amount sold in 2025. Bitdeer completely liquidated its 1,132.9 BTC reserves in February, Cango sold 4,451 BTC (approximately $305 million) on February 9th, and Core Scientific is also continuously liquidating its reserves. On-chain data shows that since April 7th, approximately 3,400 BTC have flowed out of miners' reserves, with mining companies taking advantage of this rebound to cash out. If miners' selling pressure continues and ETF inflows cannot sustainably offset it, the price stability around $80,000 will be tested.
What institutions think: Analysts' perspectives
The divergence between bulls and bears is also reflected in Wall Street's year-end target prices, with a degree of dispersion rarely seen in this cycle.
Tom Lee offered the most optimistic assessment at the Consensus conference in Miami on May 7th: " If Bitcoin closes above $76,000 this month, the bear market is clearly over. You never experience a bear market with three consecutive months of positive returns." His year-end target range is $150,000–$250,000.

Tom Lee at the recently concluded Consensus conference. Source: Coindesk
Bernstein analyst Gautam Chhugani reiterated his $150,000 target on May 5th , stating that "the current bear market logic is the weakest in Bitcoin's history, and the best era for cryptocurrencies is yet to come." JPMorgan Chase, on the other hand, is optimistic about the crypto market in 2026, believing it will be driven more by institutional investors than retail investors, and has lowered its soft support level for BTC production costs from $90,000 to $77,000.
On the other hand, Standard Chartered's Geoffrey Kendrick lowered his year-end target from $150,000 to $100,000 in February , warning of a "final liquidation period" and suggesting BTC could slide to $50,000 before establishing a lasting bottom. Citigroup lowered its target from $143,000 to $112,000 in March, believing BTC is more likely to trade within a range in the short term, awaiting legislative progress such as the Clarity Act. SkyBridge's Anthony Scaramucci explicitly stated that a significant recovery for BTC may not occur until the fourth quarter of 2026.
Key judgment criteria
Of all the indicators observed, two are currently the most decisive:
First, can the 200-day EMA hold ? BTC has just recovered this moving average. If it falls back and the weekly closes below it, then this recovery will be considered a false breakout. The short-term holder's cost line at $79,100 and the true market average at $78,200 will be the two support levels for the bulls. Once $74,300 is breached, the extreme scenario of $50,000–$60,000 warned by Standard Chartered Bank will reappear.
Second, can it break through Glassnode's active price of $85,200 ? This is the next significant on-chain resistance level given in Glassnode's Weekly Report #18. If the weekly close is above this level, a trend reversal signal will be confirmed.
The combination of these indicators will provide the answer within the next two to three weeks.