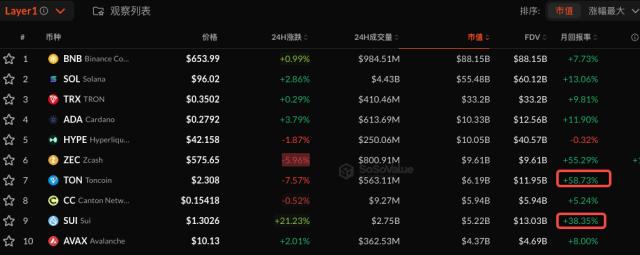
The top 3 meme coins this week are following very different technical trends. BUILDon (B) continues its breakout, MemeCore (M) has lost a key support zone, and Siren (SIREN) is "compressing" its price below the downtrend line that has halted its price since March.
The daily chart shows BUILDon approaching the 0.618 Fibonacci level at $0.48, MemeCore correcting to $3.27 after failing near the $4 mark, and SIREN testing the 0.786 Fibonacci retracement level at $1.07 with increasing volatility.
BUILDO (B) tests the $0.48 resistance zone for the third time.
BUILDon is currently trading around $0.4679 after a 14.91% increase on the day, with a high of nearly $0.52 and a low of $0.38. The coin has been consolidating within a wide price range of $0.09 to $0.30 for several months, dating back to September 2025.
The price broke out of that consolidation zone on May 1, 2024, and confirmed the 0.382 Fibonacci retracement zone at $0.32 as the new support area. However, the 0.618 level at $0.48 rejected B's upward momentum three times in May alone.
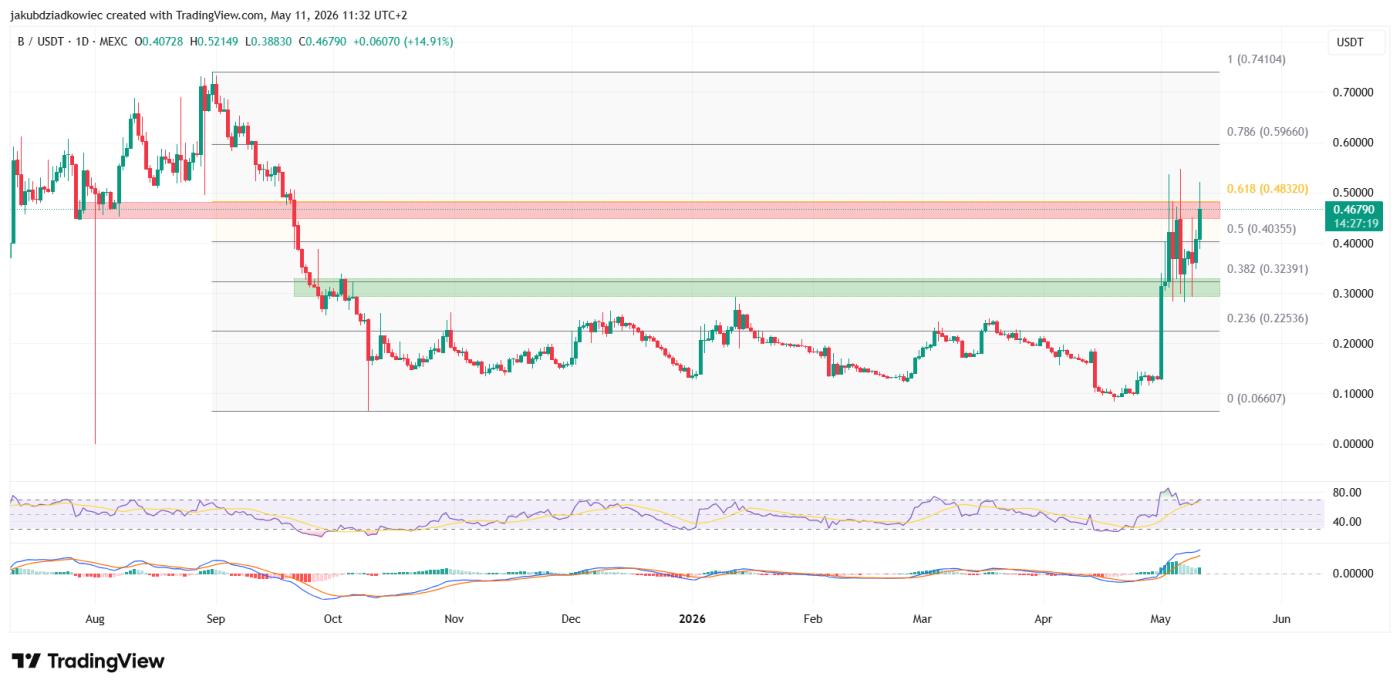 Daily chart of B / Source: Tradingview
The Relative Strength Index (RSI) is currently near 70, indicating strong buying pressure. Meanwhile, the MACD indicator has added another higher green histogram line after a brief pause, signaling that the uptrend is continuing to strengthen.
If the daily candle closes above $0.48 in a firm manner, B has the potential to head towards the 0.786 Fibonacci level around $0.60. Conversely, if it fails to break through, the price could retreat back to the recently established support level of $0.32.
MemeCore (M) adjusts after losing the curve support line.
In contrast to BUILDon, MemeCore is trading at $3.27, down 1.24% on the day and showing clear signs of weakness. The price lost the curved EMA support line at the end of April 2024, ending the uptrend that lasted from February 1, 2024 to the present.
After the break, M corrected to the 0.618 Fibonacci retracement zone at $2.59 before bouncing back. However, the rebound only retested the broken EMA curve as resistance on May 7, 2024, and stopped around $4, corresponding to the 0.236 Fibonacci level.
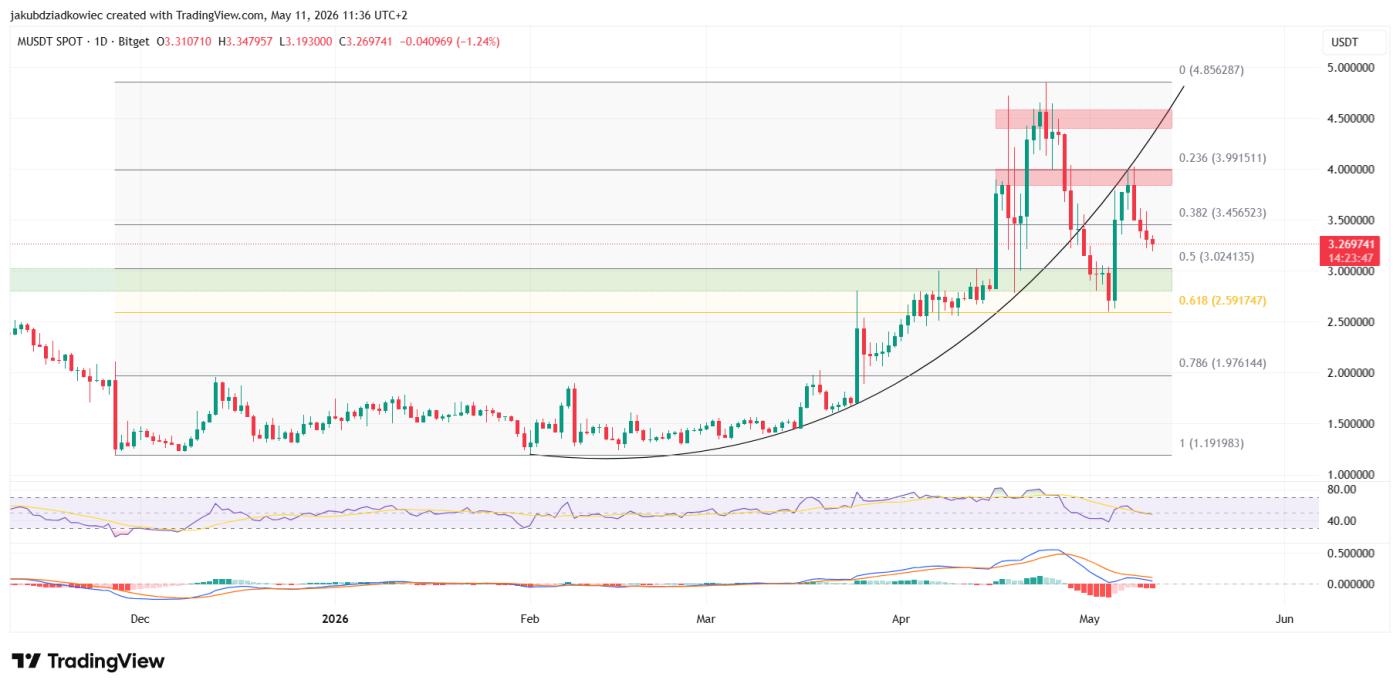 Daily chart of M / Source: Tradingview
The MACD consistently shows higher red histogram bars, indicating increasing bearish momentum. The RSI remains in the equilibrium zone but is trending downwards, signaling continued selling pressure.
If the price continues to correct, it is highly likely to retest the $2.59 area. Conversely, if buyers want to reverse the situation, they need to break above $4 to "break the downtrend," with the next strong resistance being the near peak of $4.85.
Siren (SIREN) “compresses” price below trend line as volatility resumes.
Siren presents a different "scenario" as the price has been compressed below the descending trend line since March 23, 2024. This line previously Vai as resistance on April 17, 2024, and was tested again on May 9, 2024.
SIREN is currently trading around $1.17, close to the 0.786 Fibonacci retracement level at $1.07 – an area that consistently attracts short-term price action. The Bollinger Band Width Percentile (BBWP) indicator has recently recorded very low levels, reflecting a period of sideways price movement and consolidation.
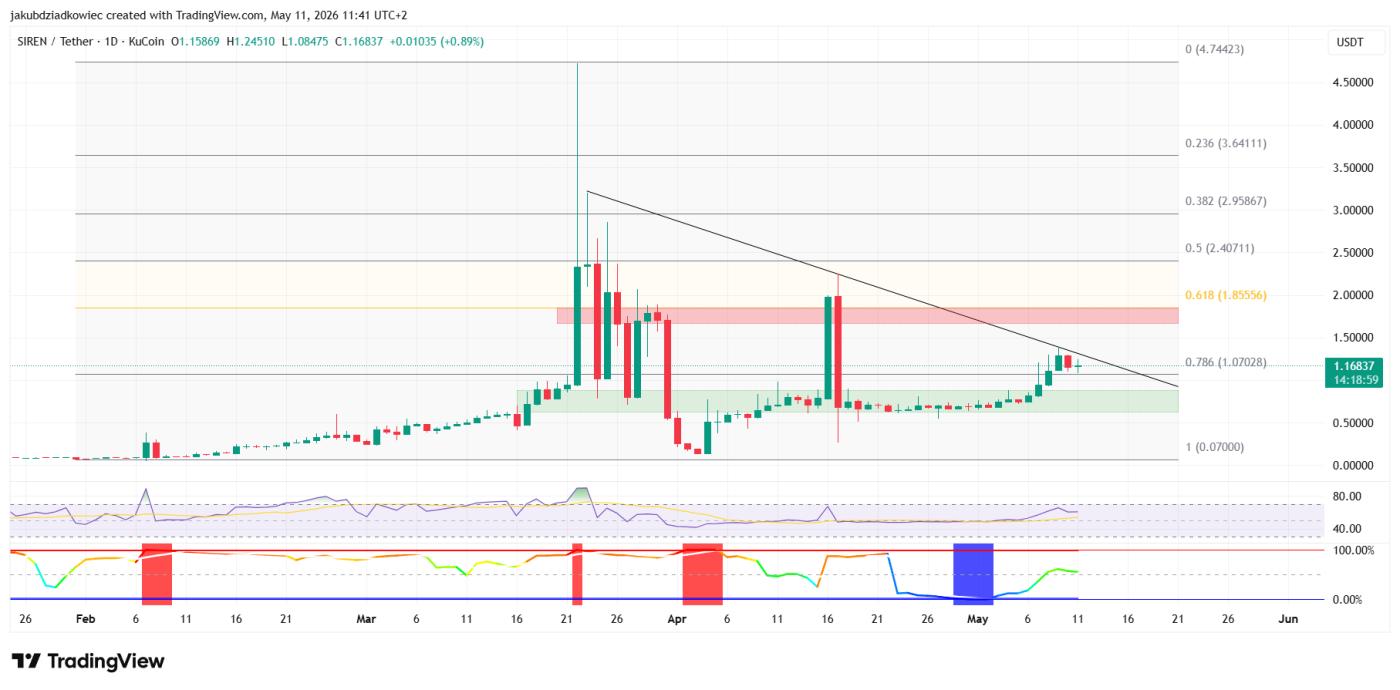 Daily chart of SIREN / Source: Tradingview
However, from May 6th to May 8th, 2024, price volatility began to increase again, with the BBWP gradually rising, although not yet reaching an "extreme" level. The RSI is currently approaching 60 and sloping upwards, indicating increasingly strong upward momentum.
If SIREN successfully breaks the descending trend line, the price could head towards the 0.618 Fibonacci retracement zone at $1.85 and then further to $2.40. Meanwhile, strong long-term support remains at the $0.75 level, and a loss below $1.07 during the day risks a retreat to this Dip .