Three altcoins stand out ahead of the weekend: Zcash (ZEC), Hyperliquid (HYPE), and Flare (FLR) all show bullish technical signals on their daily charts.
Each chart has a different structure, ranging from Fibonacci retests to Falling Wedge breakout patterns. Traders and analysts on X have identified these three altcoins as the most noteworthy opportunities for the next 48 hours.
Zcash (ZEC) holds firm at the 0.618 Fibonacci support level around $534.
Zcash (ZEC) is currently trading at $531.26, up 1.83% in the last 24 hours. The daily chart on Binance clearly shows a Fibonacci structure surrounding the upward momentum from the $185 mark.
Current resistance is at the 0.786 retracement level, near $629, while support is at 0.382 at $400. The price is currently retesting the 0.618 Fibonacci level at $534 — the same level that previously halted the December 29th high.
If the price confirms this area as support, ZEC could continue to rise towards $629. However, the Relative Strength Index (RSI) on the daily chart is showing a slight downward trend.
Conversely, the Moving Average Convergence Divergence (MACD) indicator has just crossed downwards, signaling weakening buying momentum. The next few sessions will determine whether the trend continues to rise or undergoes a deeper downward correction.
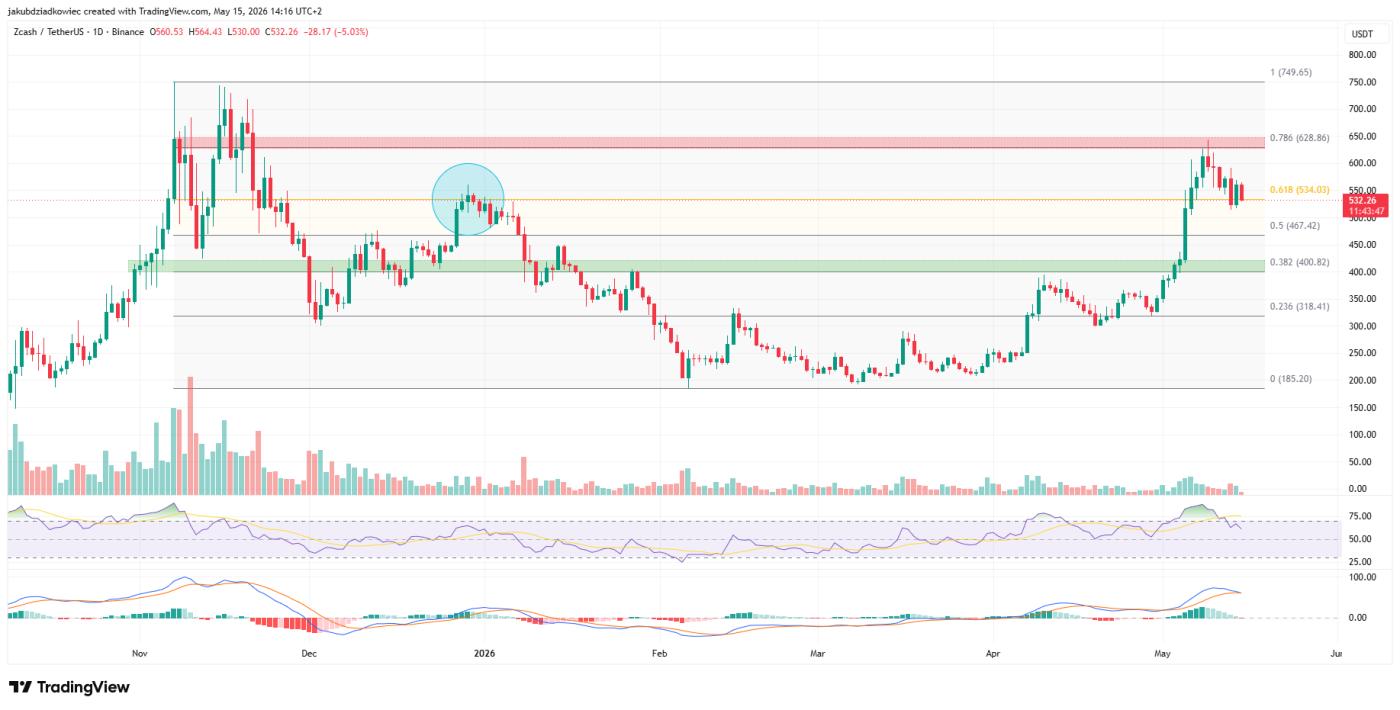 ZEC daily chart. Source: Tradingview
Analyst @0xifreqs on X identified the demand zone at $380 as the springboard for this rally. Simultaneously, this trader also highlighted the $610 area as a key consolidation resistance level above the current price.
“ZEC has recently shown a clear rebound in its price range. The price broke strongly from the $380 support zone and is now consolidating just below the $610 resistance. As long as the higher Dip structure remains, momentum will remain strong. If it breaks clearly above $610, ZEC could open up another strong upward move.”
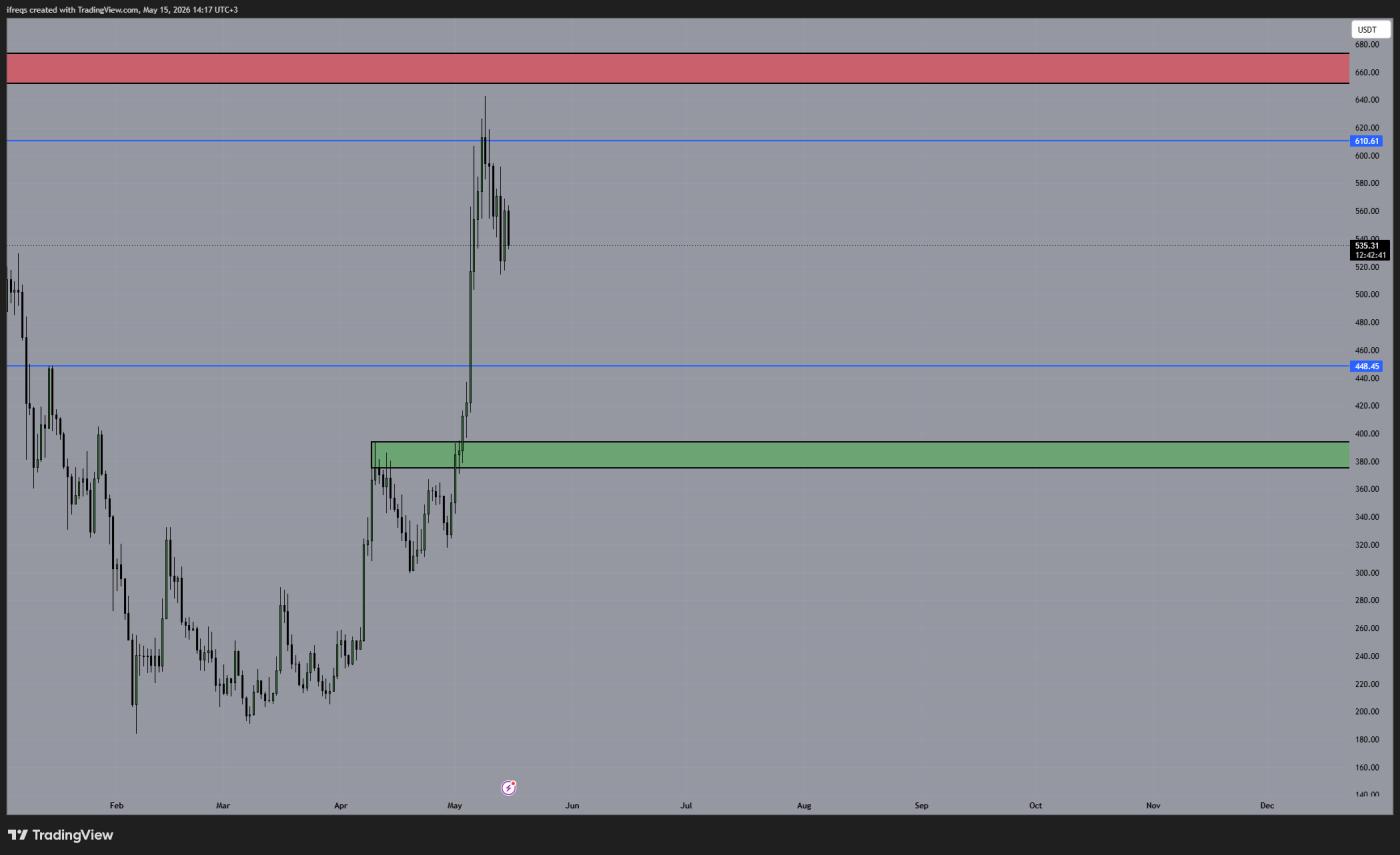 ZEC daily chart / Source: X
Hyperliquid (HYPE) broke through the 0.618 Fibonacci level at $44.50, heading towards $48.
Hyperliquid (HYPE) is currently priced at $45.23, up 12.17% in the last 24 hours. The daily chart on Kucoin shows that the Token just strongly broke through the 0.618 Fibonacci resistance zone at $44.50.
The price has bounced off the ascending trend line extending from the January 2024 Dip , confirming this as a dynamic support zone. According to the data, the Bollinger Band Width (BBW) indicator shows expanding price volatility, while the RSI is also rising, nearing 60.
However, volume remains quite low, meaning the upward momentum needs further confirmation. If volume increases in the next session, the bullish structure will become more solid.
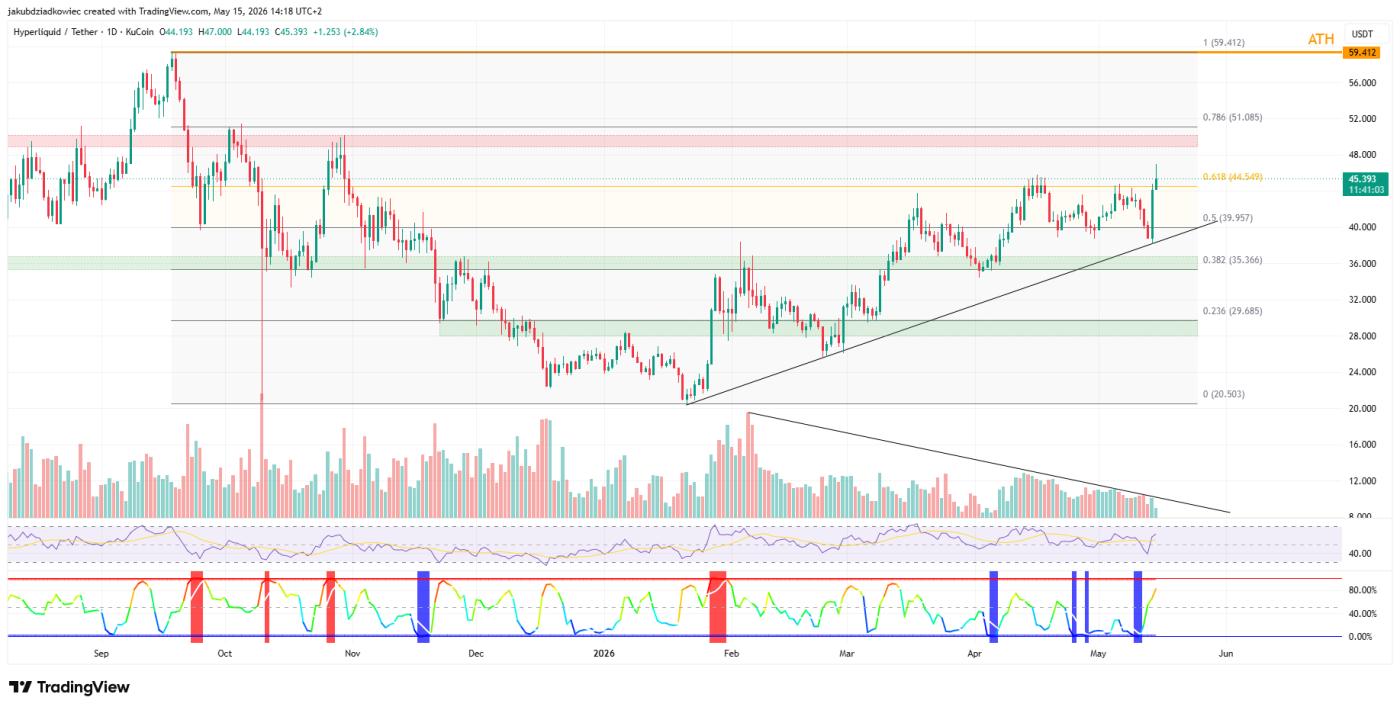 HYPE Daily Chart / Source: Tradingview
Trader @hami8040 on X believes the next resistance zone will be decisive for a new upward trend.
“$HYPE is testing key resistance. If it breaks above $48, it has the potential to rise very quickly to the $60 region or higher. Both the structure and momentum are positive.”
On the analysis chart, this analyst also pointed out strong support zones at $30, $20, and $10. If HYPE breaks above $48, the price target will be towards the historical high around $59 or higher.
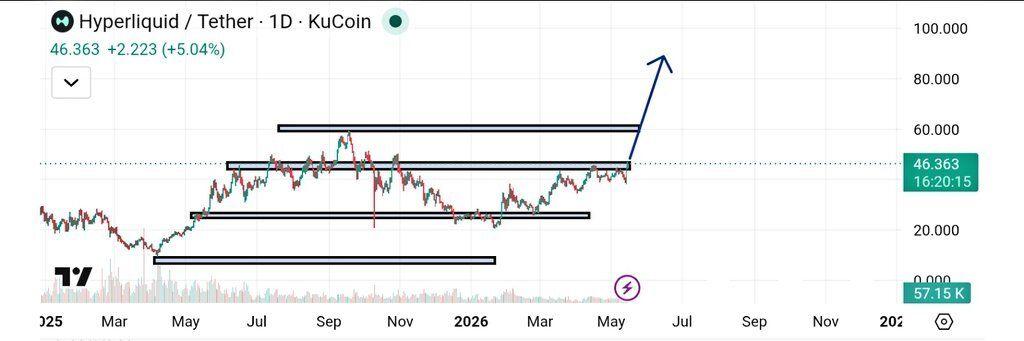 HYPE Daily Chart / Source: X
Flare (FLR) confirms breakout from Falling Wedge pattern and heads towards $0.012.
Flare (FLR) is trading at $0.00958, up 9.93% in the last 24 hours and up 22.11% over the past week. The daily chart on the MEXC exchange shows that FLR has just broken above the very clear resistance zone of $0.0086.
The price is currently moving close to the 0.5 Fibonacci level at $0.010. If it closes above this level, FLR could continue towards the 0.786 Fibonacci level, equivalent to $0.012.
The RSI is at 80, but there are no signs of bearish divergence on the daily chart. Additionally, price volatility is expanding, reinforcing the possibility of FLR continuing to rise over the next few sessions.
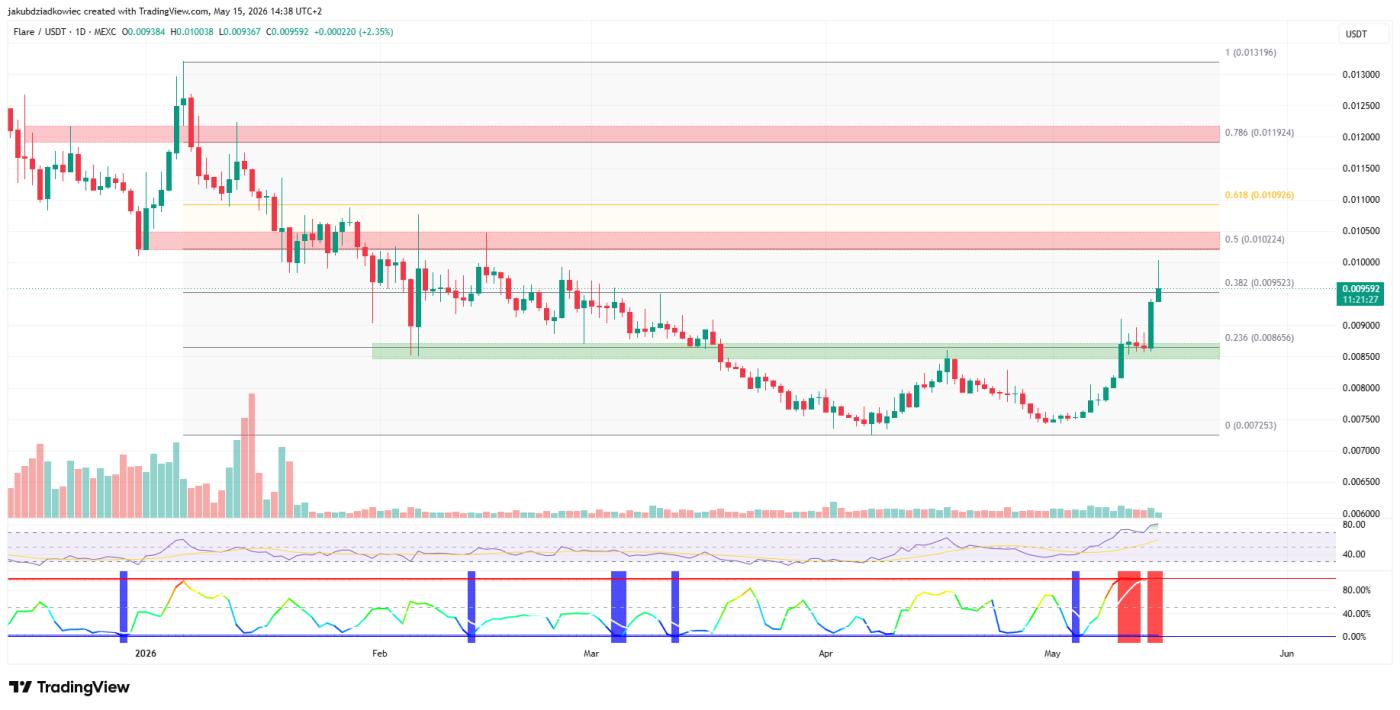 FLR daily chart / Source: Tradingview
Analyst @Karman_1s on X stated that this recent fluctuation in FLR falls within a multi-month-long descending Falling Wedge pattern.
“Flare (FLR) has finally broken free! After months of consolidation within a large Falling Wedge pattern, we've just witnessed a clear breakout on the daily chart. The $0.0096 price level has been reclaimed with strong upward momentum, and volume is beginning to confirm this new trend.”
The price map provided by the expert shows that FLR was constrained by two parallel descending trend lines throughout the period from February to early May. Recently, the candles have consistently closed above the upper edge of this pattern decisively.
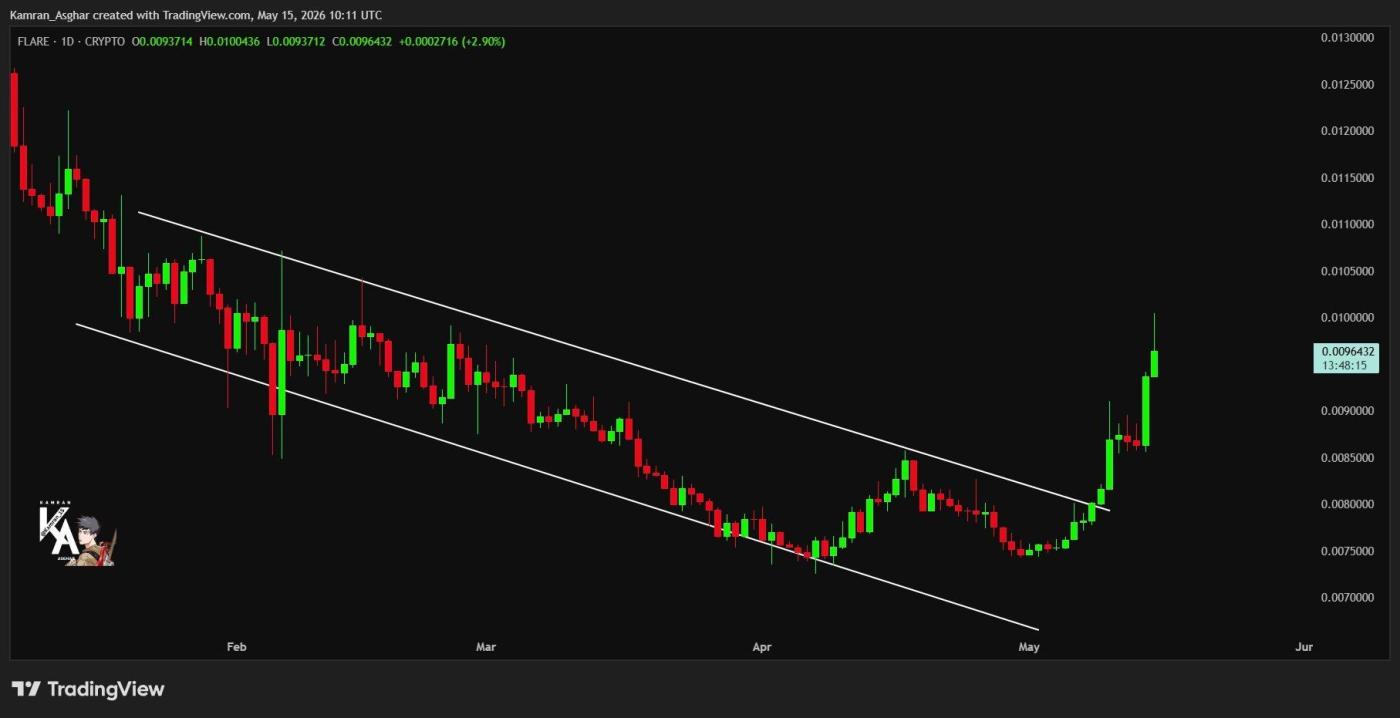 The latest FLR daily chart. Source: X
3 altcoins to watch this weekend: ZEC, HYPE, and FLR
All three altcoins are at critical points with clear opportunities for either a rise or fall as the week draws to a close. For ZEC, the price needs to hold the $534 Fibonacci level to have any hope of reaching the upcoming $629.
HYPE needs a surge in volume to confirm a breakout from the $44.50 level, with the next resistance at $48. Meanwhile, FLR has successfully broken out of the Falling Wedge pattern and is heading towards its nearest target of $0.010.
Therefore, retail investors need to pay attention to factors such as volume, RSI volatility, and liquidation at the end of the week to confirm signals in this group of major altcoins .