Ethereum (ETH) is currently trading around $2,120 after falling below the lower boundary of its ascending parallel channel and slipping below the 0.236 Fibonacci level at $2,140 last week, leaving both buyers and sellers uncertain about the market's next move.
The Bollinger Band Width Percentile is at its lowest level in months, signaling that significant volatility may be imminent. Traders are now watching to XEM if the demand zone around $1,950 holds before the price decides on a new direction.
The 4-hour chart shows that the sellers are still in control.
Since April 26, 2024, ETH has been moving within a descending parallel channel on the 4-hour timeframe. Currently, the Token is trading at $2,122 and retesting the channel's Medium from below.
If ETH breaks above this Medium , it could advance towards the $2,230 region. This is the upper boundary of the descending channel and also a short-term resistance area that many traders are watching.
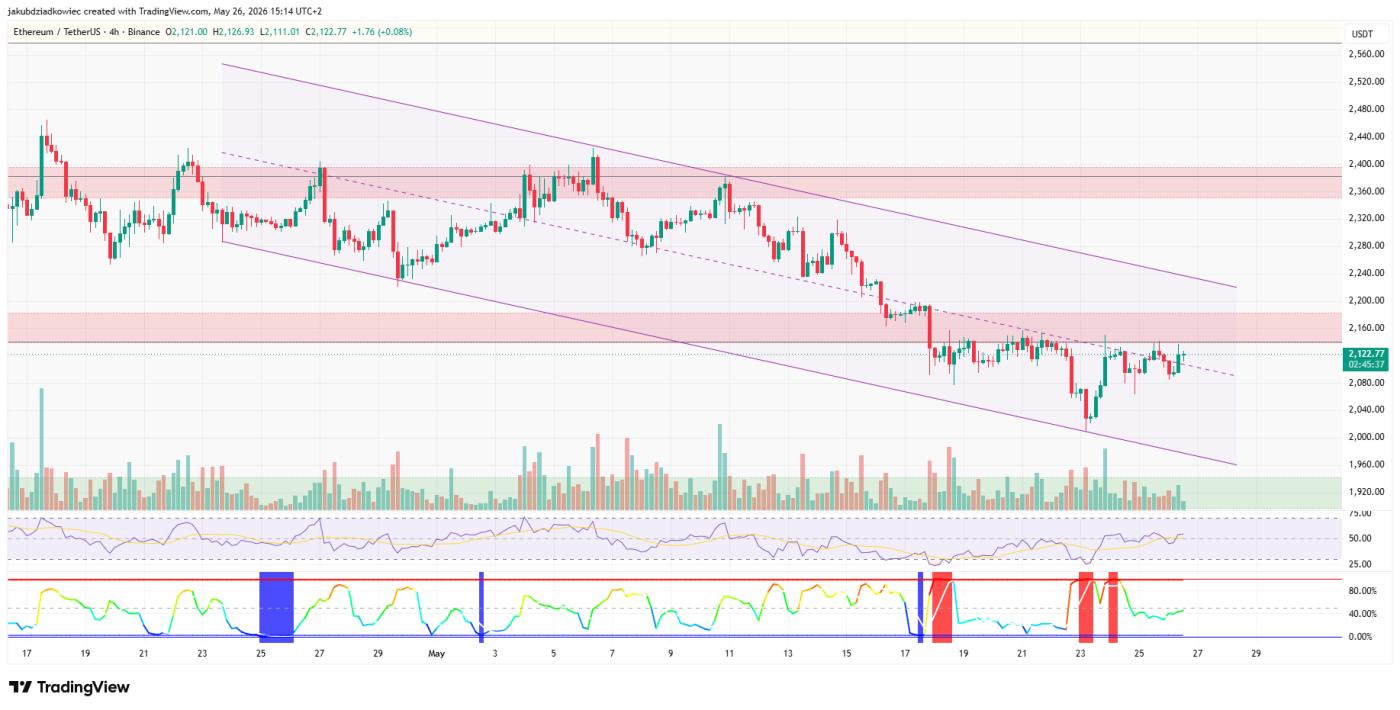 ETH 4-hour chart. Source: TradingView
However, volume is gradually decreasing during this rally. The Relative Strength Index is around 55, which is a neutral zone and has also appeared in previous failed channel rallies.
If volume hasn't returned, the current structure still favors the sellers. If the closing price falls below $2,080, ETH could return to the lower part of the descending channel, and the downtrend is likely to continue.
The demand zone could trigger a rebound to $2,400.
Not all signals indicate a sharp price drop. Some analysts believe ETH is still well supported in the daily demand zone between $1,942 and $2,015, and is preparing for a new rally.
“ETH is still holding above the daily demand zone of $2,000-$1,900 and is attempting to recover. As long as the price remains above this zone, we expect ETH to surge to $2,400 or higher. This view is only invalidated if the price closes below the demand zone,” Crypto Candy Chia .
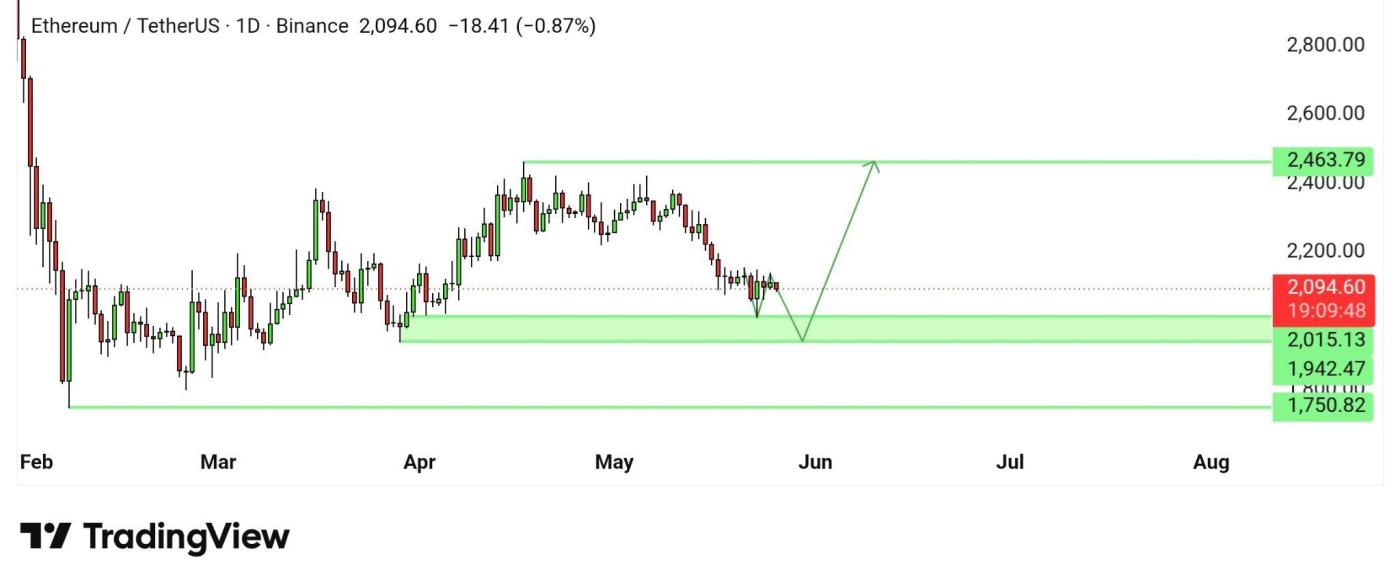 ETH daily chart. Source: X
This assessment depends on whether buyers have enough support in the green zone, preventing the price from closing below $1,942. If the price bounces out of this zone, ETH could repeat previous rallies to around $2,463.
If ETH bounces back, the price could also return inside the ascending channel that was broken last week. However, if it fails to hold this demand zone, the upside potential will lose its value.
Ethereum Price Forecast: Will it rise to $2,382 or fall to $1,920?
Looking at the daily chart, Ethereum is exhibiting both signals. ETH has broken below the lower boundary of the ascending parallel channel that has lasted since February 7, 2024. The price has also fallen below the 0.236 Fibonacci level at $2,140.
The Bollinger Band Width Percentile currently shows a massive contraction. Previously, such signals typically indicated significant volatility within the next two weeks, whether upward or downward.
If ETH regains its upward channel, the price will have a chance to advance towards the 0.382 Fibonacci level at $2,382, which will be the next major resistance. If this level is broken, the next target is the "golden ratio" level at $2,772.
If ETH fails to hold above $1,950, it could fall to $1,920, a strong support level that traders are watching. If the price weakens further, ETH could drop to the February Dip near $1,750.
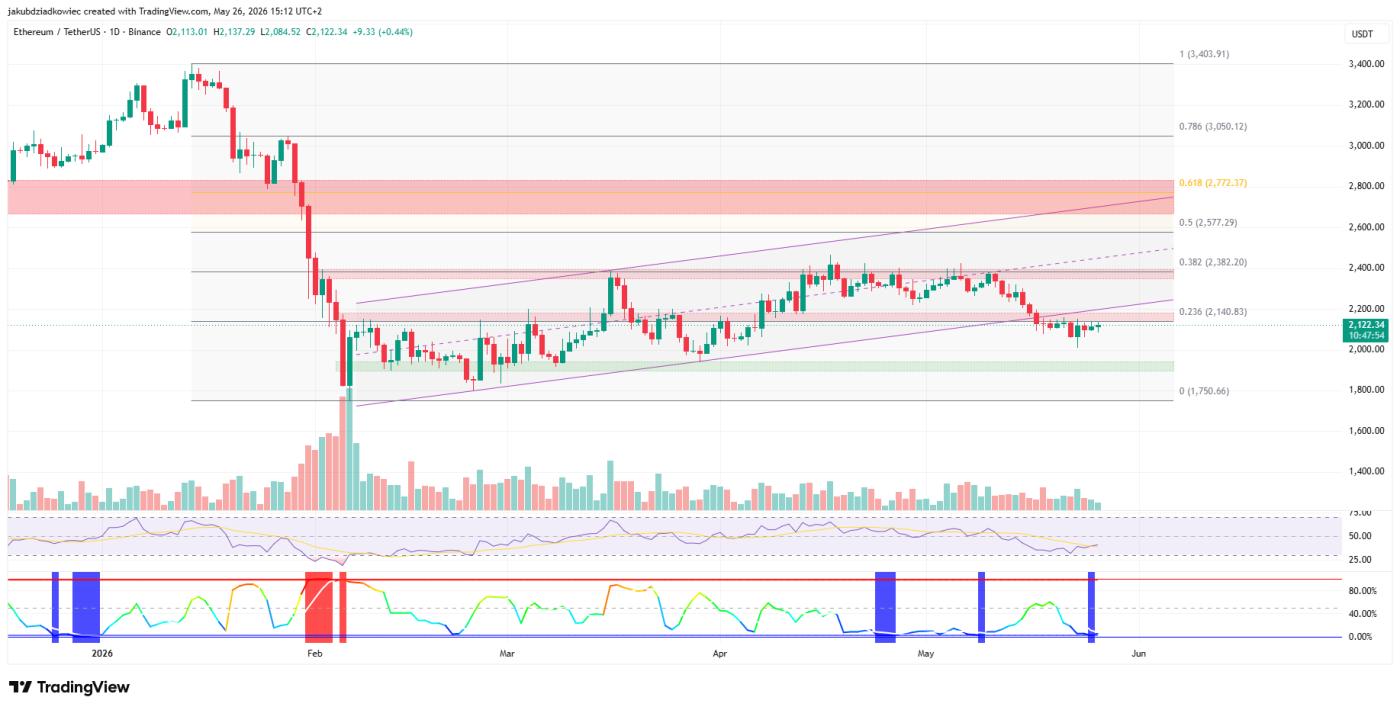 ETH daily chart. Source: TradingView
The Relative Strength Index is currently recovering slightly from negative territory but remains around 40. This index confirms that market momentum has not yet shifted to the buying side, consistent with the bearish forecast made earlier this quarter.
The next two weeks are expected to clearly determine the trend of ETH. Whichever side breaks out of the volatile sideways trading range first will be the one to control the ETH price trend in Q3.