A well-known market expert has presented what he calls the “big yellow triangle” guiding $XRP, setting price targets of up to $60 if historical trends hold.
$XRP showed signs of strength earlier this week when it climbed to $1.29. However, the asset could not push above that level, recently dropping to $1.18, down 11% so far this month.
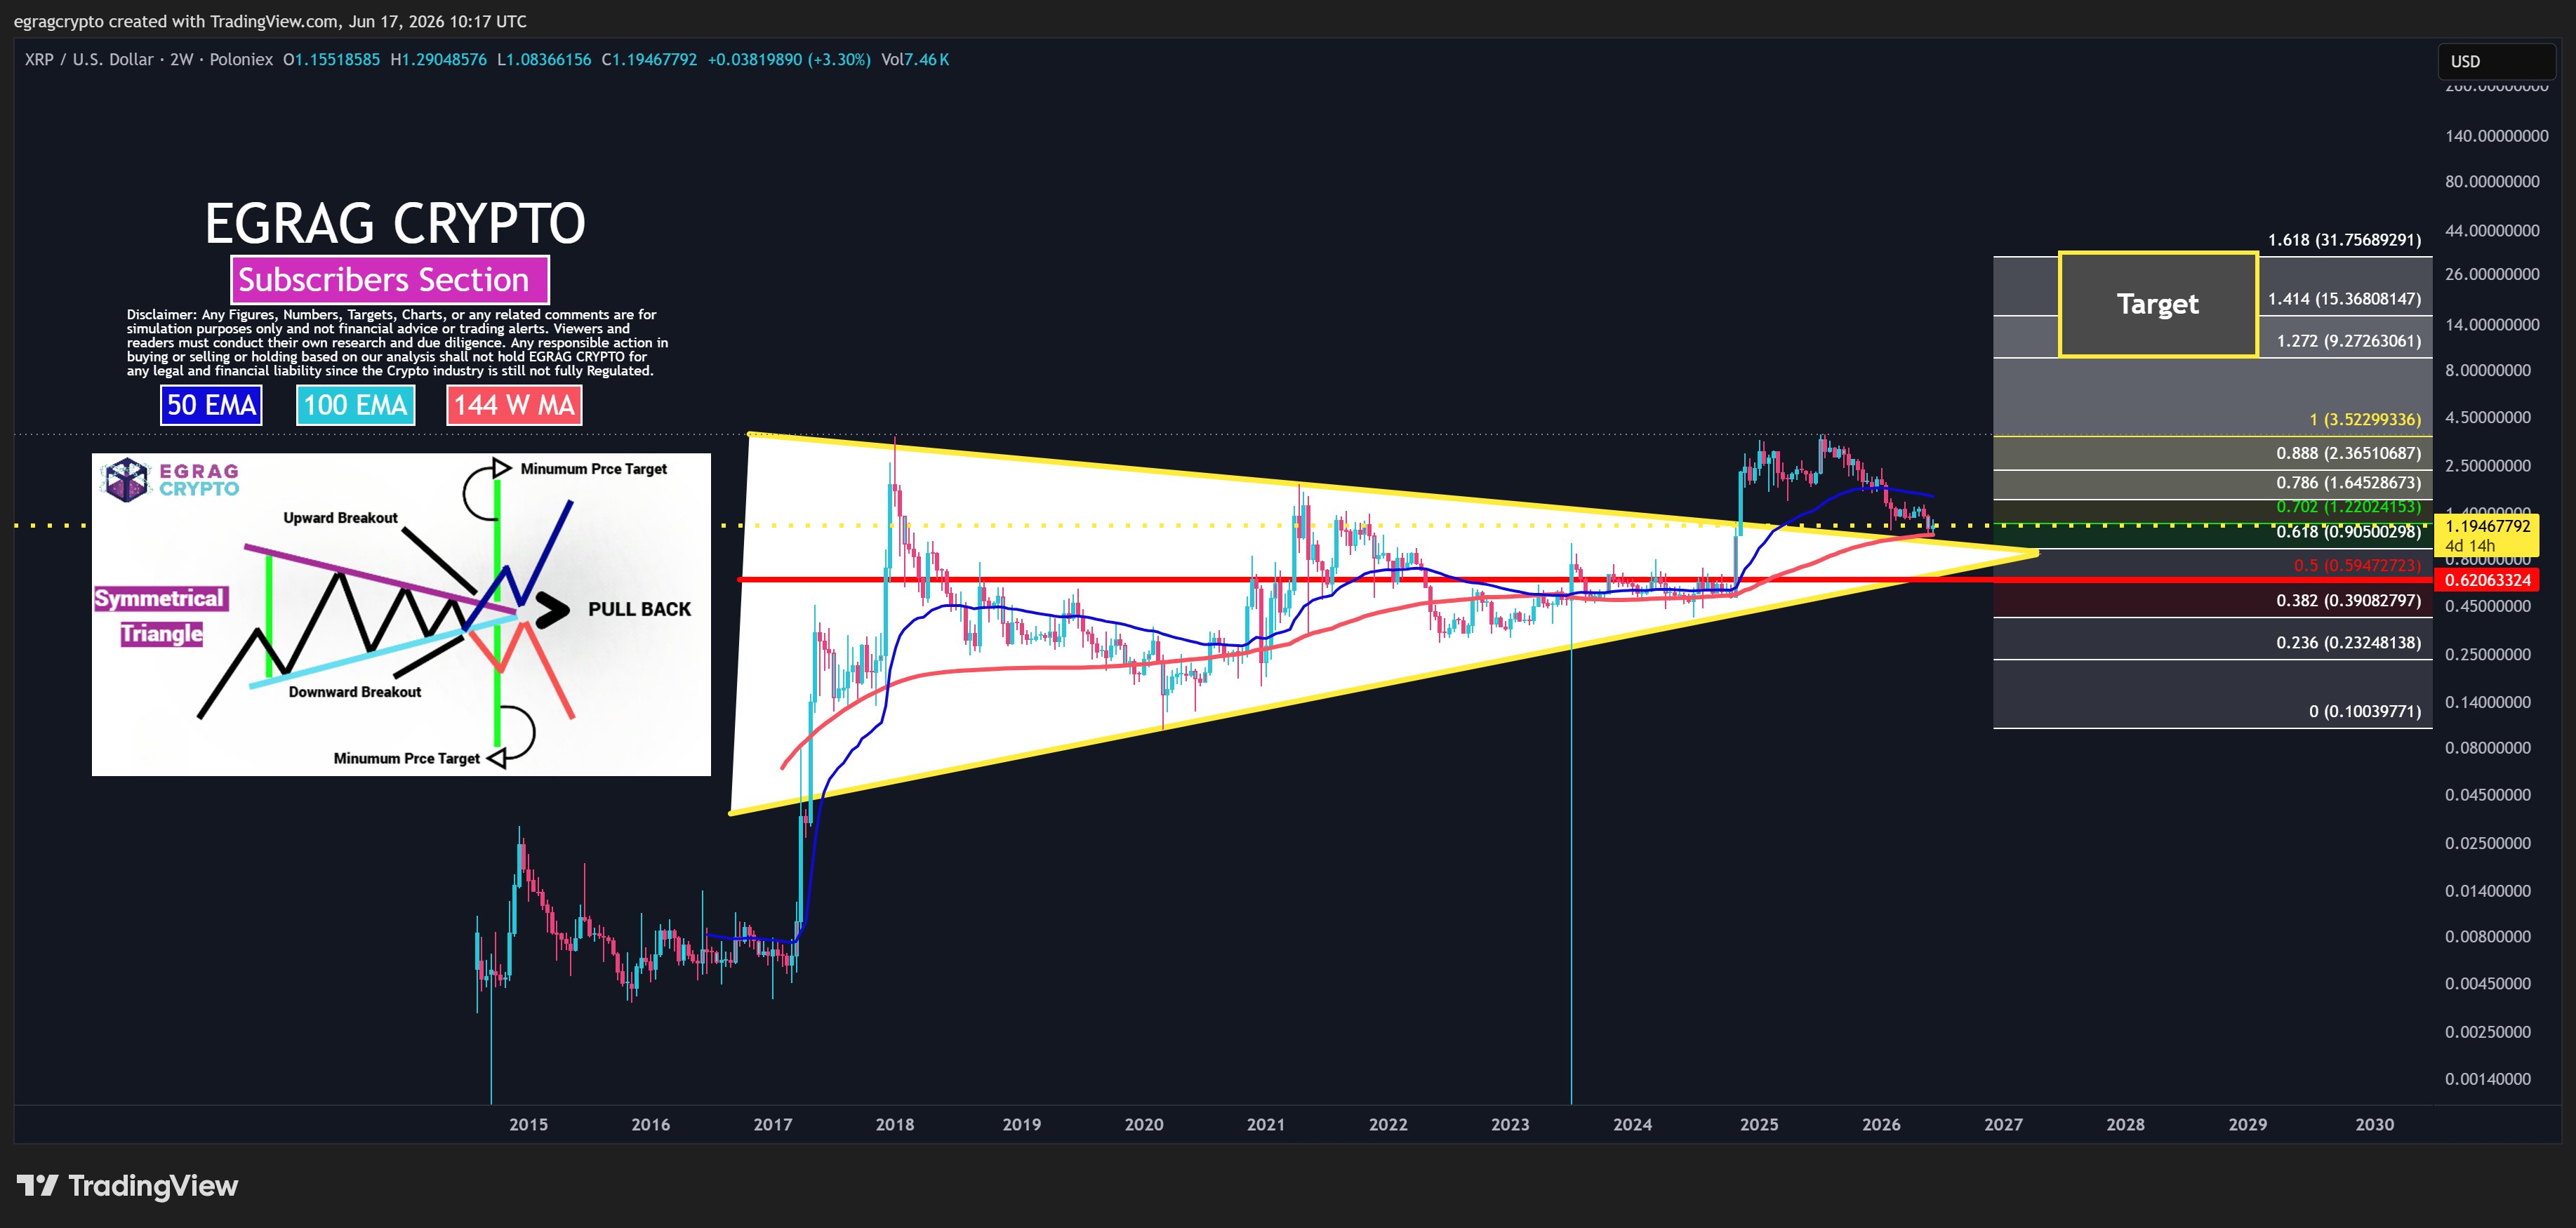
While $XRP continues to struggle, popular market analyst EGRAG Crypto called attention to a large yellow triangle on the 2-week chart and suggested that it could eventually send the price to levels ranging from $6.5 to $60 if history repeats.
Historical $XRP Rallies
In his analysis, EGRAG highlighted three major historical reference points around this yellow triangle, which has acted as a reliable guide toward higher targets.
Specifically, the first $XRP market cycle produced a gain of around 8,000%. Meanwhile, the following cycle recorded a rise of roughly 1,900%. For the current cycle, the analyst presented a more conservative projection of about 909%.
Considering the historical context, EGRAG Crypto presented an important question: what if $XRP follows the same triangle pattern once again?
He noted that whenever $XRP respected the lower boundary of this large triangle and entered an expansion phase, the asset delivered massive gains. Those past performances now act as the basis for his current projections.
The Most Bullish Scenario Targets $60 for $XRP
The highest target in EGRAG’s analysis comes from $XRP’s earliest major rally within the larger triangle structure.
During that period, the asset surged approximately 8,000%. If $XRP repeats a similar move from the lower end of the current triangle, the price could reach about $60.
However, EGRAG clarified that this is not his main expectation. He noted that, while he does not rule out the possibility, it actually represents the most aggressive outcome and one with the lowest probability among the projected targets.
How $XRP Could Hit $13
The second scenario comes from $XRP’s performance during the previous market cycle. At that time, the asset recorded a gain of roughly 1,900% after moving from the lower section of the triangle structure.
Applying a similar percentage increase from the projected pinkish-line base on the current chart results in a target near $13. According to EGRAG, this appears more realistic because the crypto market has become more mature than it was during $XRP’s earlier years.
Although a move to $13 would be less dramatic than the 8,000% rally, it would still represent an impressive increase. As a result, EGRAG says the $13 area represents the most balanced macro target if $XRP follows the same pattern seen in the previous cycle.
Conservative $XRP Target of $6.5
Meanwhile, EGRAG also presented a more modest outlook based on a projected gain of 909%. In this scenario, $XRP would rise to around $6.5, placing it within an important Fibonacci expansion zone.
He admitted that a $6.5 target may disappoint investors who expect $XRP to reach double-digit prices. However, he stressed that the chart does not point to a single destination, but instead reveals a range of possible outcomes.
Essentially, the analyst noted that the conservative macro move of 909% points to a range between $6.50 and $9.27 or higher. However, the move of 1,900% supports a target near $13.
Meanwhile, a stronger Fibonacci expansion based on the 1.414 and 1.618 extension levels projects a range between $15.36 and $31.75. The most extreme case, based on the earlier 8,000% rally, points to $60.
According to EGRAG, the higher the target, the lower the probability. Despite this, he believes the current structure leaves room for each of these possibilities.
Conditions for a Breakout
Despite presenting several upside targets, EGRAG emphasized that none of them become valid simply because investors hope they will. He argued that $XRP must first confirm its chart structure before any of the projections can play out.
For that to happen, $XRP must continue holding the lower boundary of the yellow triangle, avoid losing major macro support, break out of the triangle pattern, reclaim important Fibonacci levels, turn former resistance into support, and move into an expansion phase with strong volume and buying interest.
Without a confirmed breakout, the targets remain projections. If $XRP achieves that breakout, however, the targets become realistic possibilities based on historical behavior and chart probabilities.