
Bitcoin price is attempting a recovery wave above the $27,000 resistance. BTC could gain bullish momentum if it clears the $27,700 resistance zone.
- Bitcoin is slowly moving higher from the $26,500 support.
- The price is trading below $27,500 and the 100 hourly simple moving average.
- There is a key bearish trend line forming with resistance near $27,700 on the hourly chart of the BTC/USD pair (data feed from Kraken).
- The pair could start a fresh decline if it fails to clear the $27,700 resistance zone.
Bitcoin Price Faces Hurdle
Bitcoin price remained well bid above the $26,500 support zone. BTC formed a base and recently started a fresh increase above the $26,850 resistance zone.
There was a move above the $27,000 resistance zone. The price even spiked above the 50% Fib retracement level of the key decline from the $28,240 swing high to $26,490 low. However, the bears seem to be active near the $27,500 resistance zone.
Bitcoin price is now trading below $27,500 and the 100 hourly simple moving average. There is also a key bearish trend line forming with resistance near $27,700 on the hourly chart of the BTC/USD pair.
On the upside, an immediate resistance is near the $27,500 level and the 100 hourly simple moving average. The next major resistance is near the $27,700 zone and the trend line. The trend line is near the 61.8% Fib retracement level of the key decline from the $28,240 swing high to $26,490 low.
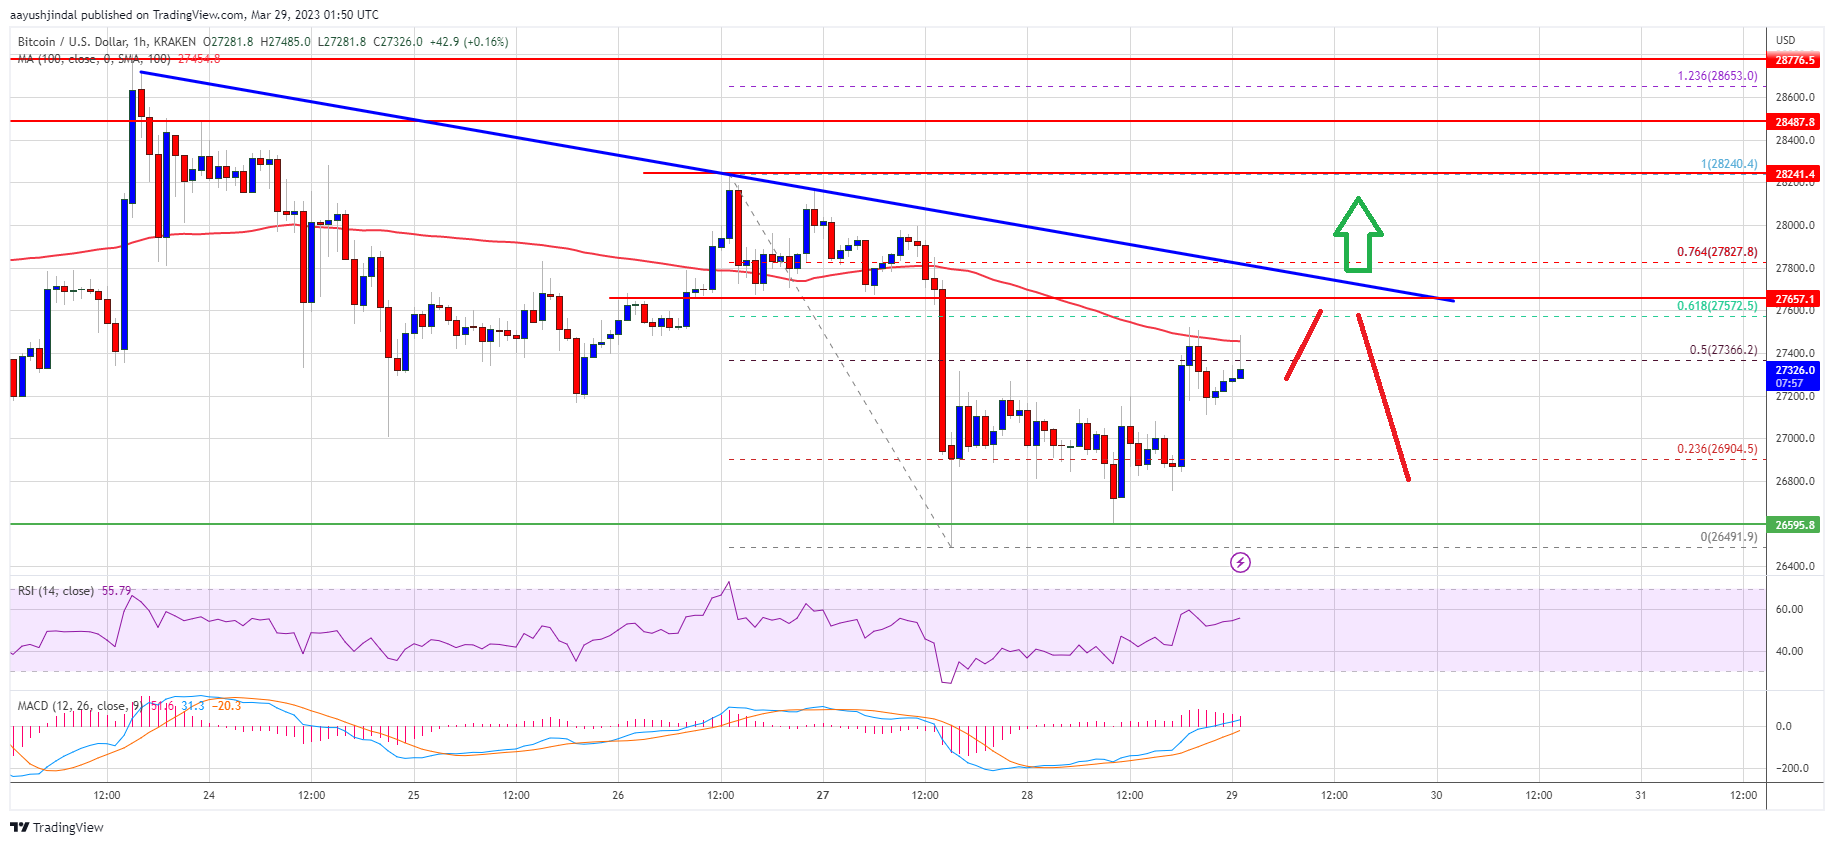
Source: BTCUSD on TradingView.com
A close above the trend line resistance might send the price towards the $28,200 resistance. In the stated case, the price could climb higher towards the $28,800 resistance, above which the price might start a steady increase.
Fresh Decline in BTC?
If bitcoin price fails to clear the $27,700 resistance, it could start another decline. An immediate support on the downside is near the $27,000 zone.
The next major support is near the $26,650 zone. A downside break below the $26,650 support might spark bearish moves. The next major support is near the $25,500 level, below which the bears might take control.
Technical indicators:
Hourly MACD – The MACD is now gaining pace in the bullish zone.
Hourly RSI (Relative Strength Index) – The RSI for BTC/USD is now above the 50 level.
Major Support Levels – $27,000, followed by $26,650.
Major Resistance Levels – $27,500, $27,700 and $28,200.


