

Bitcoin Cash (BCH) price has been unable to sustain its uptrend even though it has broken through a key long-term resistance area.
The readings from the short-term timeframes are not enough to determine the direction of the trend. Therefore, the direction of the next move will be very important in doing so.
BCH price has been falling below the descending resistance line since July 2021. The drop resulted in as low as $87 in November 2022.
The price bounced back after that and rallied higher since then. At the beginning of 2023, it broke above the resistance line after 609 days. Breakouts from such long-term structures often lead to marked upward movements.
However, this is not the case for BCH. The price barely pumped after the breakout, peaking at $155 on Feb. 20.
Also, it has been falling since then and is currently trading close to the breakout level.
Also, the weekly Relative Strength Index (RSI) does not provide any decisive clues as to the direction of the trend.
Traders use the RSI as a momentum indicator to gauge XEM the market is overbought or oversold to determine whether to accumulate or sell an asset.
If the RSI is above 50 and trending up, the bulls still have the advantage, but if the index is below 50, the opposite is true.
The indicator is moving upwards but trading slightly below the 50 level. This is a sign of an indeterminate trend.
The nearest horizontal support and resistance levels are at $100 and $150 respectively.
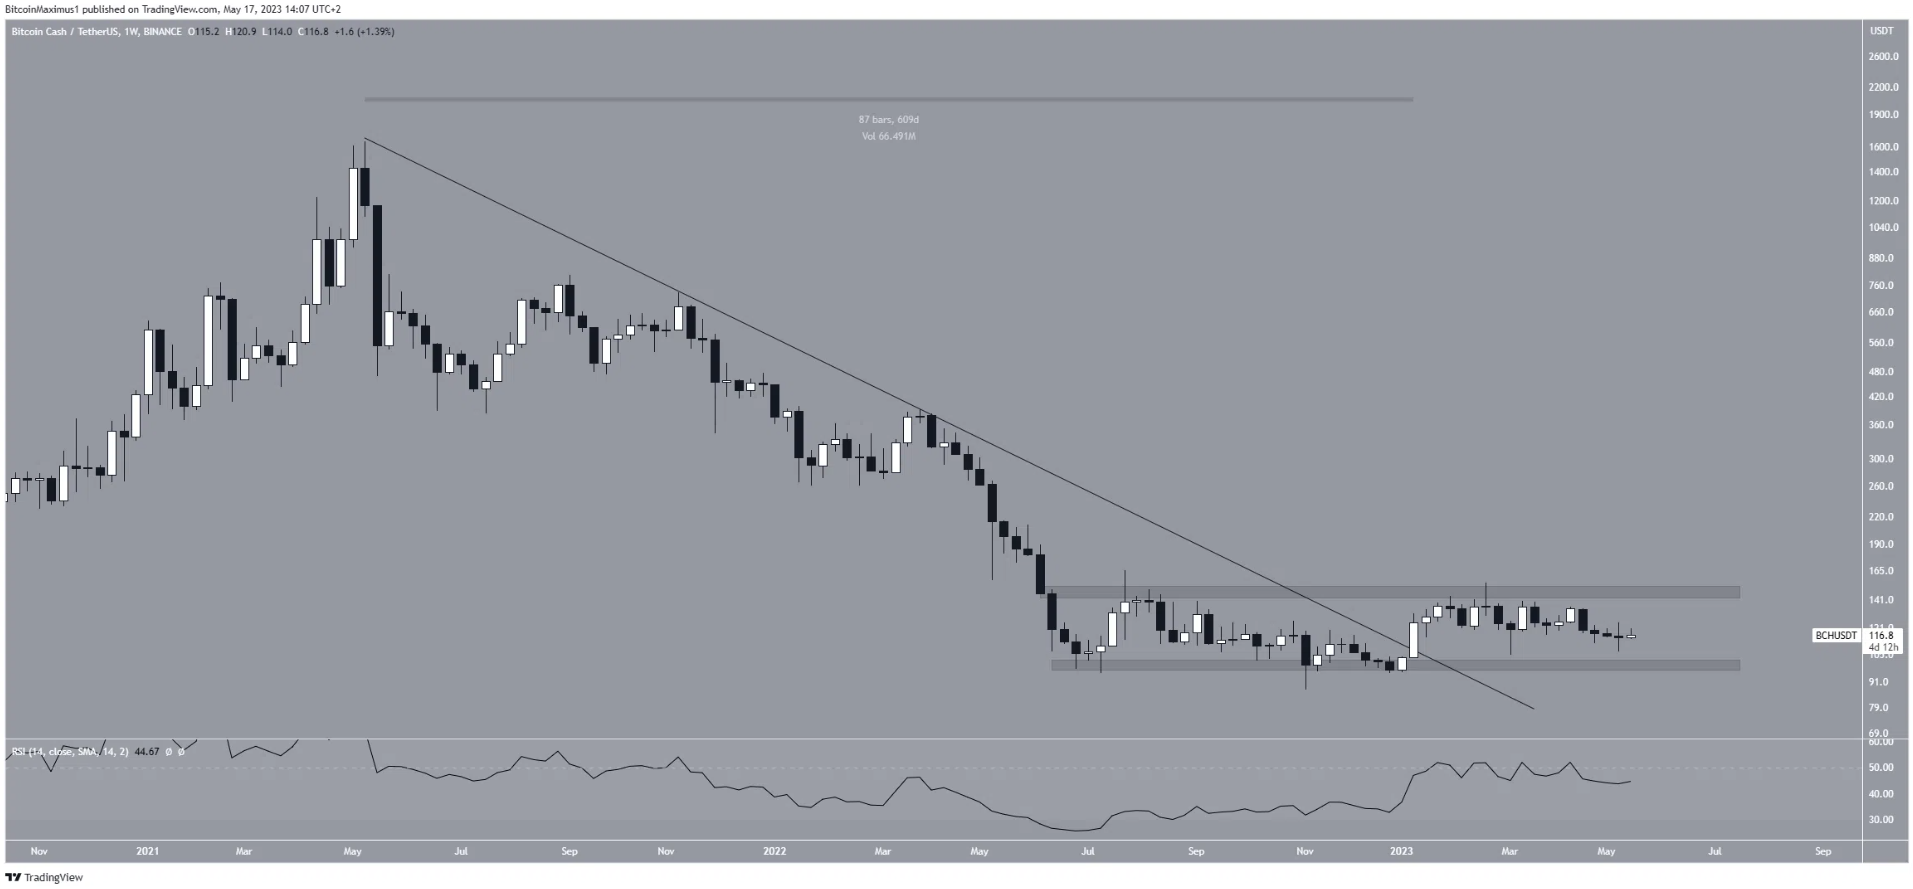
Weekly BCH/USDT Chart | Source: TradingView
Technical analysis from the daily timeframe does not help in determining the direction of the trend. Price action shows both bullish and bearish signs.
During the time BCH price moved along the descending resistance line, it twice dropped below the horizontal support area of $115. However, it is uncertain whether the price has regained this zone or is in the process of confirming it as resistance.
Furthermore, the daily RSI is moving freely above and below 50. This usually happens when the direction of the trend is not determined.
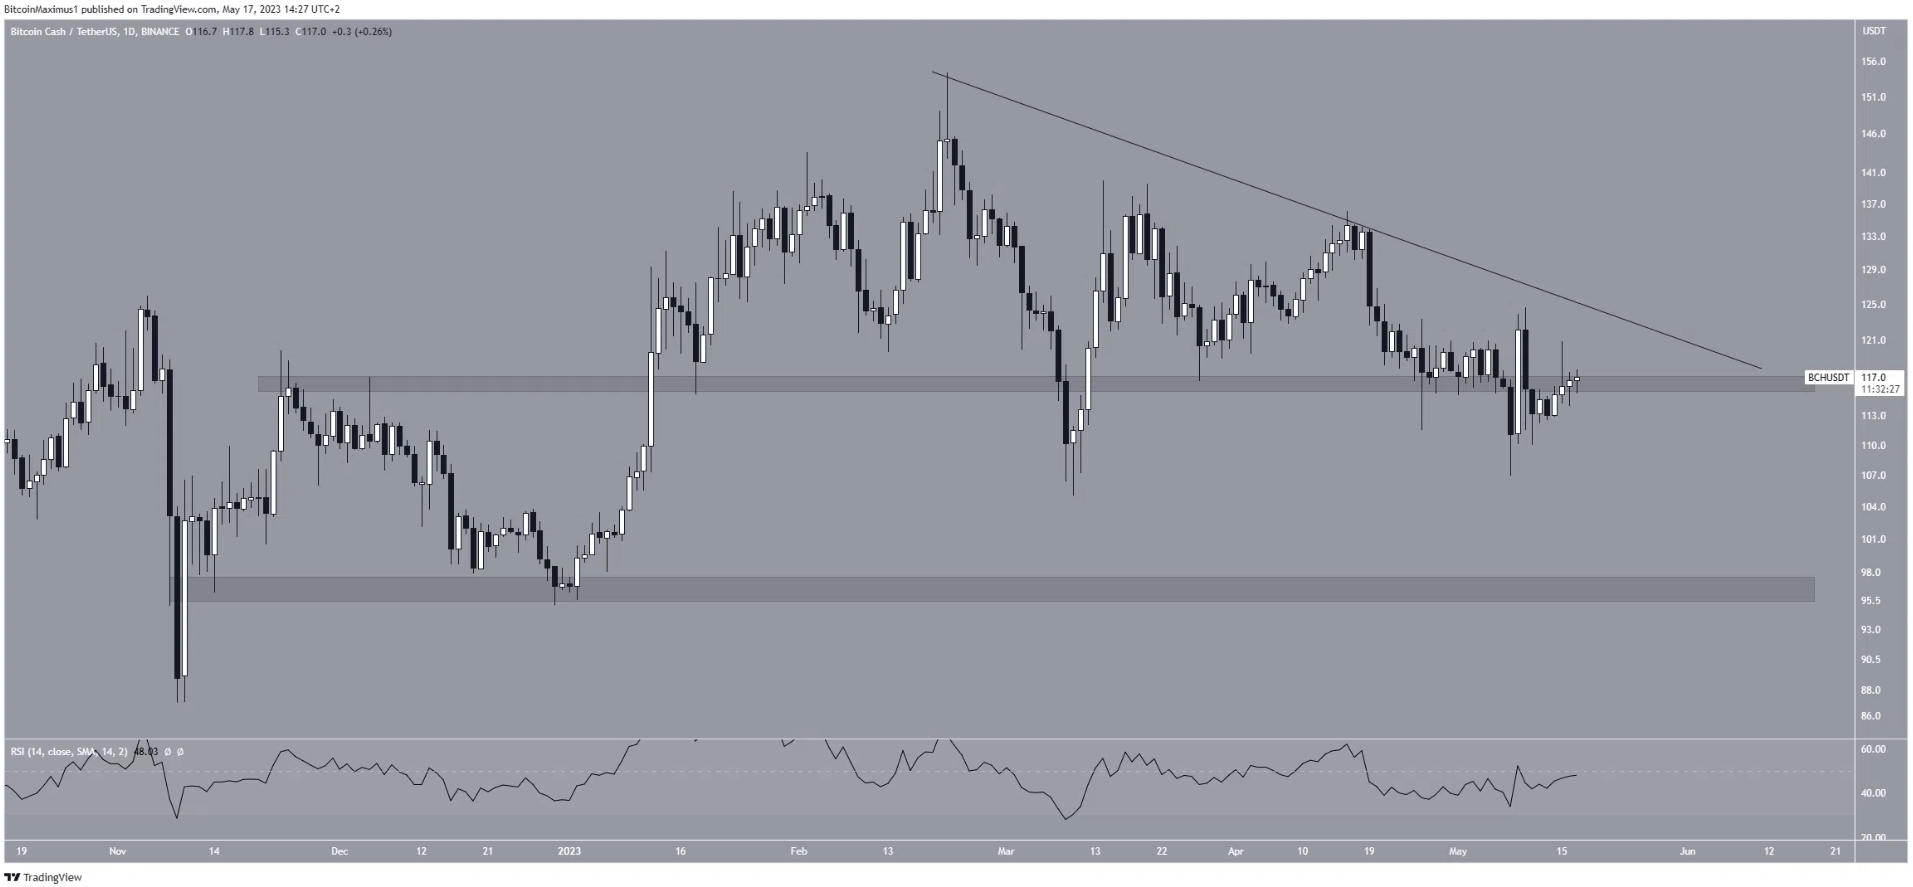
BCH/USDT Daily Chart | Source: TradingView
Therefore, the long-term BCH price prediction will likely be determined by a breakout or drop from the $150 region.
The former can help the price rise to $200, while the latter can cause the price to drop to $70.
You can XEM the coin prices here .
Disclaimer: This article is for informational purposes only, not investment advice. Investors should research carefully before making a decision. We are not responsible for your investment decisions.
Join Telegram of Bitcoin Magazine: https://t.me/tapchibitcoinvn
Follow Twitter: https://twitter.com/tapchibtc_io
Follow Tiktok: https://www.tiktok.com/@tapchibitcoin
SN_Nour
According to Beincrypto


