

Author: DEFI EDUCATION / Source: https://defieducation.substack.com/p/how-liquidity-impacts-m
Translation: Huohuo/Vernacular Blockchain
On August 17, the cryptocurrency market lost approximately $120 billion in value in a single day, equivalent to approximately 11% of the total market capitalization.
While the market drop is no surprise to our paying subscribers (we already predicted the end of the echo bubble back in March), such a dramatic single-day drop is still unusual in the cryptocurrency space.
Why does this happen?
Today, we’ll explore the concept of liquidity to explain why relatively small buying and selling volumes can have a disproportionate impact on price and overall market capitalization. Liquidity is a dynamic factor that affects all markets. Even the U.S. stock market famously lost approximately $1 trillion (about 9%) of its value in one day due to a lack of liquidity (the “Flash Crash” event on May 6, 2011).
We'll share some useful concepts and actionable advice to help you understand periods of low liquidity and manage your investment risk accordingly.
1. Case Study: Flash Crash Incident
On May 6, 2010, major U.S. stock indexes plummeted within minutes, reaching prices 10% below the previous day's closing price (with many stocks falling even further). Then the market rebounded. At first, traders and regulators were confused, but now that regulators and industry players have access to time-stamped trading data (much like blockchain), some root causes can be identified.

Flash Crash Events in Graphical Form | Source: Nanex Flash Crash Report
According to the report, a combination of conditions led to the crash:
1) Insufficient liquidity/fragility of the market itself
2) Withdrawal of market makers
3) The phenomenon of toxic transaction flow
4) Impact of large-scale derivatives orders
Low Liquidity Liquidity refers to the extent to which an asset can be bought or sold quickly without causing a significant change in price . There is a relationship between liquidity and volume: A larger volume market provides more opportunities for market makers to provide liquidity for profit → this attracts competition → more liquidity is provided → the market can absorb more Large orders without affecting price fluctuations.
Higher liquidity is beneficial to investors because it reduces transaction costs and leads to greater price stability. This was evident on a day when the entire cryptocurrency market fell - the less liquid "minor coins" fell more on a percentage basis than the more liquid "major coins" (Bitcoin and Ethereum).
Liquidity is also important because it determines the cost of buying or selling. If an investor wants to buy $100,000 in Bitcoin or Ethereum, the transaction can be completed instantly and costs only a few basis points. In small currencies, an order to buy $100,000 may need to be split into five separate orders of $20,000, each of which will be filled with a deviation of 1% from the market's mid-price. In other words, you'll need to pay $1,000 just to open a position in a small coin, while investing in Bitcoin only costs around $175. And investors will pay transaction costs again when they sell.
Liquidity includes orders posted in the limit order book (agreed commitments to buy or sell if other traders accept the price and the order has not been withdrawn), tokens deposited in the AMM liquidity "pool", and willingness to buy or the potential of a selling trader to enter the market.
A simple example: there may only be buy orders for $5 million worth of Ripple XRPToken in a price range that is 5% below the current trading price, but if the price drops 5% quickly, it may attract new buyers , especially if it is believed that this drop was caused by an unexpectedly large sell order; or if XRP was priced higher on other trading platforms, allowing for arbitrage. This liquidity may not show up on the trading platform, but it is still there. Liquidity may be reduced if large-scale or multiple participants exit the market or are unable to buy or sell - for example, after FTX went bankrupt.
On May 6, 2010, the U.S. stock market experienced a sharp reduction in liquidity. Buyer's market depth (the number of bids for a security) fell to about 25% of normal. The reasons and consequences are not clear - lack of liquidity means that the price impact of any order increases, in other words, the market has a larger decline for a sell order of the same value. Market declines can also lead to illiquidity as participants reduce risk in anticipation of more selling pressure.
In times of market weakness, illiquidity may occur as traders willing and able to buy are temporarily absent. In May 2010, U.S. markets had rebounded from their March 2009 lows (after an 18-month bear market), but the economy remained weak. In August 2023, crypto majors have rebounded from the November 2022 lows (after a 12-month bear market), but overall interest in cryptocurrencies remains low.
The sudden disappearance of liquidity in both events exacerbated price volatility, creating a feedback loop: as prices became more volatile → market participants became more hesitant and unwilling to trade → further reducing liquidity → leading to Those who need to trade have orders with greater price impact to reduce risk or limit losses in their portfolio → increase price volatility.
In individual stocks or tokens, illiquidity may also occur, often after a prolonged period of decline. why? After years of falling prices, there usually aren't many sellers left, so the market can rise quickly with fewer transactions. A large single-day percentage increase attracts reactive investors who want to buy stocks or tokens that have performed well recently, but there is limited supply in the market and cannot meet demand.
2. Withdrawal of market makers
Market makers play a vital role in providing liquidity to financial markets. They are constantly willing to buy and sell assets, ensuring traders always have immediate access to trades. On May 6, market makers either reduced their trading activity or exited the market entirely.
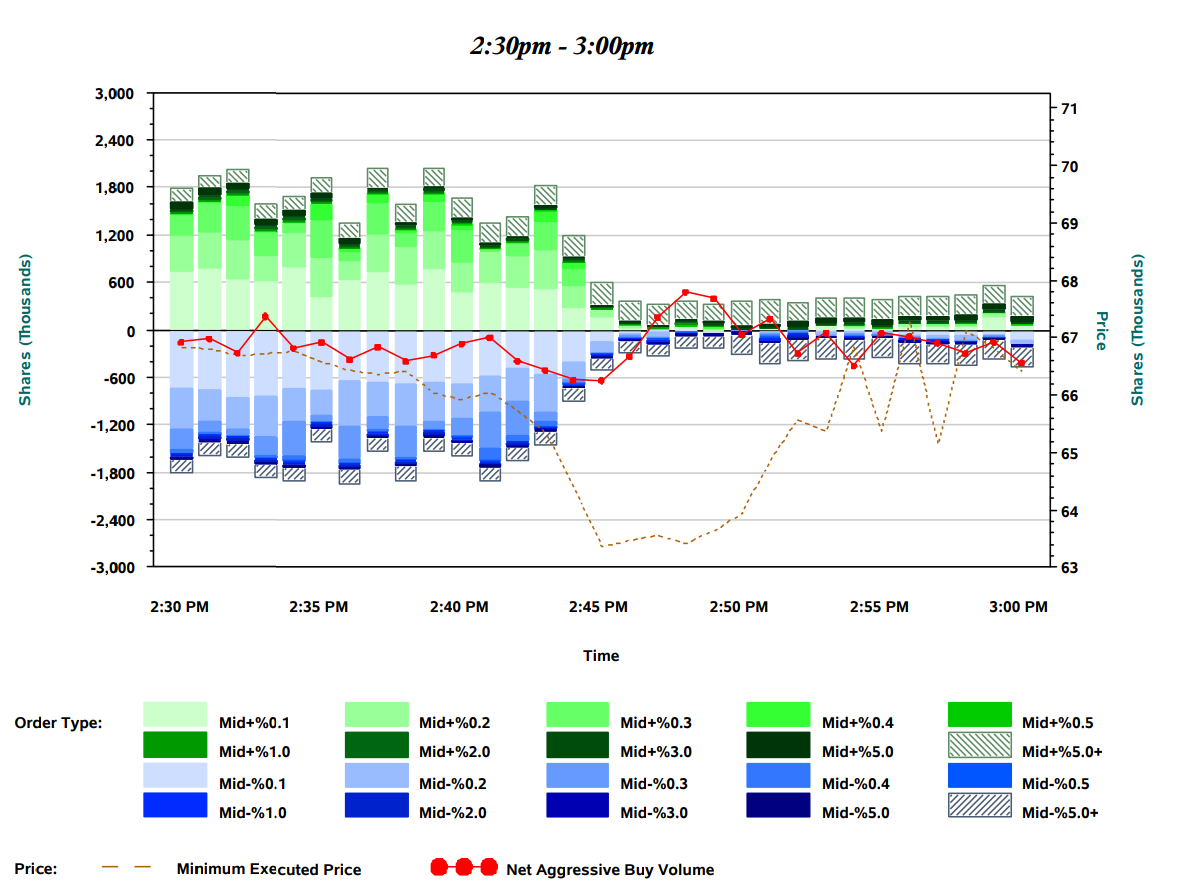
Graphical representation of the liquidity of the Russell 2000 ETF (ticker IWM) during a "flash crash" event. Liquidity that is less than half a percentage point away from the market mid-point is marked green - at approximately 2:45 PM, these orders (mostly provided by market makers) disappeared, and most of the liquidity was at least 5 points away from the market mid-point. % (cross stripe area). This makes immediate transactions more expensive. Image source: Discovery image of the market event on May 6, 2010
Several factors have contributed to the withdrawal of market makers. High levels of volatility make it difficult for market makers to determine a stock's fair value and, therefore, set appropriate buy and sell prices. The presence of "harmful liquidity" made it more risky for market makers to maintain their usual quotes (spreads and sizes), so some market makers stopped quoting.
1) Harmful liquidity
"Toxic Liquidity" refers to order flow that creates adverse options for participants providing liquidity. More simply, those providing liquidity believe they are dealing with those who have information about the true valuation of an asset or the order flow that is about to occur. Participants trade with superior information.
Market makers lose out to these better-informed traders, who try to limit losses by widening the bid-ask spread or reducing the value of the shares they are willing to buy or sell. During a market crash, liquidity becomes detrimental to market makers because their inventory is almost immediately cheaper than the price they paid for it, and a lack of willing buyers means they must sell that inventory at a loss to reduce risk. Typically, they are sold to another market maker. This cycle results in programmed risk or profit and loss limits being triggered and the software (or human monitors) reducing the company’s level of participation in that product or asset class.
3. The impact of bulk derivatives orders on prices
A key trigger for the "flash crash" event was a mutual fund (possibly run by Waddell & Reed) executing an order to sell $4.1 billion worth of E-Mini S&P 500 futures contracts to hedge a stock position. Although the trader entered orders of similar size on other trading days, he typically chose to execute the order within 5 to 6 hours to reduce the price impact.
But on May 6, the fund used a computer algorithm designed to participate in 9% of trading volume without regard to price or time - a very expensive lesson to be very careful about writing algorithms! Launching this algorithm during a high-volume (but low-liquidity) trading session resulted in $1.9 billion of this order being actively executed in just 20 minutes.
Regulators believe the order helped trigger a temporary drop of about 10% in the value of U.S. stock markets, wiping out $1 trillion in value in one day.
Similarly, during the mid-August cryptocurrency crash, liquidation orders (aggressive selling) totaling only $800 million in nominal value caused the cryptocurrency market value to drop by approximately 10%, wiping out $120 billion in value in one day.
4. Cryptocurrency market VS traditional financial market
All of the dynamics explained above may help explain the May 6, 2010 “flash crash” event and the cryptocurrency market crash in mid-August this year. However, there are key differences in the behavior between mature traditional markets and crypto markets during liquidity crises.
The crypto market does not have the following protection mechanisms:
1) Volatility pauses. Traditional financial markets can automatically halt trading when high volatility is detected, halting trading but allowing participants to provide liquidity to the order book.
2) Fusing mechanism. U.S. stock indexes may not trade within price ranges set by 7% and 13% above or below the previous day's closing price until a period of time has passed. If these markets differ by 20% from the previous closing price, trading will be closed for the day.
3) Rules of automated trading systems. On regulated US trading platforms, all execution algorithms must always be overseen by responsible humans. Malicious algorithms can be shut down quickly. Market participants must commit to extensive reliability testing and proper engineering of the algorithm before connecting and sending orders to the trading platform. Precautions may include taking factors such as price, time and total volume into account when executing orders to avoid damaging price effects. Companies that cause market disruption by running poorly designed algorithms now face significant fines from regulators and trading platforms, and in extreme cases the possibility of a trading ban. Lessons learned from the “flash crash” event make it almost unlikely that companies will ever execute large orders in such a disruptive manner again.
The crypto market is fragmented, with liquidity spread across different trading venues . This means that circuit breakers or rules cannot be enforced to regulate automated trading systems. Some flash crashes may occur in only one venue due to external factors (e.g., inability to deposit or withdraw tokens, resulting in insufficient supply or demand side inventory).
Finally, some products, such as perpetual contracts/futures, cannot be delivered or transferred between different trading venues, so over very short periods of time they can diverge infinitely from the spot price. Deviations from fair value can reach 30% in a very short period of time.
Recent examples include YGG and other small-cap tokens (e.g., BLZ), which may have been manipulated by entities that have besieged the spot market and hedged their risks in derivatives.
An important lesson is that lessons from past market disruptions and the presence of regulators have forced traditional market players to take steps to reduce the chances of extreme crashes in the future. Crypto markets have either decided to ignore these lessons, or they have been designed in such a way that volatility mitigation measures cannot be applied (decentralization). This means volatility and associated opportunities will continue to exist.
5. Opportunity
1) Fill liquidation
A significant difference between traditional and crypto markets is the real-time position and liquidation data published by crypto trading platforms.
In regulated markets, it is impossible to know whether a counterparty is opening or closing a position. Real-time position data allows you to see whether a series of recent trades represents a net increase or decrease in market risk. In crypto markets, you can also programmatically identify trading orders that are forced to be closed at a loss.
Why is this important?
When looking at anonymous orders being executed on a trading platform, it is impossible to determine whether a trader has an information advantage. This is why large market making companies are willing to spend a lot of money to understand the origin of orders. Firms may even establish exclusive arrangements to receive orders from unidentified counterparties only through their brokers. In the world of traditional finance, this is known as “payment for order flow” (PFOF), which is why zero-commission trading apps like Robinhood are able to offer discounted or free trades. Market maker firms send client order flow to brokers, rather than receiving revenue from commissions paid by clients. Customers still have to pay transaction fees because market makers will offer investors a higher price to buy the stock and a lower price to sell it. The difference is their income, also known as the spread. Market makers compete with each other, so more liquid instruments will have lower spreads.
In crypto markets, when forced liquidations occur, we can determine that these buy or sell orders were not entered by traders with superior information about the fair value of the market or future order flow. And these orders are typically executed in a price-independent manner to avoid transferring the market risk of the position to the broker or trading platform after the customer's account is depleted. Therefore, it should be profitable to selectively provide liquidity to liquidated traders, so this is a trade for short-term automated traders to compete aggressively for.
For slower investors who only trade manually a few times a year, days when the crypto market suffers a big drop (like BTC/ETH falling over 5-8%) and there are massive liquidations often provide a great buying opportunity, Either capture a few percentage points of mean reversion with relatively low risk, or add to the long-term portfolio at a better average price.
Investors can participate in crypto market crash opportunities in the following ways:
- Buy liquidated collateral at a discount using DeFi on-chain
- Buy Tokens on DEX or CEX for a period of time after a big crash, without any liquidation occurring during this period
- Set orders below the market price and update them daily (e.g. buy Bitcoin at $CurrentPrice * 0.9)
Equity indices are more liquid and efficient and rarely offer the opportunity for such a "crash" - perhaps once or twice per decade, whereas crypto markets offer several opportunities per year.
2) Can low liquidity reduce risk?
Detecting low liquidity early can pay off if you take action to reduce portfolio risk before markets become volatile.
You can check the market depth (order book) of major trading platforms to detect low liquidity. Liquidity will vary based on weekdays or weekends, time of day, and recent volatility, so you need to establish a baseline that you think is reasonable and then determine the threshold at which liquidity is considered "low."
Here is a traditional “price echelon” style order book:

The above is an example of two order books for BTCUSDT futures on Binance. All orders are grouped by price level, summarized in groups of 500 pips on the left and in groups of 50 pips on the right. The second column represents the number of Bitcoins grouped by price level. Buy orders are in blue and sell orders are in red. This is a visual approach, but you can also import data into the API to model averages. Screenshot taken from TradingLite.
If you notice that the "buy" side of the order book typically has much fewer orders for that time period/that week, the market is falling, and there are larger than typical sell orders that keep moving down or close to current market prices, which, combined with other supporting factors, is an early warning of a market collapse.
Another visual way to view this data is to use indicators on a chart:

TradingLite's "Orderbook Suite" code shows cumulative buy orders, cumulative sell orders, the difference between the two, and the ratio.
Detecting low liquidity can be very useful if you want to try to avoid holding cryptocurrencies during the worst days of the year. If you have the skills, we recommend getting API data from major trading platforms and modeling it yourself. Otherwise, the finished tool can provide a snapshot like the one shown above. Investors can try using software and backtesting to automatically liquidate a portion of their cryptocurrency portfolio when low liquidity occurs on days when the market is negative, in the hopes of avoiding much of the drawdown and being able to repurchase the portfolio at a better price .
In short, it’s worth noting that it’s possible to foreshadow a potential market crash (or sharp rise) by paying attention to liquidity levels when:
- Major cryptocurrencies trading at extreme levels over the course of a month or multiple months
- Volume and price movements for the day are above recent averages; and
- There is a significant imbalance between the size of pending orders or the volume of bids and offers (calculating the side of the transaction that pays the cross spread, i.e. the trader who pays the spread bet, e.g. a trade executed at the bid price is calculated as a "sell" ).
At the same time, it is also important to understand the previous context: fundamental news and trader positions . For example, August’s crash began around $29,000 per Bitcoin, following months of hype surrounding news of a cryptocurrency ETF being approved. Delays in the approval process or uncertainty about whether approval will occur can lead to an overreaction to declines by investors who buy at the highest prices of the year and then sell in a panic on dips. To recap, the market peaked in 2021 with the approval of (futures) ETFs.
Cryptocurrency markets are often prone to corrections after market participants are put at a disadvantage due to a slow reaction to good news . Another example is XRP reaching highs after a positive lawsuit outcome and then losing nearly 50% of its value over the next few months. There is a reason why there is a strategy called "Sell the news."
Although taking news and sentiment into account is more difficult to automate, cryptocurrency markets are still very inefficient, so by paying attention to liquidity and market crash dynamics, Passive investors can improve returns or reduce costs by applying a few simple rules.
6. Summary
Market crashes are more likely to occur in illiquid markets and may include the exit of major players (FTX/Alameda), general weakness in the market or economy, or the forcing of leveraged long positions when markets decline following recent good news Sell.
Low liquidity can be quantified by recording and modeling order book data, which is freely available from the crypto trading platform’s API.
Investors can improve returns by adopting some simple trading rules. For example, consider selling or hedging their portfolio if the market looks likely to crash, and employing a strategy that only adds to their portfolio after a significant market decline.
DeFi users have special opportunities to purchase tokens at below market prices during market crashes as on-chain borrowers are forced to liquidate.


