

Click to watch the video: https://www.bilibili.com/video/BV1vC411x7tG/?vd_source=04332ad6ecefd22ffa3d1b9032b40fb3
In today’s video, let’s talk about why Bitcoin has not reached the top yet or some of the simple trading methods we used last year, such as the rsi indicator value. If you buy at a very low position, you will make great profits in the medium and long term, including some The idea of buying and closing and how to judge the next buying point of short-term Bitcoin at its current position
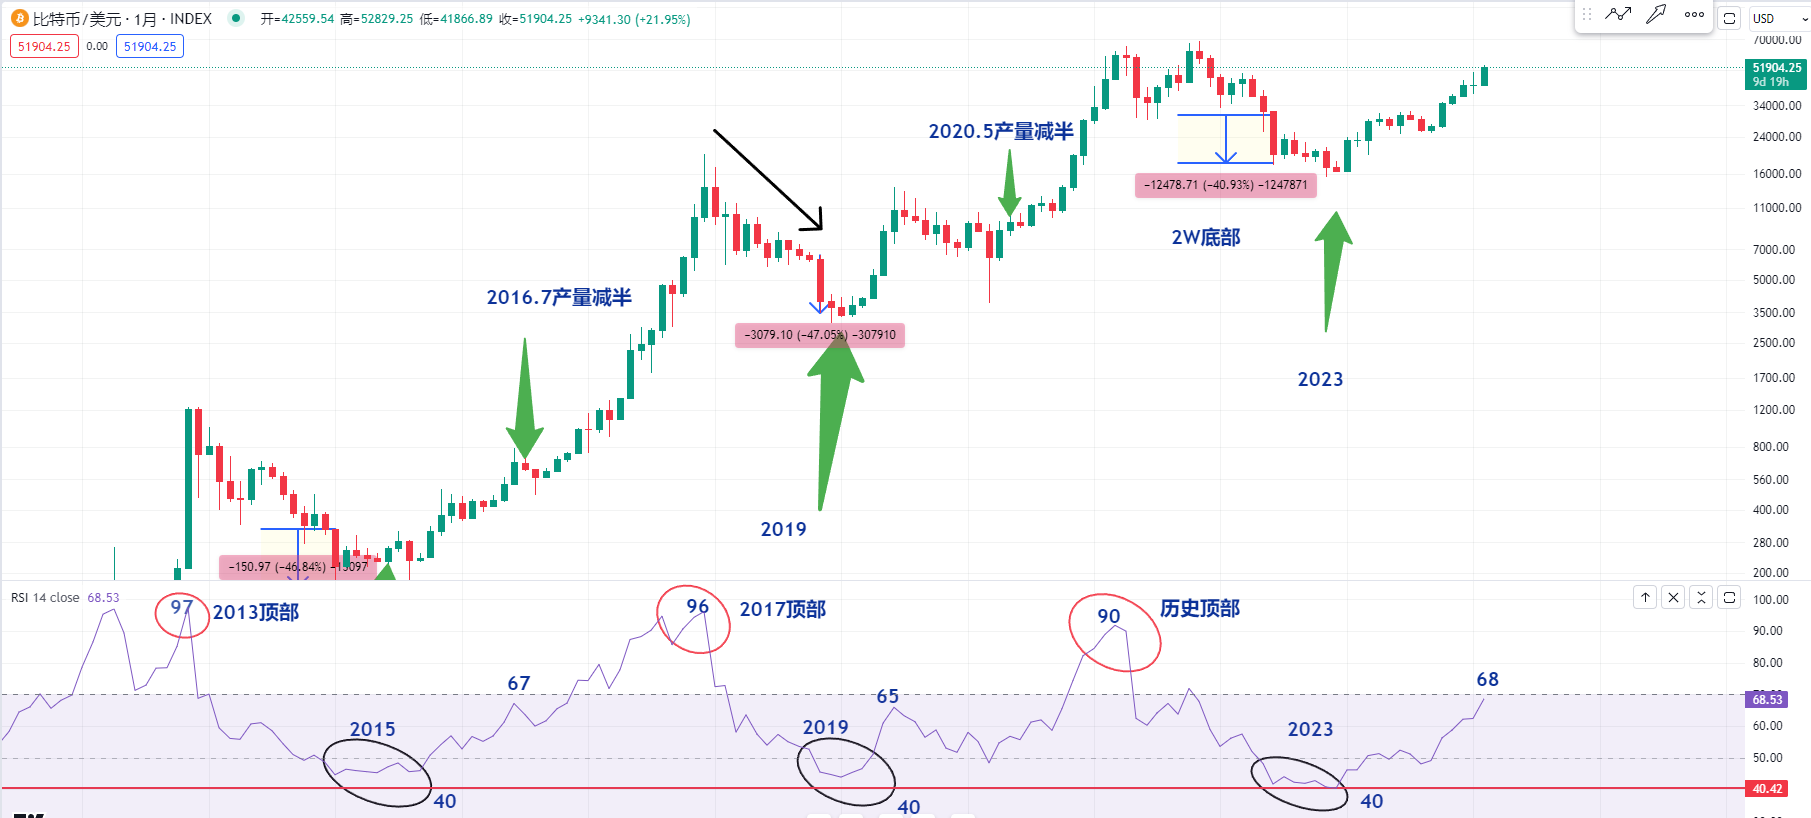
Let's first take a look at the chart of Bitcoin's monthly level. Then for a simple trading method, we will look at the rsi indicator below the monthly level. For example, in 2022, the bottom of 20,000 includes Bitcoin, which then fell to the bottom of 15,000. In fact, the entire interval can be clearly observed except for some forms of K lines.
We can look at the K-line of Bitcoin falling by nearly 40% in a single month, which is also the case with the bottom in 2019 in history. We can look at the position from the high point to the subsequent bottom, which plummeted 47% in one month. This opportunity for a big drop
First of all, I think Bitcoin is the world's top asset. If you don't buy it when others are panicking like this after a big drop, when can you buy it? So when others are greedy, we have to be fearful. When others are fearful, we have to be greedy. It plummeted 40% like this. From 15,000 to 20,000, I started buy the dips, and the lower it fell , the long at the bottom, I also suffered losses. However, in the end, Bitcoin has risen to nearly 52,000 now.
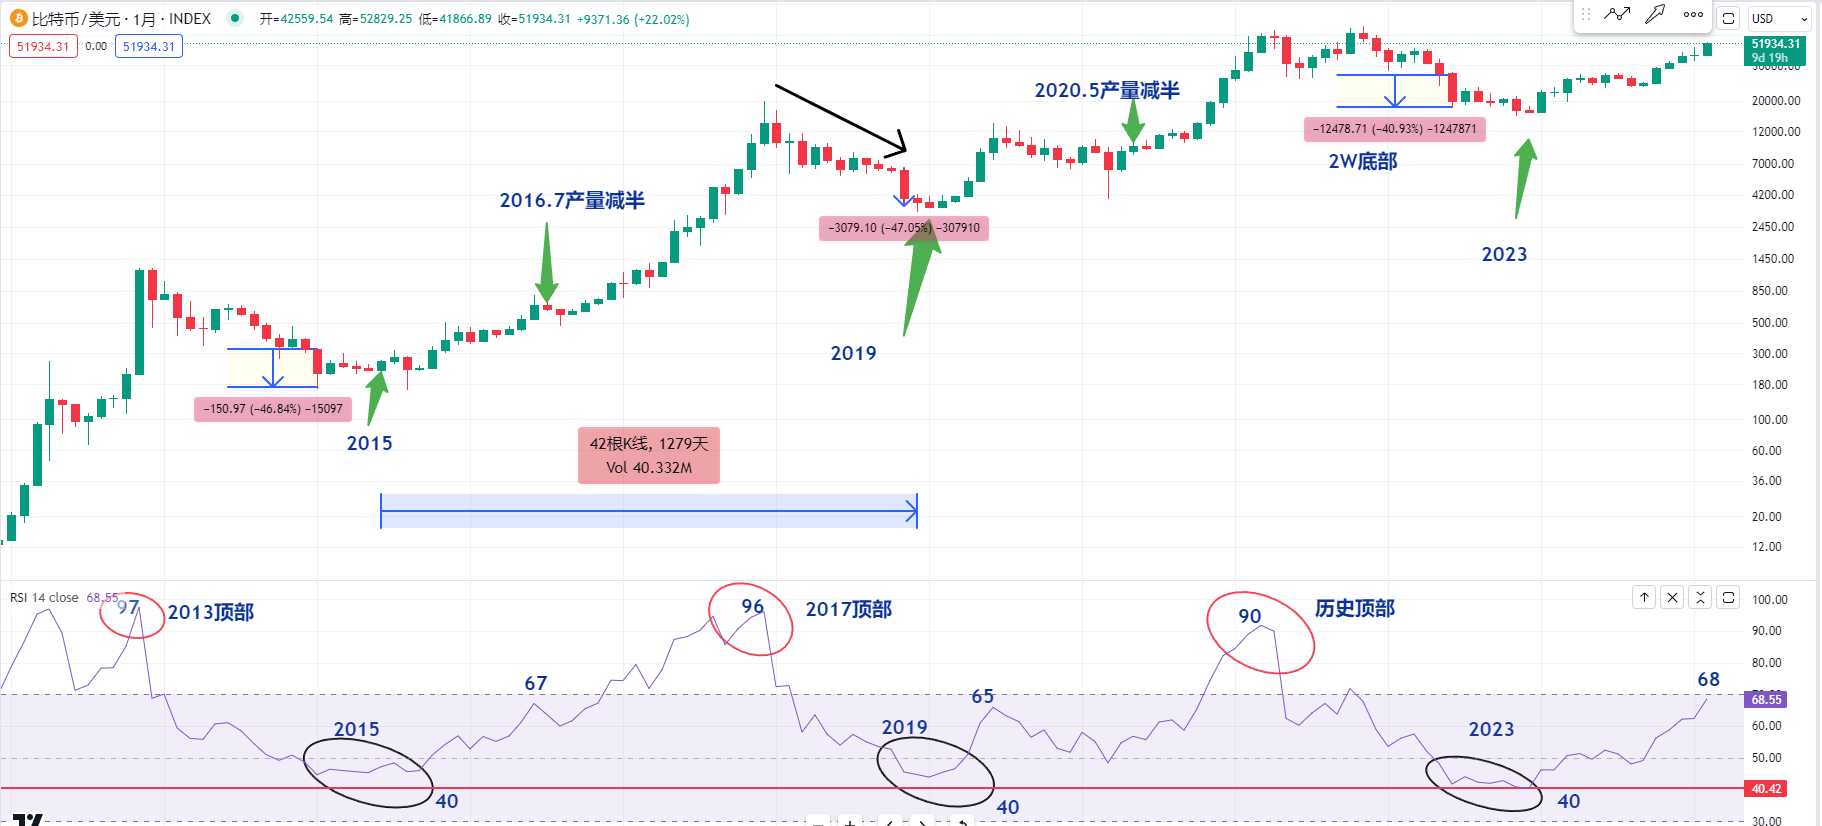
Or we can observe that Bitcoin also reached the bottom position in 2015, but plummeted by more than 40% in a month. Or we can observe the positions of several bottoms in history, which is the value of the rsi indicator below. Based on historical experience at a relatively low position, it is possible that the RSI indicator is close to around 40. It is possible that Bitcoin is a very important bottom.
Because we can observe that at the bottom of 2015, the RSI indicator was around 45, or later we saw Bitcoin enter a bull market and then reach the bottom in 2019, which was also the bottom in 2019 after about four years. The RSI indicator has reached around 40 again, which may be a very important bottom.
Then we observe that Bitcoin rose from the bull market in 2019. It also took about 4 years and the rsi indicator reached a very low position again. At the monthly level, its rsi indicator value is close to 40.
We can observe that I actually missed the bottom when I buy the dips at this position because I did not expect that there would be a black swan event. The rsi indicator was close to 40, so a position like this is still a very important bottom.
Now let’s look at Bitcoin after more than a year of rising or the spatial increase exceeding 200%. We can look at the historical top. In fact, this rsi indicator is far from the top of this position in history. The rsi indicator position is around 90. Then I think the current distance is still very far.
Or we can look at the top of Bitcoin in 2017, including the top two positions before 2017. Its rsi indicator value is above 90. So I think the current rsi indicator has not reached the top at all, and there will definitely be some later. There is more space, but the current rsi indicator at this position we can observe is that its value is around 68.
Or the time for Bitcoin production to be halved is around April 18 and there are less than 60 days left. But if we look at the historical monthly line of this rsi indicator, there may be a value of 70 before the production is halved, which we also need to pay attention to. one point
Because we can take a look at the big bull market of Bitcoin from 2019 to 2021. We can observe that the production halving time is around May 2020, which is in this range. Then we can observe the performance of Bitcoin before the production is halved. This wave of rise may be the entire consolidation range that follows.
It can be observed that the monthly line of the rsi indicator below is also close to 70, which is around the high point of 65. Before the output was halved, the rsi did not reach such a high value again. It is possible that after the output is halved, The subsequent rise is only possible if the rsi indicator breaks through 70 or 80 and comes to around 90 or does not reach 90 in the future. We will then see whether we should close the position.
Or we can observe the bull market of Bitcoin from 2015 to 2017. The approximate time when the output was halved was July 2016. Then we can observe the rise before the output was halved. The same is true. The rsi indicator below has arrived approximately. The area around 67 may also be a relatively overbought range, or we need to pay attention to whether there will be a similar one-to-two-month decline before and after the production is halved.
Therefore, the midline level is currently at this position. We try to observe first because according to historical experience, it is possible that after the output is halved and the increase from 2016 to 2017, the rsi indicator will cross 70 or even reach 80 or 90.
The same is true in 2021. After the output is halved, it is possible that the rsi indicator will touch 80 and 90 on the monthly line. Now we can observe that there has been no major retracement of the rise for more than a year. For the current situation I feel that the RSI indicator is on the high side at the midline level, so we try to observe whether Bitcoin will fall in the short term. How do we judge the buying point of a fall?
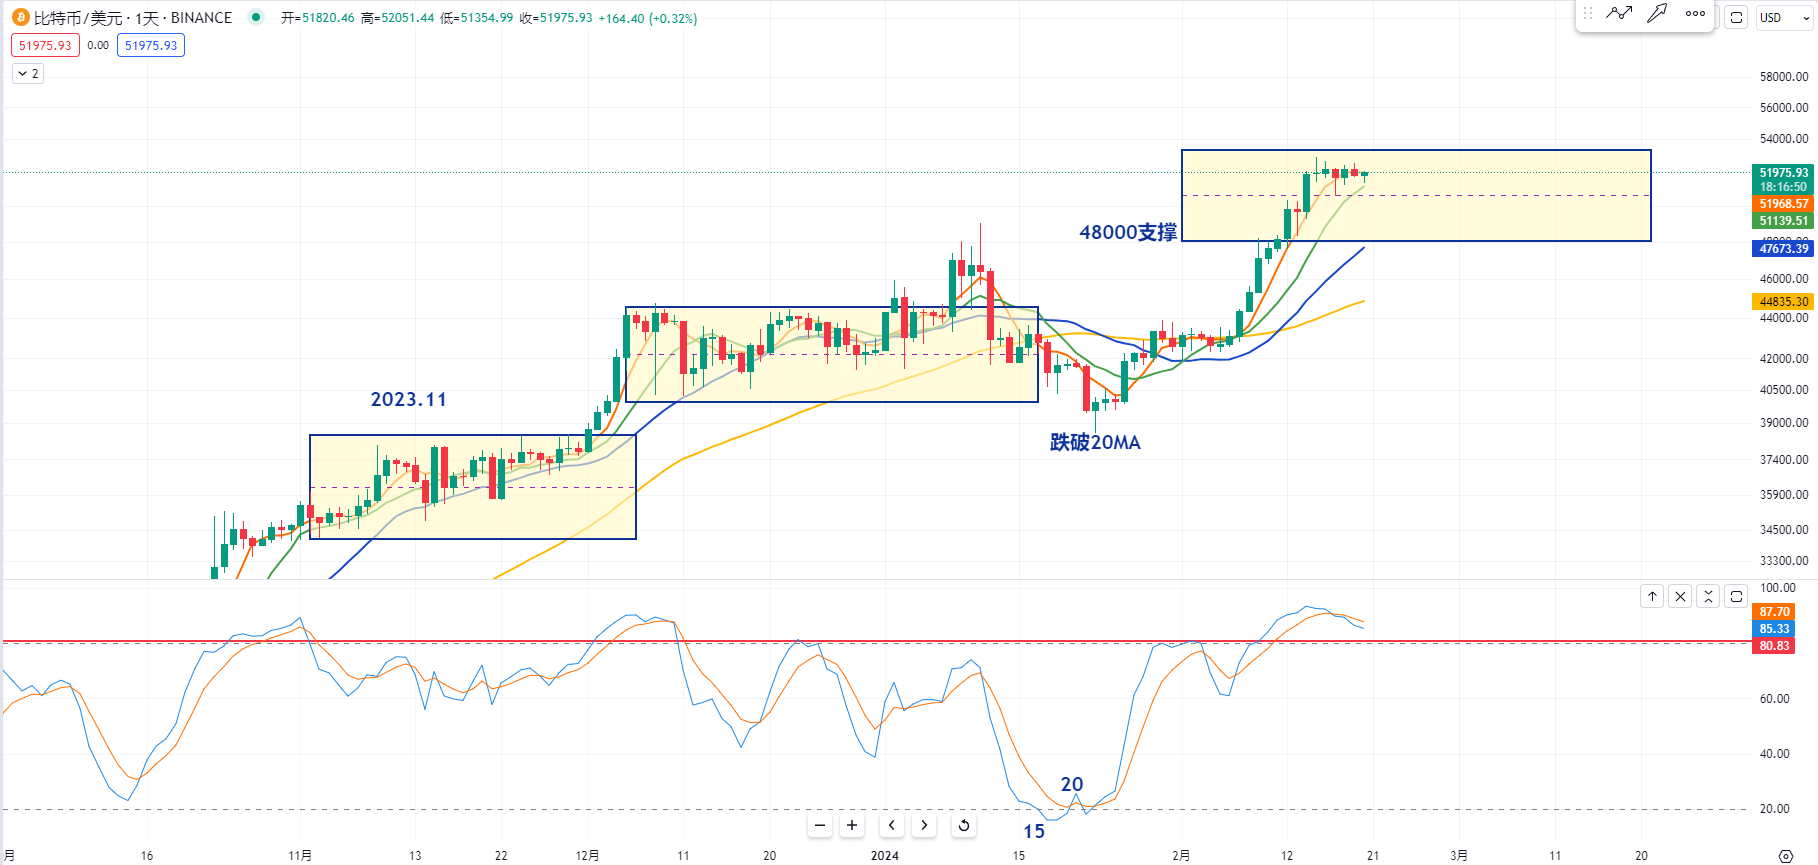
So let's take a look at the daily chart of Bitcoin. In the short term, it has fallen below the 5-day moving average. However, if we look at the green 10-day moving average in the short term, it may have support, but I think this moving average may not be very important. It may not necessarily fall at this position in the short term, it may still consolidate at this position.
But I think a very important moving average is this blue 20-day moving average, which is also the lifeline of our retail investors. Or let’s observe it in the next step. If a box is organized at this position, a support below the range is around 48,000. So how do we judge the next buying point?
We can observe the previous history. If Bitcoin does not fall below the 20MA in the range of November 2023, we try to observe whether the kd indicator will fall below 80. If it falls below 80, then there may be If there is a midline consolidation, let’s observe that this position cannot fall below 20MA.
Then it is possible that as long as the KD is at the death cross position and it does not return to below 50, it is possible. Just like this position, as long as it falls to around 20MA, it will also rise. So at this current position, we first look at consolidation or the next price. Will you test this 20MA?
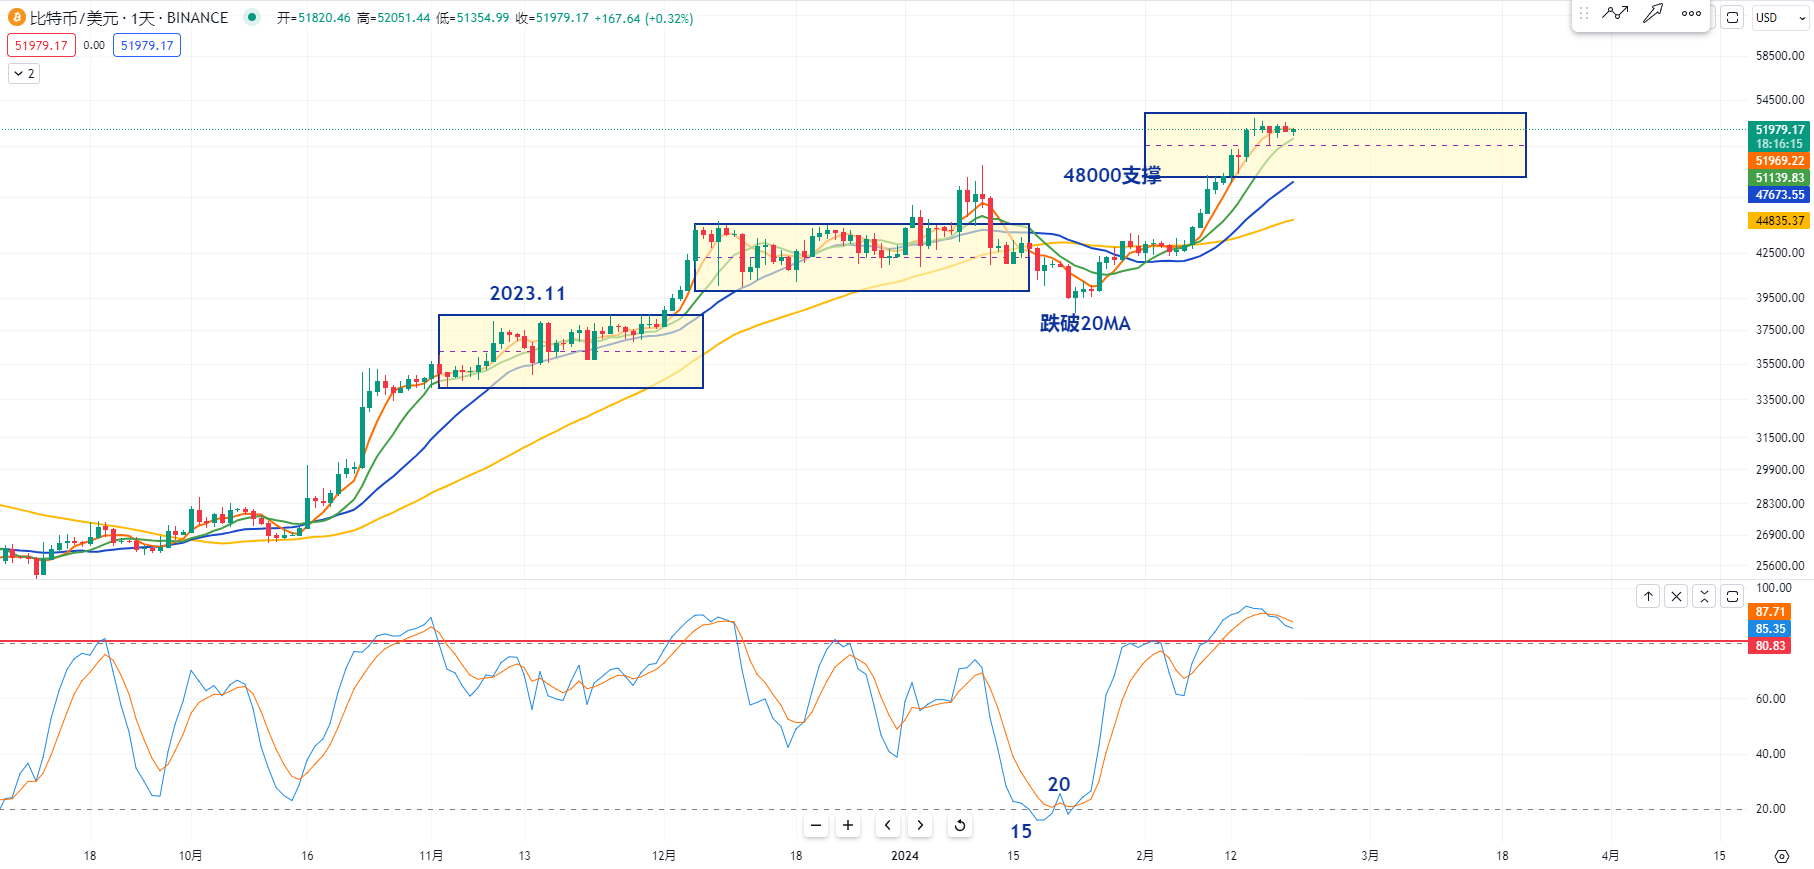
Then there is another trend that we can observe if it consolidates at its current position. If it falls below the 20MA, the lifeline of our retail investors, in the next step, it will be like the last time it fell below the blue 20MA here.
Let’s try our best to observe this kd indicator. If it comes to around 20, it may be the buying point of the midline. Then we can first observe whether it will consolidate at this position and then test the 20MA. It may also be one of our midline. buy some
More strategies can be added to the real offer
The K-line is king and the trend is king. I am Master Chen. I have been focusing on BTC and ETH spot contracts for many years. There is no 100% method, only 100% following the trend. Macro analysis articles and technical reviews are updated on the entire network every day. Analyze videos.

Warm reminder: This article only has the official column account (pictured above) written by Master Chen. Other advertisements at the end of the article and in the comment area have nothing to do with the author himself! ! Please be careful to distinguish between true and false, thank you for reading.


