

The recent rise in Ripple price has sparked great interest from investors. Nonetheless, current technical indicators indicate an unsustainable rise and market analysts are predicting a potential reversal.
A closer look at the numbers suggests that a price decline may be imminent, which could upset the recent price equilibrium phase.
Ripple trading volume decreases
From February 10 to March 6, Ripple’s (XRP) daily trading volume more than quadrupled . Despite this impressive growth in trading activity, there has been a notable downward trend recently. Trading volume declined for four days in a row, peaking at $1.5 billion on March 10, the lowest volume since February 27.
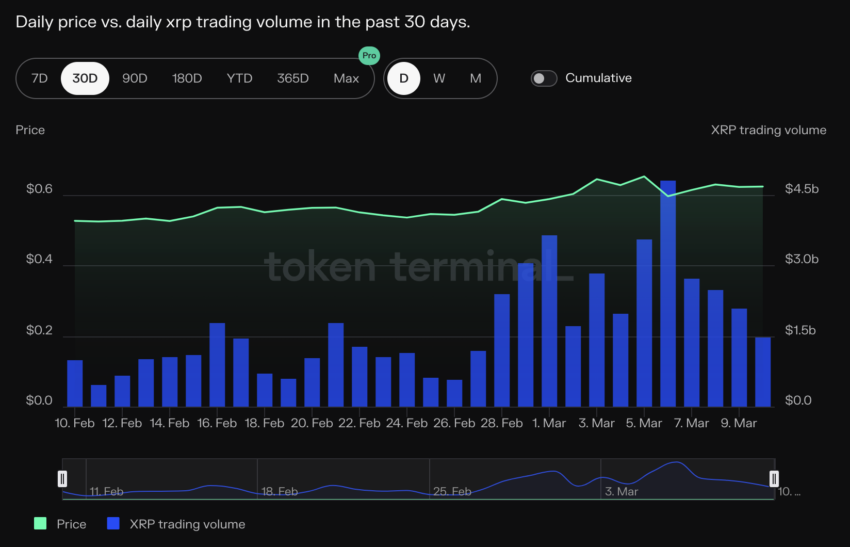
These trading volume patterns are indicative of market movements, especially when considering the relationship between trading volume and XRP price movements over the past month. During this period , the price of XRP rose from $0.52 to $0.59 as trading volume surged.
XRP MVRV Increase
XRP's MVRV 7D indicator, which rose more than 9% on March 3, was volatile. It fell to 1% on March 8, but then rose to over 6% on March 11. Initially, a high MVRV meant that traders saw notable profits, which could potentially lead to selling to take profits. A drop to 1% means that the market value of XRP has fallen or that low-price trading has occurred.
The 7-day market-to-realized value (MVRV) ratio is a metric used to measure the average profit or loss of an asset traded over a 7-day period. If MVRV is above 0%, it means that holders who traded last week made a profit on average, while if it is below 0%, it means they made a loss.
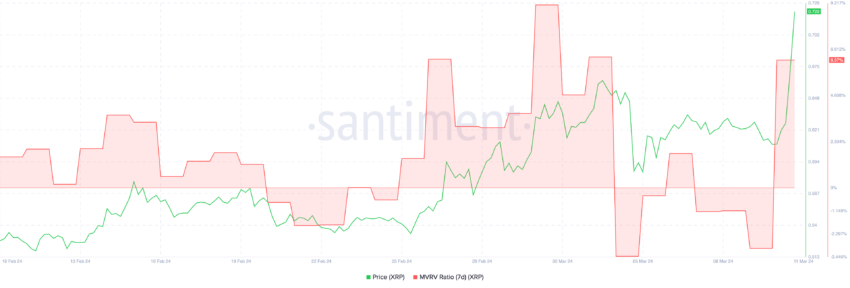
The recent recovery above 6% follows a strong rebound in prices. A sudden rise in MVRV within such a slow time frame can be a red flag as investors may begin to liquidate profits, causing selling pressure.
RSI rises recently
RSI rose significantly from 35 to 61 in just a few hours. RSI 35 is close to oversold territory, indicating that the price is either undervalued or selling pressure is almost exhausted. This can be seen as an opportunity for traders to buy at a lower price, thus anticipating a possible price reversal or bounce.
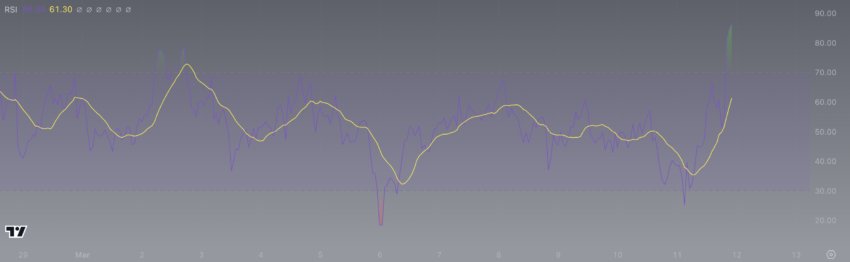
The Relative Strength Index (RSI) is a momentum indicator used in technical analysis to measure the magnitude of recent price changes to assess whether an asset is overbought or oversold. Typically, an RSI above 70 indicates an asset may be overbought, while an RSI below 30 indicates it may be oversold. RSI moves between 0 and 100 and provides a signal of the internal strength of an asset.
The sharp rise to 61 signals strong buying momentum and a break from oversold conditions. These sharp increases can often be bullish and lead to further price increases if the trend continues. However, if RSI continues to rise rapidly and exceeds 70, it may mean that the asset is overbought. This can lead to a subsequent decline as traders start selling their positions to realize profits .
XRP Price Prediction: Trend Alone May Not Be Enough
If you look at the chart, you can see that the exponential moving average (EMA) is bullish and the short-term moving average is above the long-term moving average. This configuration often indicates an upward trend, and price above the EMA strengthens this upward signal. The steeper the slope of the EMA line, the stronger the trend.
However, indicators such as MVRV and RSI may prevent the upward trend from continuing.
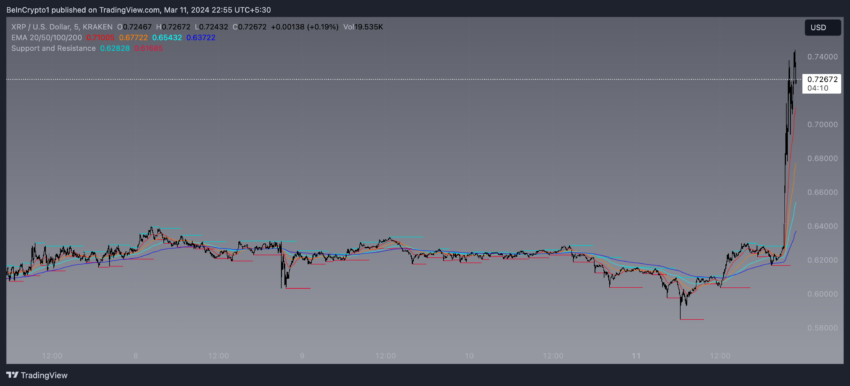
Support and resistance levels are also highlighted. Support at $0.62 represents a price level where the asset has seen significant buying in the past. The resistance level of $0.72 represents a price point where selling pressure was previously strong enough to prevent the price from rising.
If the XRP price stays above the resistance-to-support price range, the upward trend may continue. However, if the price falls below this level, it could mean that the breakout is not sustained, and the price may fall again to test the lower support levels of $0.62, $0.60 or $0.58.
Trusted
The above article is a BeInCrypto article written in English translated into Korean using AI.
The information contained on the BeInCrypto website is published in good faith and for informational purposes only. Users are solely responsible for any consequences arising from their use of information on the website.


