Click to watch the video: https://www.bilibili.com/video/BV12H4y1H7tT/?vd_source=04332ad6ecefd22ffa3d1b9032b40fb3
So today in the video we are going to talk about how the long-term long-term profit closing plan for buying at the bottom of 15,000 or 25,000 may need to be modified, because there was a plan before, and the top of Bitcoin may be at the end of 2024.
Including wait, let’s observe that the monthly MACD is already 7 bars. In history, I have never seen Bitcoin’s K-line rising for 7 consecutive months, including friends who hold long-term long orders in Dogecoin. When can a position be closed?

Let’s first take a look at the weekly level of Bitcoin. As long as Bitcoin breaks through the all-time high in history, we have to consider how long it may continue to rise. Because I have just said that the macd in the monthly level is already There have been 7 consecutive bars, including a K-line that has never seen a continuous rise of 7 months in the history of Bitcoin.
Of course, the current environment is different, whether it’s ETFs, the upcoming Bitcoin halving, or the Federal Reserve’s interest rate cuts, but I believe that as long as it’s in the trading market, it’s impossible to keep rising and it will reach the top one day, so let’s take a look. Bitcoin’s Historical Bull Run
We can look at the rise of Bitcoin in 2019 or the position it reached in November 2020. At that time, Bitcoin broke through a new all-time high. Then from the position of this breakthrough, we can calculate that it rose to a high of 69,000 in 2020. At this point in 2021, Bitcoin broke through a new all-time high, and then continued to rise for 329 days. Of course, the process in the middle was not smooth sailing, and there was a sharp retracement.

Or let’s take a look at Bitcoin’s bull market in 2015. The bottom rose around March 2017. At that time, this position broke through the all-time high, and there was also a big drop in the middle. This position fell by nearly 35%.
Then we can calculate that it broke through the all-time high from this high point, and Bitcoin rose to the top in 2017. The rising time of this position is 280 days. Of course, its subsequent rise will also have some midline retracements in the middle.
So we passed the Bitcoin weekly level chart. Or I have considered before that another Bitcoin top may be in December 2024. Then we can observe that Bitcoin broke through the all-time high of 69,000 this time.
If according to the historical high of the bull market from 2015 to 2017, if it rises for another 280 days, we can observe the time of this position in December 2024, because I have also said in the previous video that Bitcoin generally rises in the bull market. cycle
In particular, the top time often occurs in November or December. For example, we can look at the top of 69000 in November 2021 or the top of this position in 2017, which also occurred in December.

So let’s take a look at the macd indicator of Bitcoin at the monthly level. This time, Bitcoin has been rising sharply for 7 consecutive months at the monthly level. Some time ago, I also mentioned the macd bar below in the video. You may need to be careful if there are around 7 strands.
Or if macd dropped 6 to 7 bars before, it is possible that this position is the bottom of Bitcoin, including the bottom in 2019. If macd dropped 7 bars in a row, then this will be the bottom of Bitcoin in 2019.
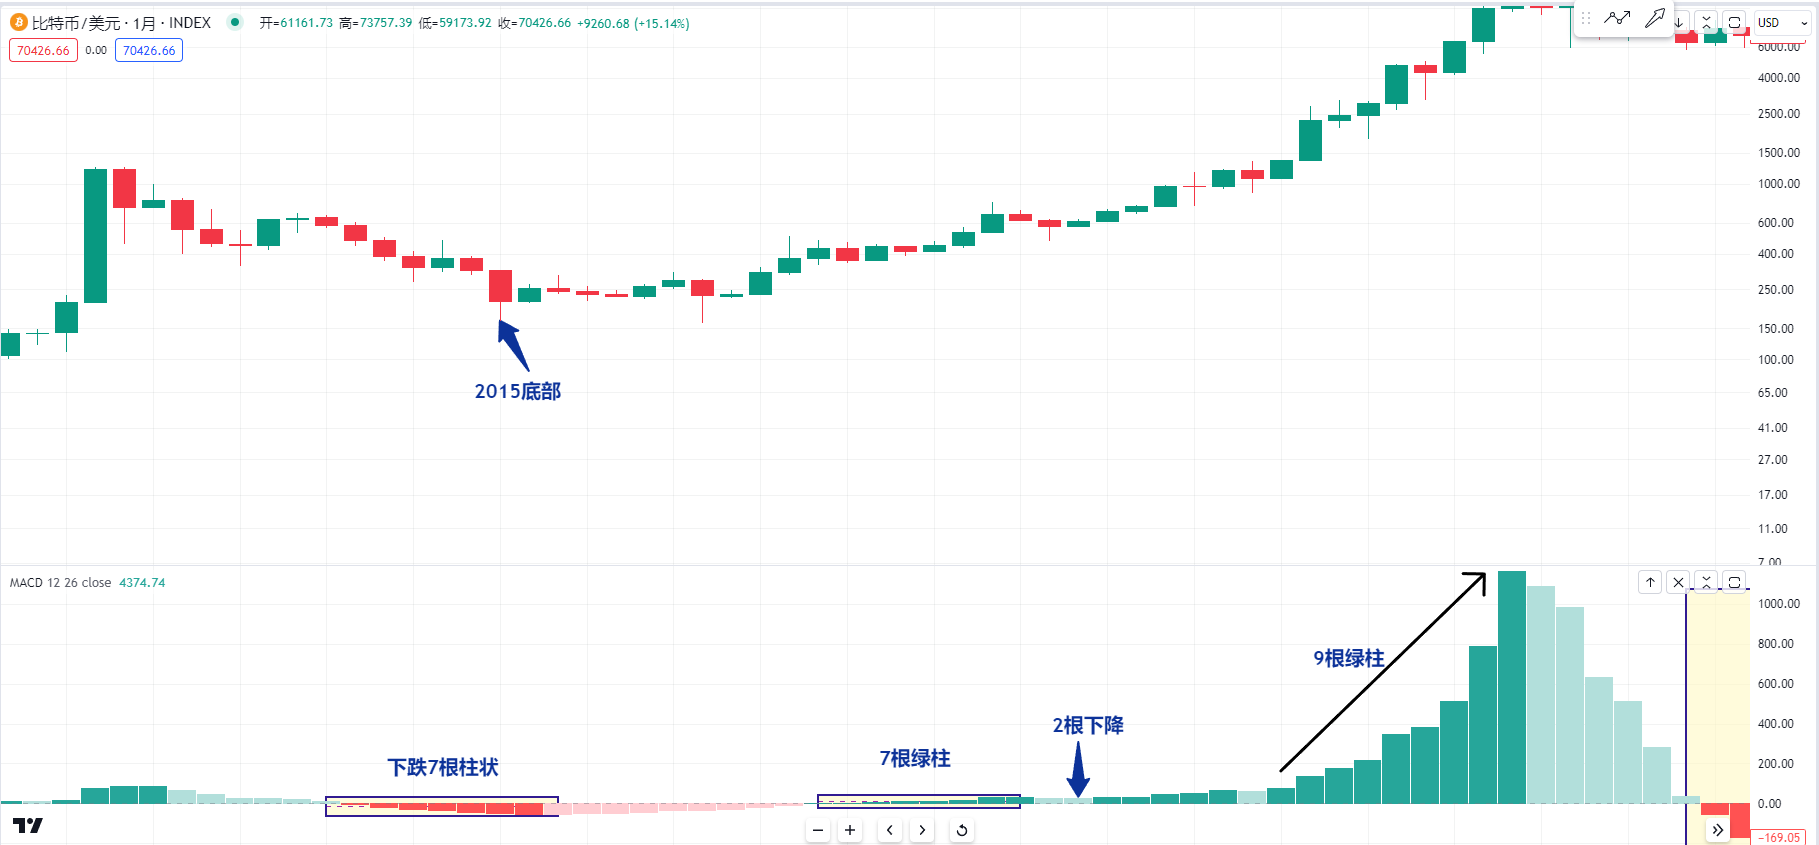
Or we can look at the bottom of 2015. The macd dropped 7 bars in a row. Then this is the bottom of 2015. Then we can refer to the bull market of Bitcoin in 2015 and count the times when the macd bars in 2015 were generally 6 to 7 bars. You should pay attention to whether there will be two pillars falling like this.
Or after the next 5 to 6 bars appear, there will be a drop of 1 bar. Then we can count again. Later, when Bitcoin rose to the top, there were 9 green bars in a row. This may be the top of Bitcoin.
So we can look at the current macd column of Bitcoin, including the K-line above. I also said that in history, we have never seen a monthly line rising for 7 consecutive months. We need to observe whether Bitcoin will be around before and after the output is halved. There will be two months of consolidation or a relatively large retracement.
We need to think about whether the K-line that started to rise in June and continues to rise until December will continue to rise for another 6 months at this current position. Is it possible that it will be around 100,000 to 150,000 US dollars? Or I will plan it in December this year. Should I close all long-term long positions?
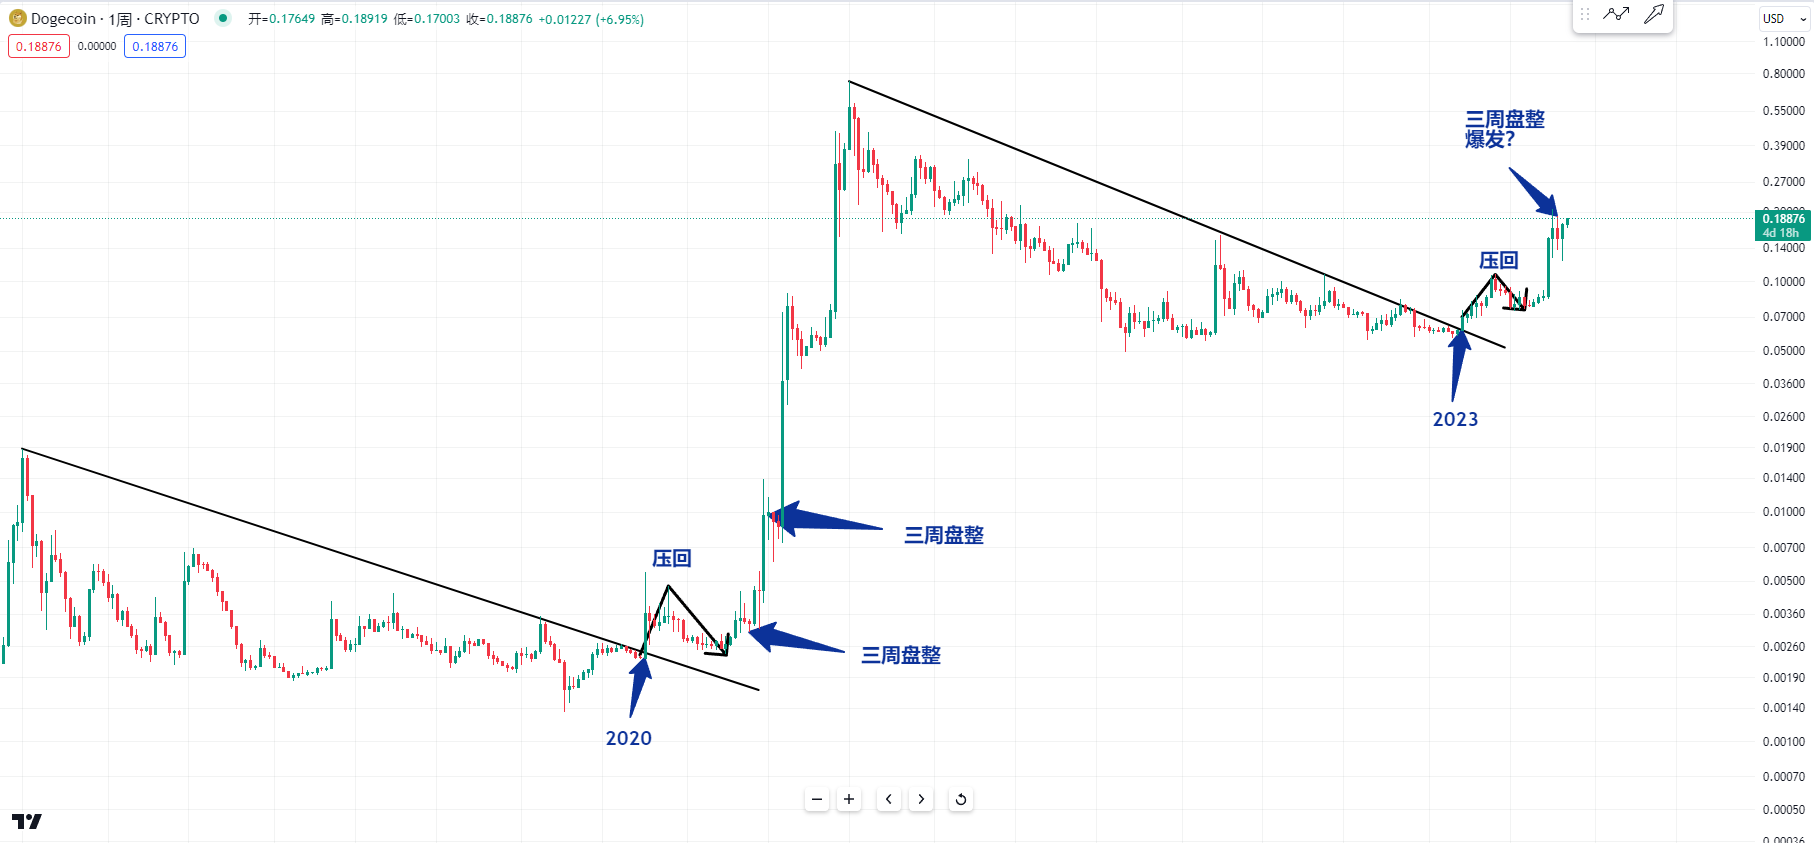
Then let’s take a look at the weekly level of Dogecoin. After the trend breakthrough at this position in 2023, Dogecoin pressed back at this position. It is the same as this position in 2020. After the two-year trend breakthrough, it also has a After the retracement, is it possible that it will break through 0.2 in the short term?
I personally think it is possible, because we can observe the rise here in 2020. The general structure of Dogecoin consolidation is about three weeks, and it starts to rise after three weeks of consolidation. There is a low point, and then it starts to explode.
So is it possible that the current three-bar consolidation at this position will occur in the next week or two? In addition, we also have to pay attention to the fact that Bitcoin cannot have a sharp retracement. Is it possible that Dogecoin will not be as good as before in the short term? There will be a big explosion at this location in 2020
If Bitcoin will reach a higher high at the end of this year, then we will have to observe whether Dogecoin may peak in the first half of 2025, or if Dogecoin has a price of about $1, then hold long orders. My friends are about to consider closing their positions.
The K-line is king and the trend is king. I am Master Chen. I have been focusing on BTC and ETH spot contracts for many years. There is no 100% method, only 100% following the trend. Macro analysis articles and technical reviews are updated on the entire network every day. Analyze videos.

Warm reminder: This article only has the official column account (pictured above) written by Master Chen. Other advertisements at the end of the article and in the comment area have nothing to do with the author himself! ! Please be careful to distinguish between true and false, thank you for reading.