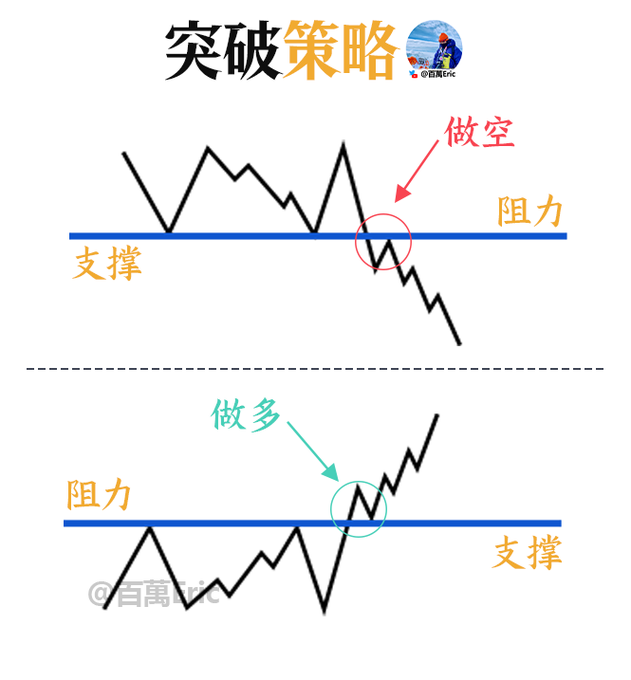
Buy on a breakout and long; short on a break below and rebound.
If the price breaks below the support level, those who were trapped in long positions will try to get out and run, and this level will henceforth become a resistance level.
Once the resistance is broken, those who miss the pump before finally can't resist and buy in with real money, turning it into support.
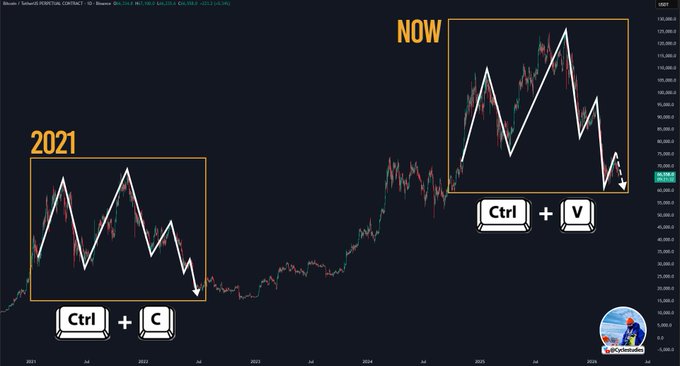
The market is not completely random; it is "drawn" with real money by everyone who has "made money, lost money, been trapped, and suffered losses."