

This article is machine translated
Show original
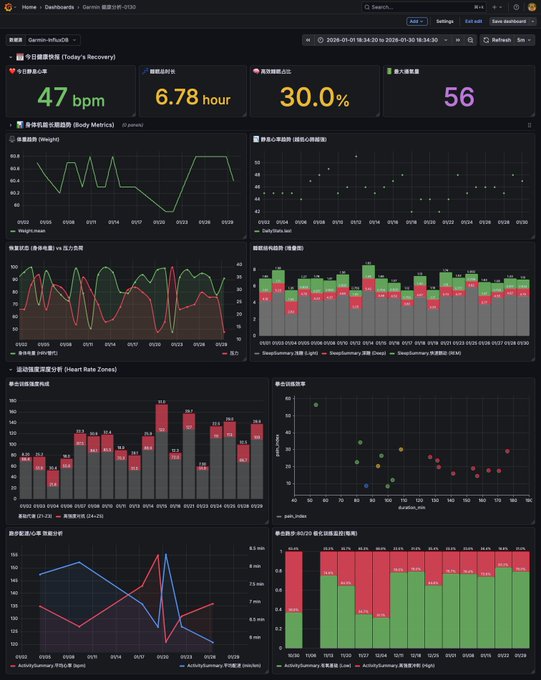
The Garmin smartwatch's visualization was too crude, so I did it myself. I used Python to scrape the data, stored it in InfluxDB, and then used Grafana for visualization.
Data monitoring priorities:
1️⃣ Sleep & Recovery (First Priority): Without quality rest, all training is depleting your body.
2️⃣ Explosiveness (Zone 5): Monitor data from when you're giving it your all, pushing your cardiovascular system to its limits.
3️⃣ Strength & Endurance: Based on the 80/20 rule, ensure 80% of your training time is in Zone 2 to increase mitochondrial growth.
I'll start data-driven monitoring in 2025. At age 31, my VO2 Max is 56, and my resting heart rate is 43-50. The purpose of monitoring the data is to gain a more accurate understanding of my body. At the same time, paying attention to how my body feels is crucial; if I feel tired, I'll stop.
Holy crap, that's athlete level, awesome! 👍
It would be amazing if we could eavesdrop on their conversation! Is it possible for us to do that?
From Twitter
Disclaimer: The content above is only the author's opinion which does not represent any position of Followin, and is not intended as, and shall not be understood or construed as, investment advice from Followin.
Like
Add to Favorites
Comments
Share
Relevant content


