
本文为机器翻译
展示原文
分析底部可能形成的位置
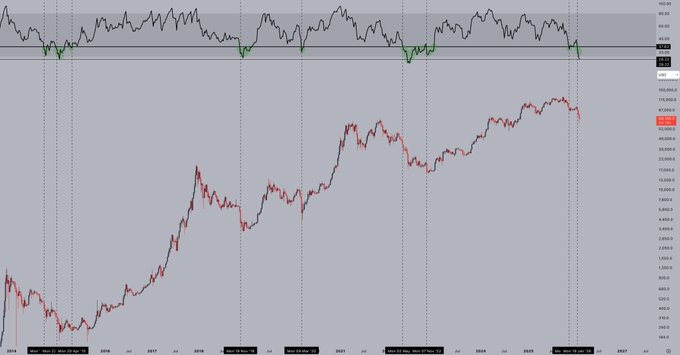
“加密货币的每一个周期底部都出现在这个水平以下,但价格在底部形成之前可能会跌得更低。”
过去一周的数据证实了这一点,$BTC 大幅下跌。目前的低点较 RSI 首次跌破 37 时下跌了 30%。
以下是自 2014 年以来的数据:
自RSI首次跌破37以来的回撤幅度:
最大值≈55%
最小值≈17%
当前约31%
一个关键观察结果是:接下来的每一个底部都比第一次 RSI 37 交叉点低得更少。
底部形成前的时间:
最大值≈200天
最小值 = 0d
当前 84d
由此得出的结论:
根据相对强弱指数(RSI),目前的回撤幅度在合理范围内,但仍有进一步下跌的可能。如果从RSI 37点下跌55%,BTC将跌至4万美元左右——尽管之前的低点幅度较小,因此50%的跌幅属于极端情况。
低于 40% 将与前两个底部 43.2% 和 41.4% 一致——这将使底部接近 52000 美元。
从时间上看,即使再次出现 200 天的峰值,也意味着 6 月份触底,远早于 4 年周期预测的 10 月份触底。
因此,基于以上分析,如果价格在夏季之前在 52000 美元左右形成底部,那就说得通了。
仅凭这一点还不能下结论,但该地区的房价走势相当集中,至少值得我密切关注 5 万美元出头的价位。

Jelle
@CryptoJelleNL
02-02
$BTC is back below the weekly RSI level 37.
Every cycle bottom in crypto has occurred below this level; but price can go a lot deeper before that bottom forms.
Data since 2014:
Drawdown from the first time RSI crossing 37:
Max ≈55%
Min ≈17%
Current ≈14%.
Time before bottom
顺便一提,这和斐波那契数列的.618也吻合👀
Jelle
@CryptoJelleNL
Historically, every major $BTC bear market bottomed below the 0.618 Fib retracement from the prior cycle high.
The first bear went much deeper, 64% below the fib, but every cycle since, bottoms have gotten progressively shallower past 0.618 - to the point that the last bear
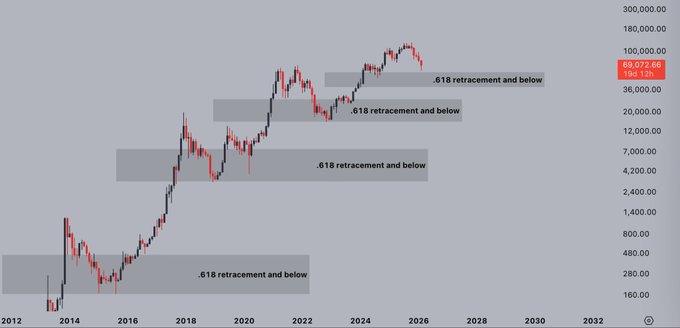
周线RSI 37是一个可靠的走势指标。回撤幅度才是令人担忧的部分。
来自推特
免责声明:以上内容仅为作者观点,不代表Followin的任何立场,不构成与Followin相关的任何投资建议。
喜欢
收藏
评论
分享