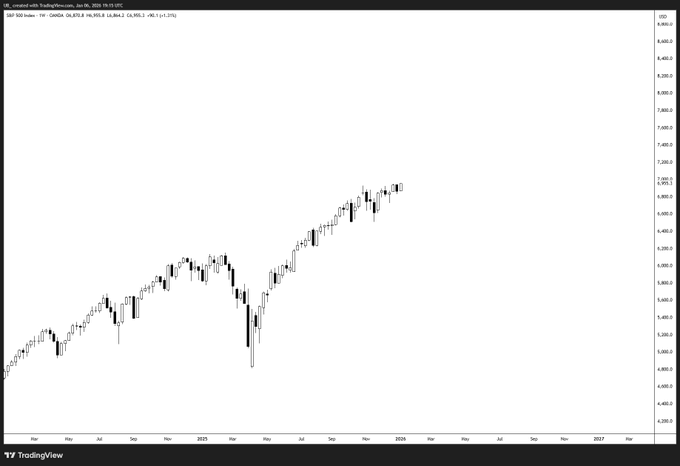
新歷史高點 ✅ 當出現一根小幅下跌的周線蠟燭圖時,市場對頂部的預期將會再次上升。 就像鐘錶一樣精準。
本文為機器翻譯
展示原文

UB
@CryptoUB
12-17
It's crazy how many calls for a top there's been over the last year on a chart that looks like this.
There was literally one big multi week pullback late March to early April. After that, the market rallied 40%.
The largest pullback in over 200 days was 6%...
來自推特
免責聲明:以上內容僅為作者觀點,不代表Followin的任何立場,不構成與Followin相關的任何投資建議。
喜歡
收藏
評論
分享