

本文為機器翻譯
展示原文
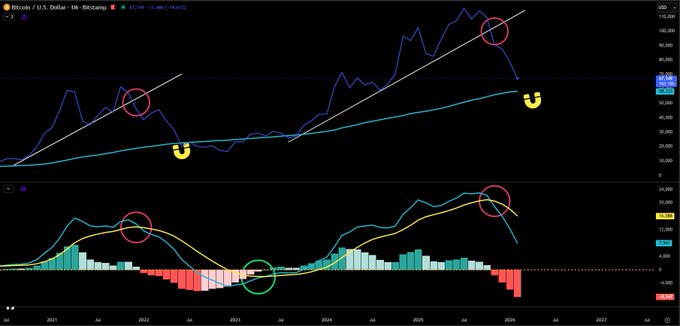
幾個月前發佈了這張比特幣月線MACD圖表。
預測到了看跌背離✅
預測到了看跌交叉✅
預測到了週期頂部✅
價格為6.7萬美元。
自2014年以來,每一次主要的熊市都是從月線MACD上的這個信號開始的。
每一次都是如此。
圖表已經說明了一切。我也已經說明了一切。
下一個目標:測試5.8萬美元的藍線。🎯

Jesse Olson
@JesseOlson
11-22
This simple monthly #Bitcoin MACD bearish crossover doesn't care about predictions by talking heads, whales buying, on-chain data, or influencer bros buying the dip all the way down.
This free lagging indicator would outperform most "experts/analysts."
Expect bounces, but buy x.com/JesseOlson/sta…
11月15日
Jesse Olson
@JesseOlson
11-16
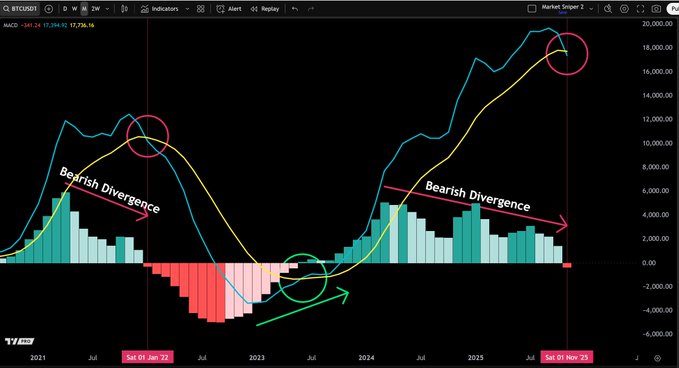
This simple #Bitcoin MACD monthly bearish crossover plan was laid out 1.5 years ago.
✅Arrow showing divergence
✅Red circle showing bearish crossover x.com/JesseOlson/sta…
計劃於2024年4月實施。
Jesse Olson
@JesseOlson
04-02
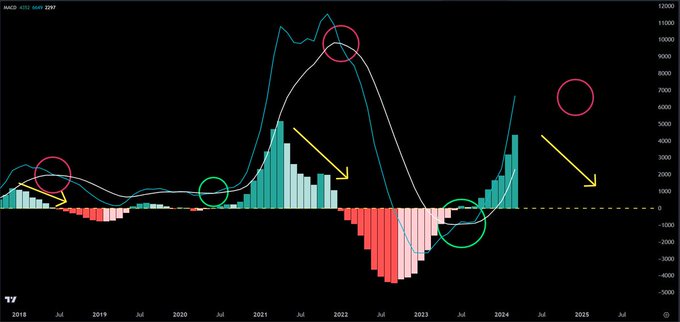
The monthly #Bitcoin MACD chart doesn't have any signs of a reversal yet but eventually it will.
(Monthly MACD is quite lagging so isn't our top indicator to watch) x.com/JesseOlson/sta…
Cryptonews在BTC還在11萬美元左右時就引用了這個觀點👇
cryptonews.com/news/bitcoin-dr...…
來自推特
免責聲明:以上內容僅為作者觀點,不代表Followin的任何立場,不構成與Followin相關的任何投資建議。
喜歡
收藏
評論
分享


