Author: Nancy Lubale, CoinTelegraph; Translated by: Tao Zhu, Jinse Finance
Traders continued to push Ethereum prices towards $4,000 on May 27, with the Altcoin up 3.5% on the day.
Data from Cointelegraph Markets Pro and TradingView show that Ethereum has performed strongly, rising 27% from a low of $3,048 on May 20 and reaching a 10-week high of $3,964 on May 27.
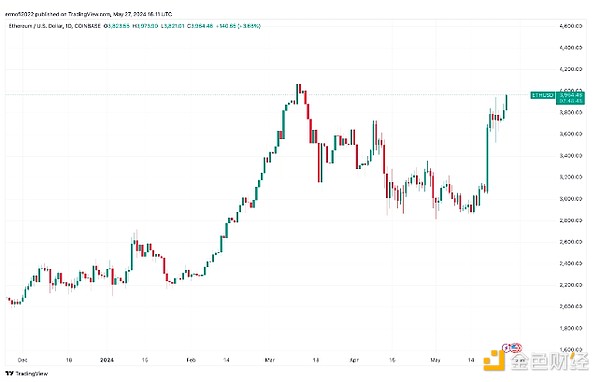
ETH/USD daily chart. Source: TradingView
Ethereum’s performance over the past seven days has been largely driven by expectations that a spot Ethereum exchange-traded fund (ETF) will be approved in the U.S. While ETH’s performance has been lackluster following the approval, the move toward $4,000 is seen as significant.
Cryptocurrency analyst Jelle said Ethereum has completed a long period of accumulation and with the approval of the spot Ethereum ETF, the price is ready to enter a "rally."
Jelle explained in a May 27 X post that although it “took much longer than expected,” market participants are “finally seeing a bull run for Ethereum again.”
Michaël van de Poppe, analyst and founder of MN Capital, made a similar observation using the ETH/BTC weekly chart. Van de Poppe said that the weekly relative strength index (RSI) showed a bullish divergence, which means that capital is starting to move from Bitcoin to Altcoin after a long crypto winter.
“There’s a good chance Ethereum’s 2.5-year bear market is finally coming to an end.”
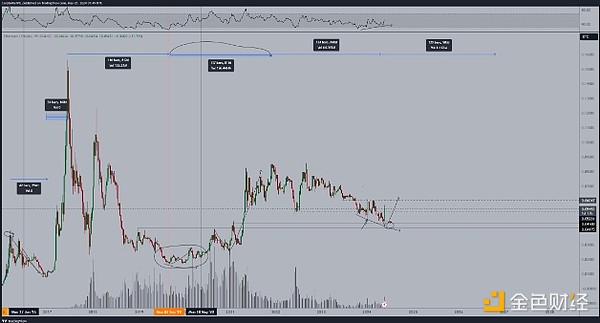
ETH/BTC weekly chart. Source: Michaël van de Poppe
“#ETH confirms bullish divergence and downtrend breakout,” cryptocurrency trader Matthew Hyland declared in a May 27 X post. He added that an increase in volume would “further validate the breakout.”
Analyst Tuur Demeester believes that the optimism in the Ethereum market has yet to be realized. In a May 25 post on X, Demeester shared the following chart: The ETH/BTC trading pair "needs to break above 0.06 to turn bullish."
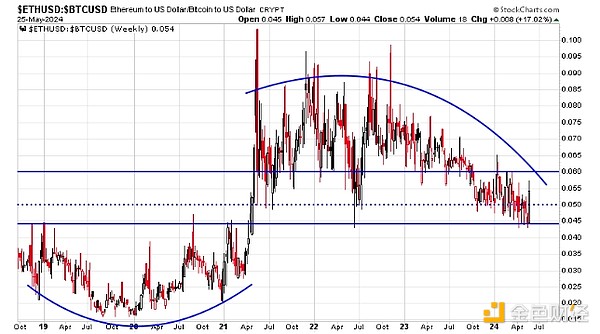
ETH/BTC weekly chart. Source: Tuur Demeester
Notably, at the time of publishing, the ETH/BTC pair was trading at 0.056, with the 50-week simple moving average (SMA) providing immediate support.
The price needs to hold this support level to increase the chances of turning the long-term downtrend line (blue) into support. If this happens, ETH/BTC will rise and face resistance at the 0.06 level contained by the 200-week SMA.
The chart below shows that a break above this level does not mean the pair is out of the woods. It still needs to flip the 100-week moving average at 0.063 to confirm a breakout.
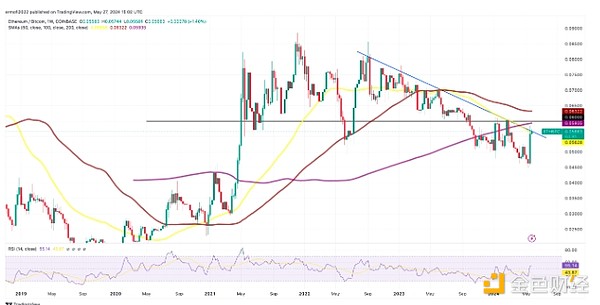
ETH/BTC weekly chart. Source: TradingView
Meanwhile, data from on-chain metrics provider CryptoQuant shows that ETH balances on exchanges have been declining over the past 12 months, reaching a six-year low of 13.58 million ETH on May 20.
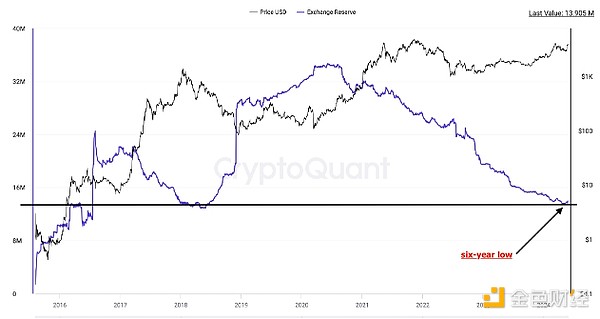
ETH balances on exchanges. Source: CryptoQuant
The decrease in Ethereum balances on exchanges signals that traders are adopting a long-term investment strategy, indicating growing confidence in Ethereum’s long-term potential and value.


