Author: CryptoVizArt, UkuriaOC, Glassnode; Translated by: Tao Zhu, Jinse Finance
Summary:
Although prices have been volatile and moving sideways since March, both Ethereum and Bitcoin markets have shown relative strength after a long period of consolidation following their ATHs.
The U.S. Securities and Exchange Commission (SEC) surprised the market with its approval of an Ethereum spot ETF, causing the price of ETH to rise by more than 20%.
Net flows for the Bitcoin US spot ETF turned positive again after four weeks of net outflows, indicating a recovery in TradFi demand.
Spending pressure on long-term holders has cooled significantly, with investors returning to accumulation mode, suggesting volatility is needed to fuel the next wave.
Increased market resilience
After recording its deepest closing correction since the FTX low (-20.3%), Bitcoin has recovered to its ATH, reaching $71,000 on May 20. From a comparative perspective, the retracement pattern of the 2023-2024 uptrend appears to be very similar to the 2015-2017 bull run.
The 2015-2017 uptrend occurred during the infancy of Bitcoin, when there were no derivatives available for the asset class. We can draw a comparison with the current market structure, suggesting that the 2023-2024 uptrend could be primarily a spot-driven market. The launch and inflows of US spot ETFs support this view.
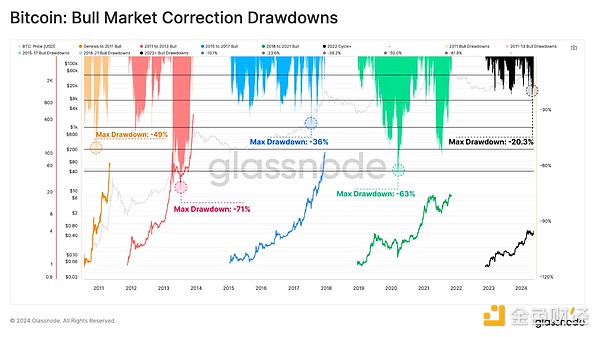
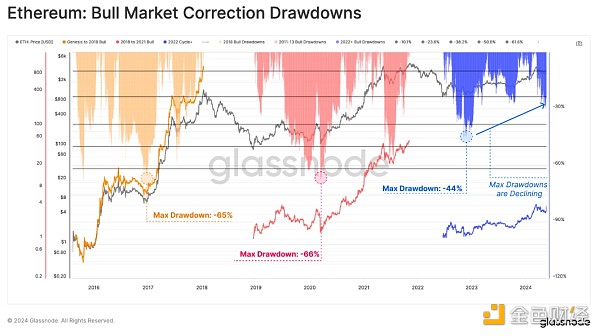
Since the FTX low, Ethereum’s correction has also been significantly shallower compared to previous cycles. This structure suggests that market resilience is increasing to some extent between each successive pullback, while downside volatility is decreasing.
However, it is worth highlighting that Ethereum has been slower to recover relative to Bitcoin. ETH has also significantly underperformed compared to other leading crypto assets over the past two years, as reflected in the weak ETH/BTC ratio.
Nonetheless, the approval of a U.S. spot Ethereum ETF this week was a generally unexpected development that could provide the necessary catalyst to spur strength in the ETH/BTC ratio.
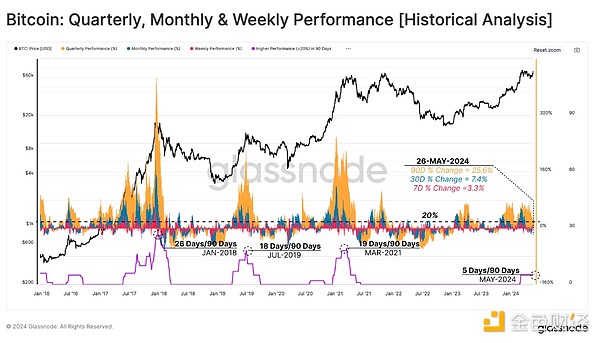
If we examine the rolling performance of the Bitcoin market on a weekly (red), monthly (blue), and quarterly (orange) timeframe, we can see strong overall performance, recording +3.3%, +7.4%, and +25.6%, respectively.
To highlight periods of particularly strong price performance, we can count the number of trading days within a 90-day window where all three timeframes performed more than +20%. So far, only 5 days have reached this threshold in the last quarter.
In previous cycles, this number reached 18 to 26 days, which suggests that the current market may be more cautious relative to historical bull markets .
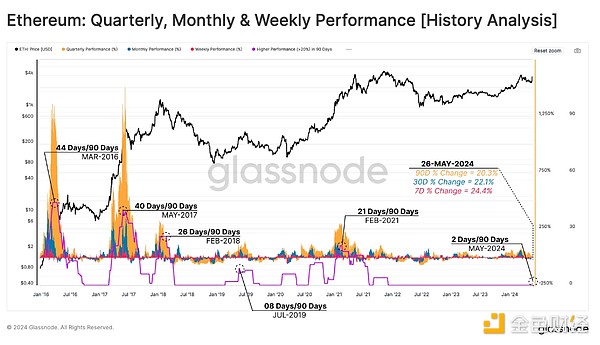
We can evaluate Ethereum in a similar framework and see the huge impact of the ETF approval. The news triggered buy-side pressure almost immediately, resulting in the first price change of more than 20% since the end of 2021.
If we consider the outsized impact that spot ETFs have had on Bitcoin since the beginning of the year, the ETH/BTC pair may be showing early signs of a brighter future.
ETF buyers are making a comeback
In early March, the price of Bitcoin decisively broke through a new high of $73,000, and at the same time, long-term holders were selling a large amount of supply. This seller created a supply glut, which led to a period of correction and consolidation. Over time, lower prices and seller exhaustion began to give way to a mechanism for re-accumulation.
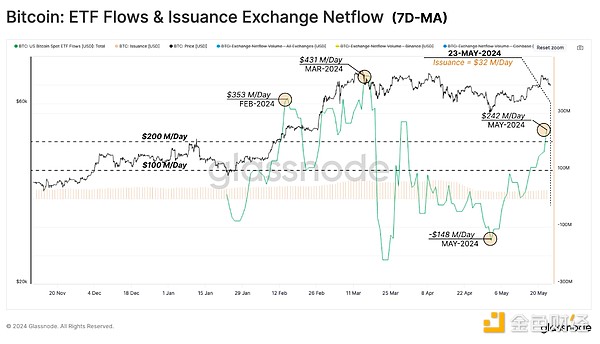
We can see this in Bitcoin ETF flows, which turned into a net outflow pattern throughout April. As the market sold off to local lows around $57,500, the ETF saw massive net outflows of -$148 million per day. However, this proved to be a micro-capitulation, with the trend reversing sharply thereafter.
Last week, the ETF experienced significant net inflows of $242 million per day, indicating a return of buy-side demand. Considering the natural daily selling pressure from miners since the halving of $32 million/day, the ETF has seen nearly 8 times more buying pressure. This highlights the size and scale of the ETF’s impact, but also the relatively small impact of the halving.
Back to excitement
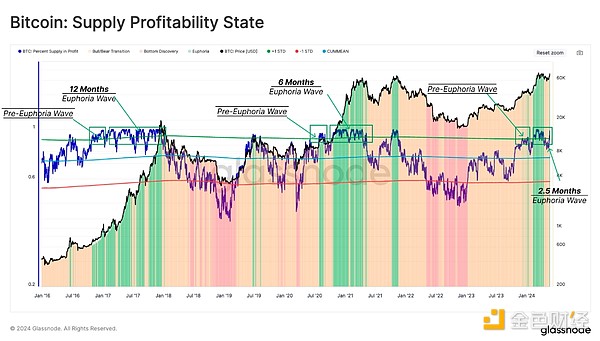
The percentage of circulating supply in profit provides valuable information about each market cycle, and a set of repeating patterns emerge. In the early stages of a bull market, when prices attempt to reclaim the previous ATH, the percentage of supply in profit breaks through a statistical threshold of about 90%. This marks the beginning of the pre-euphoria phase, which historically attracts investors to take profits from the table.
This selling pressure is often attributed to long-term holders who took the opportunity to exit the market at a high price, especially after enduring the downside volatility throughout the bear market.
As the market breaks new ATHs and price discovery, it enters the Excitement Phase where the Profitable Supply starts to fluctuate around the 90% level over the next 6-12 months. The current Excitement Phase is relatively new but has been active for about 2.5 months, with 93.4% of the supply in profit as of this writing.
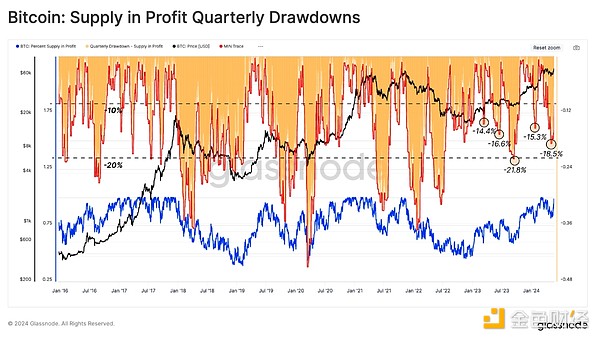
Another tool we can use to monitor corrections is the size of unrealized losses held by investors. Given that unrealized losses near the ATH represent “local top buyers,” we can assess the proportion of supply that falls into losses over a 90-day rolling window. The goal is to assess the percentage of tokens that have lost “profitable” status compared to their local price peak.
Mechanistically, these deep declines occur when new capital enters the network, absorbs the seller pressure distributed during the local uptrend, and subsequently sinks into losses in the ensuing correction.
The depth of the retracements in the current uptrend is also similar to the 2015-2017 bull run, again indicating relative strength in the market. This suggests that despite local peaks, there does not appear to be too many coins being bought at excessive prices.
Buyer pressure vs. seller pressure
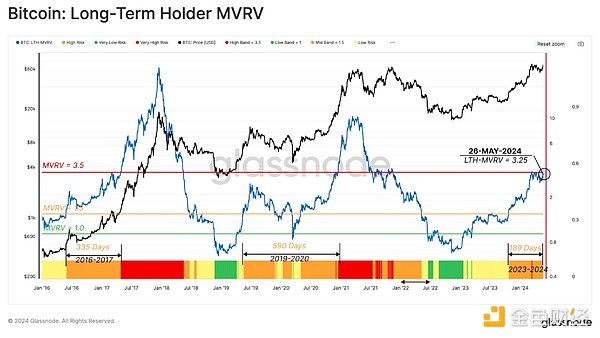
As the price rises due to new buying pressure, the counterparty (i.e. selling pressure) from long-term holders also grows in importance. Therefore, we can measure the motivation of the LTH group to sell by evaluating their unrealized profits, and evaluate the actual sellers by their realized profits.
First, LTH’s MVRV ratio reflects its average unrealized profit multiple. Historically, the transition phase between bear and bull markets is when LTH trades above 1.5 but below 3.5 (red), and can last for one to two years.
If the market uptrend continues and forms a new ATH in the process, the unrealized profits held by LTH will expand. This will greatly increase their motivation to sell and eventually lead to a certain degree of seller pressure, gradually exhausting the demand side.
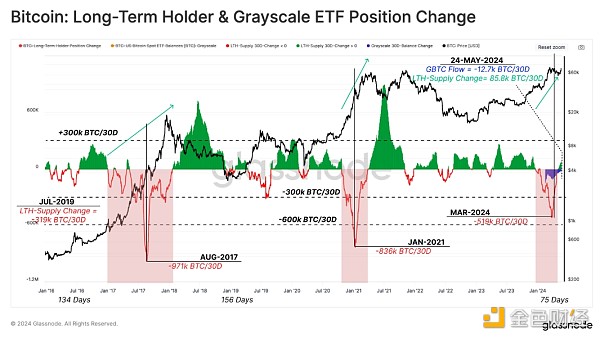
To conclude this assessment, we will evaluate the spending rate of LTH through the 30-day net position change of LTH supply. In the run-up to the ATH in March, the market experienced the first major LTH distributions.
In the past two bull markets, LTH's net distribution rate reached 836,000 to 971,000 BTC/month. Currently, net selling pressure peaked at 519,000 BTC/month in late March, of which about 20% came from Grayscale ETF holders.
This high spending state was followed by a cool-down period, with a local accumulation state causing the total LTH supply to grow by about +12k BTC per month.
Summarize
After long-term investors piled in at $73,000 ATH, the selling pressure shrank significantly. Since then, long-term holders have begun to re-accumulate Bitcoin for the first time since December 2023. In addition to this, the demand for spot Bitcoin ETFs has also clearly picked up, with positive inflows, reflecting huge buying pressure.
In addition, with the SEC’s approval of the US Ethereum spot ETF, the playing field between Bitcoin and Ethereum has become level. This further solidifies the growing adoption of digital assets throughout the traditional financial system and is a major step forward for the industry.


