Ethereum Current Status
- The launch of a spot Ethereum ETF will introduce the concepts of smart contracts and decentralized applications to more investors, allowing more investors to understand the potential of public blockchains to transform digital commerce.
- Ethereum is the largest asset in our smart contract platform crypto space by market capitalization and the largest blockchain network by number of users and applications. [1] It is scaling using a modular design philosophy where more activity occurs on related layer 2 networks over time. To maintain its dominance in this competitive market space, Ethereum needs to attract more users and increase fee revenue.
- Based on international precedents, the Grayscale research team expects the demand for US spot Ethereum ETFs to reach 25%-30% of the demand for spot Bitcoin ETFs. A large portion of Ethereum supply (such as staked ETH) may not be used for ETFs.
- Given the higher initial valuations, further price gains may be more limited compared to a Bitcoin ETF launching in January 2024, but Grayscale Research remains optimistic about the prospects for both assets.
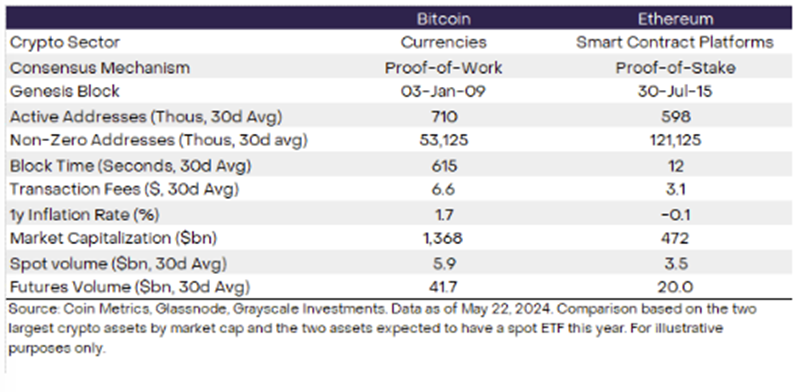
Last week, the U.S. Securities and Exchange Commission (SEC) approved Form 19b-4 filings for spot Ethereum exchange-traded funds (ETFs) filed by several issuers, signaling significant progress in listing these products on U.S. exchanges. Like the spot Bitcoin ETF that listed in January, these new products could provide a broader range of investors with access to the crypto asset class. While both assets are based on the same public blockchain technology, Ethereum is a separate network with distinct use cases (Exhibit 1). Today, Bitcoin is primarily used as a store of value and digital alternative to gold , while Ethereum is a decentralized computing platform with a rich ecosystem of applications that is often likened to a decentralized app store. New investors interested in exploring this asset may want to consider Ethereum’s unique fundamentals, competitive positioning, and its potential role in the growth of blockchain-based digital commerce.
Figure 1: Ethereum is a smart contract platform blockchain
The basics of smart contracts
Ethereum expanded on Bitcoin’s original vision by adding smart contracts. A smart contract is a pre-programmed, self-executing piece of computer code. When a user engages a smart contract, it performs a predefined action without any additional input. A classic real-world analogy is a vending machine: the user inserts a coin and the vending machine delivers the item. [2] With smart contracts, the user typically “inserts” a digital token and the software performs some type of action. These actions can include anything from exchanging tokens to issuing a loan to verifying the user’s digital identity.
Smart contracts operate through the mechanisms of the Ethereum blockchain. In addition to recording ownership of assets, block-by-block updates to the blockchain can also record arbitrary changes in "state" - a computer science term for the state of data in a database. In this way, with the addition of smart contracts, public blockchains can operate like computers (software computers rather than hardware computers). With these basic elements, Ethereum and other smart contract platform blockchains can host almost any type of application and serve as neutral core infrastructure for the emerging digital economy.
Asset Returns and Fundamentals
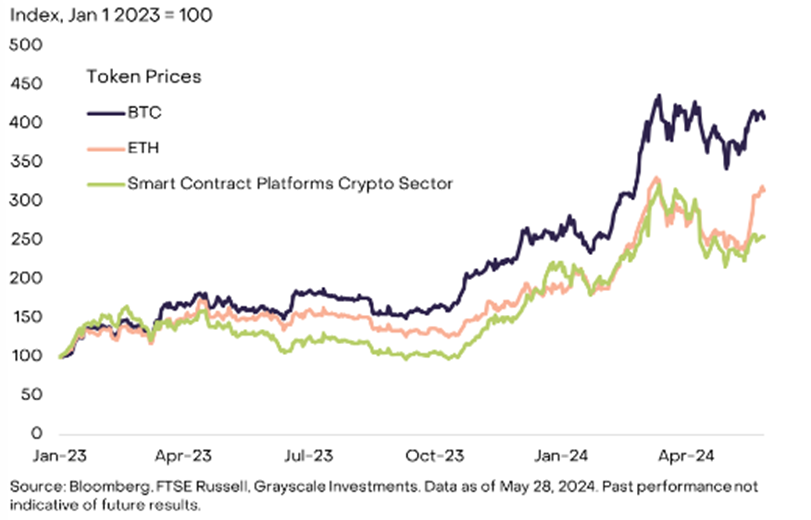
The Ethereum network’s ether (ETH) is the largest component of our smart contract platform crypto sector by market capitalization. [3] From the beginning of 2023 until recently, ETH has performed roughly in line with this segment (Exhibit 2). However, it has underperformed Bitcoin, the largest crypto asset by overall market capitalization, and Solana, the second-largest asset by market capitalization in the smart contract platform crypto sector. Like Bitcoin, ether has outperformed certain traditional asset classes both on an absolute and risk-adjusted basis since the beginning of 2023. [4] Over longer periods, both Bitcoin and Ethereum have achieved risk-adjusted returns comparable to traditional asset classes, albeit with significantly higher volatility (for more details, see our report, “ The Role of Crypto in Portfolios ”).
Figure 2: Until recently, ETH has performed in line with the cryptocurrency sector
With Ethereum’s modular design, different types of blockchain infrastructure are designed to work together to provide an end-user experience. In particular, over time, more activity is expected to occur on Ethereum’s Layer 2 network (additional software that provides blockchain functionality and connects to the Layer 1 Ethereum mainnet), allowing the ecosystem to expand. Layer 2 periodically settles and publishes its transaction records to Layer 1, benefiting from its network’s security and decentralization. This approach contrasts with blockchains with a holistic design philosophy, such as Solana, where all key operations (execution, settlement, consensus, and data availability) occur within a single Layer 1 network.
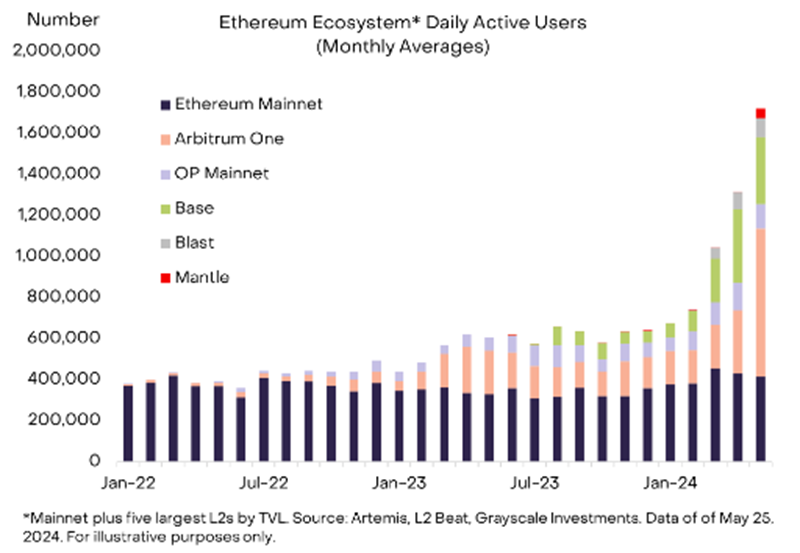
In March 2024, Ethereum underwent a major upgrade that is expected to facilitate its transition to a modular network architecture (for more details, see our report “ Ethereum’s Maturity: ‘Dencun’ and ETH 2.0 ”). From the perspective of blockchain activity, the upgrade has been successful: the number of active addresses on the Layer 2 network has increased significantly and now accounts for about two-thirds of the total activity in the Ethereum ecosystem (Exhibit 3).
Figure 3: Ethereum Layer 2 activity has grown significantly
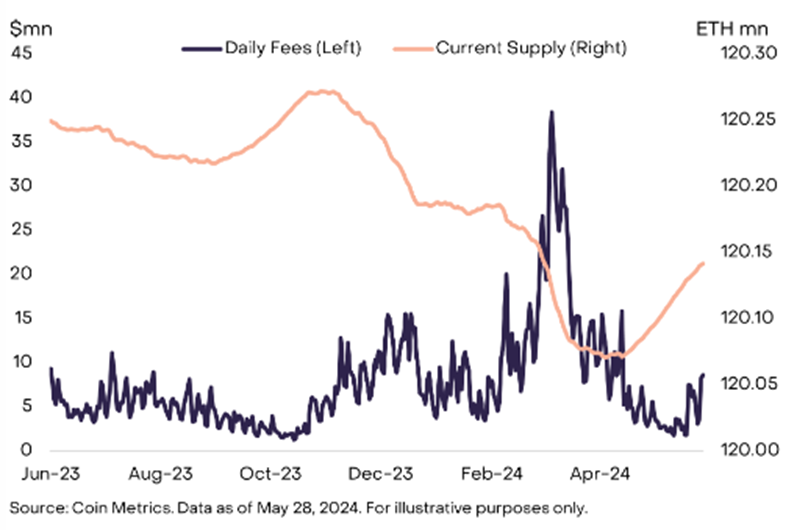
At the same time, the shift in activity to layer 2 networks has also affected Ether’s token economics, at least in the short term. Smart contract platform blockchains accrue value primarily through transaction fees, which are typically paid to validators or used to reduce the token supply. In the case of Ethereum, base transaction fees are burned (destroyed and removed from circulation), while priority fees (“tips”) are paid to validators. When Ethereum’s transaction revenue was relatively high, the number of tokens destroyed typically exceeded the rate of new issuance, and the total supply of ETH tended to decline. However, as network activity shifted to layer 2, fee revenue on the Ethereum mainnet declined and ETH supply began to increase again (Figure 4). Layer 2 networks also pay fees to publish their data to layer 1 (so-called “blob fees,” as well as other transaction fees), but the amounts tend to be relatively low.
Figure 4: ETH supply has increased recently due to lower mainnet fees
In order for the value of ether to increase over time, the Ethereum mainnet will likely need to grow fee revenue. [5] This could happen through either: i) modest growth in layer 1 activity, paying higher transaction costs, or ii) significant growth in layer 2 activity, paying lower transaction costs. Grayscale Research expects this to be a combination of increases in both layer 1 and layer 2 activity and fee revenue.
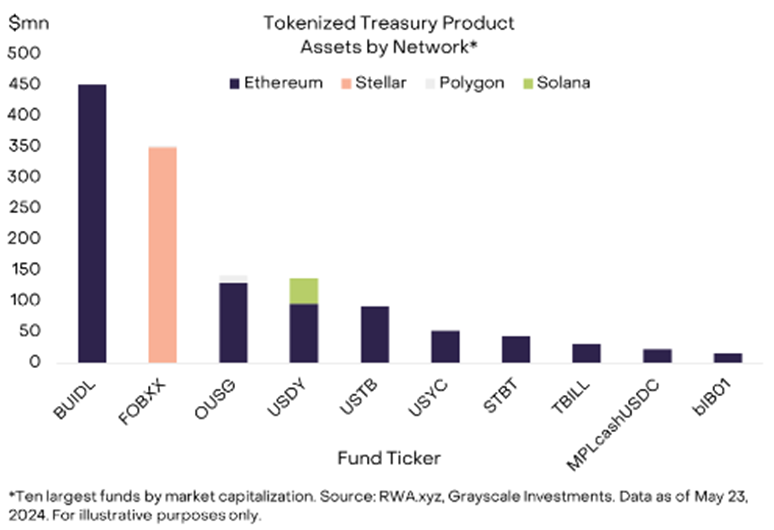
We believe that growth in Layer 1 activity is most likely to come from low-frequency and high-value transactions, and anything that requires a high degree of decentralization (at least until Layer 2 networks are sufficiently decentralized). This could include many types of tokenized projects where transaction costs may be relatively low compared to the dollar value of the transaction. Currently, about 70% of tokenized U.S. Treasuries are on the Ethereum blockchain (Figure 5). We believe that relatively high-value non-fungible tokens (NFTs) are also likely to stay on the Ethereum mainnet, as they benefit from Ethereum's high security and decentralization and change hands relatively infrequently (for similar reasons, we expect Bitcoin NFTs to continue to grow).
Figure 5: Ethereum hosts the majority of tokenized Treasury securities
In contrast, relatively high frequency and/or low value transactions occur more naturally on Ethereum’s various layer 2 networks. A good example of this is social media applications, which we have seen various recent success stories hosted on Ethereum layer 2, including friend.tech (Base), Farcaster (OP Mainnet), and Fantasy Top (Blast). We believe that gaming and retail payments may also require very low transaction costs and are more likely to migrate to layer 2 networks. Importantly, however, given the low transaction costs, these applications will need to attract a large number of users to significantly increase fee revenue on the Ethereum mainnet.
Potential Impact of US Spot Ethereum ETF
In the long term, the market capitalization of Ether should reflect its fee income, as well as other fundamentals. But in the short term, the market price of the token may be affected by changes in supply and demand. While we have seen progress towards full regulatory approval of a US spot Ethereum ETF, issuers still need their registration statements to be reviewed by the SEC's Division of Corporation Finance and declared effective. Full approval and commencement of trading for these products could bring new demand as the assets become available to a wider range of investors. Given the simple supply and demand dynamics, Grayscale Research expects that increased access to Ether and the Ethereum protocol through ETF wrappers will help drive demand, and therefore the price of the token.
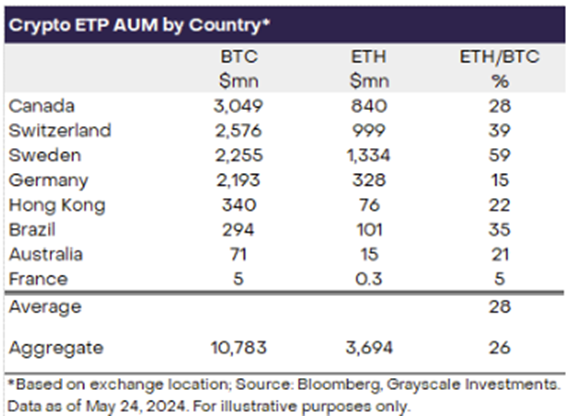
Outside the United States, both Bitcoin and Ethereum exchange-traded products (ETPs) are listed, with assets in the Ethereum ETP accounting for approximately 25%-30% of Bitcoin ETP assets (Exhibit 6). Based on this, Grayscale Research’s working assumption is that net inflows into U.S.-listed spot Ethereum ETFs will be 25%-30% of net inflows into spot Bitcoin ETFs to date, or $3.5-4 billion in the first four months or so (25%-30% of the $13.7 billion in net inflows into spot Bitcoin ETFs since January). [6] Ethereum’s market cap is approximately one-third (33%) of Bitcoin’s, so our assumption implies that Ethereum net inflows as a percentage of market cap could be slightly smaller. While we believe this is a reasonable working assumption, the estimate is uncertain and there are risks of both higher and lower net inflows into U.S.-listed spot Ethereum ETFs. In the U.S. market, ETH futures ETFs only account for approximately 5% of BTC futures ETF assets, although we believe this is not representative of relative demand for spot ETH ETFs. [7]
Figure 6: Outside the United States, Ethereum ETP AUM accounts for 25%-30% of Bitcoin ETP AUM
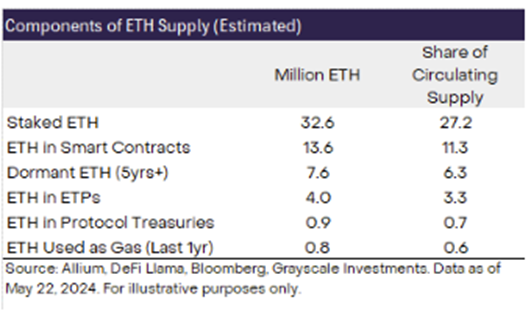
In terms of ETH supply, Grayscale Research believes that about 17% of ETH can be classified as idle or relatively illiquid. According to data from data analysis platform Allium, this includes about 6% of the ETH supply that has not been moved for more than five years, and about 11% of the ETH supply is "locked" in various smart contracts (such as bridges, wrapped ETH, and various other applications). In addition, 27% of the ETH supply is staked. Recently, issuers of spot Ethereum ETF applications, including Grayscale, have removed mentions of staking from public documents, indicating that the SEC may allow these products to be traded in the United States without staking. Therefore, this part of the supply is unlikely to be purchased by the ETF.
Outside of these categories, $2.8 billion worth of ETH is used for network transactions each year. At current ETH prices, this represents an additional 0.6% of supply. [8] There are also a number of protocols that hold large amounts of ETH in their treasuries, including the Ethereum Foundation ($1.2 billion worth of ETH), Mantle (~$879 million ETH), and Golem ($995 million ETH). Overall, ETH in protocol treasuries represents approximately 0.7% of supply. [9] Finally, approximately 4 million ETH, or 3% of total supply, is already held in ETH ETPs. [10]
Collectively, these categories represent nearly 50% of ETH supply, although there is some overlap between categories (e.g., ETH in protocol repositories may be staked) (Exhibit 7). For any potential new U.S.-listed spot Ethereum ETF, we believe net purchases of ETH are more likely to come from the remaining circulating supply. If existing usage limits the available supply for a new spot ETF product, any incremental demand could have a greater impact on price.
Figure 7: A large portion of ETH supply is unable to enter new spot ETFs
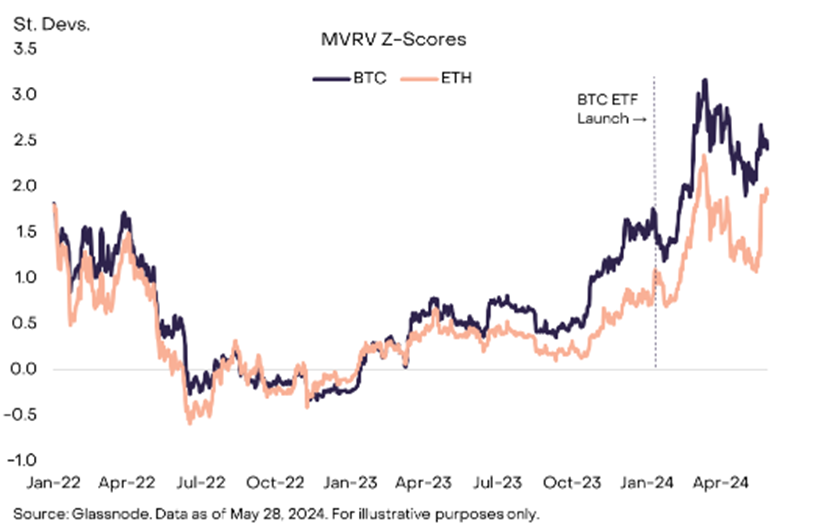
From a valuation perspective, Ethereum is arguably more valuable than Bitcoin was when the spot Bitcoin ETF launched in January. For example, one popular valuation metric is the MVRV z-score . This metric is based on the total market capitalization of a token as a ratio of its “realized value”: the market capitalization based on the price at which the token last moved on-chain (as opposed to the price at which it trades on an exchange). When the spot Bitcoin ETF launched in January, its MVRV z-score was relatively low, suggesting a modest valuation and potentially more room for price upside. Since then, the cryptocurrency market has appreciated, and the MVRV ratios of both Bitcoin and Ethereum have increased (Chart 8). This may indicate that there is less room for price upside following the approval of the spot ETH ETF compared to the approval of the US spot Bitcoin ETF in January.
Figure 8: ETH is worth more than BTC when the spot Bitcoin ETF is launched
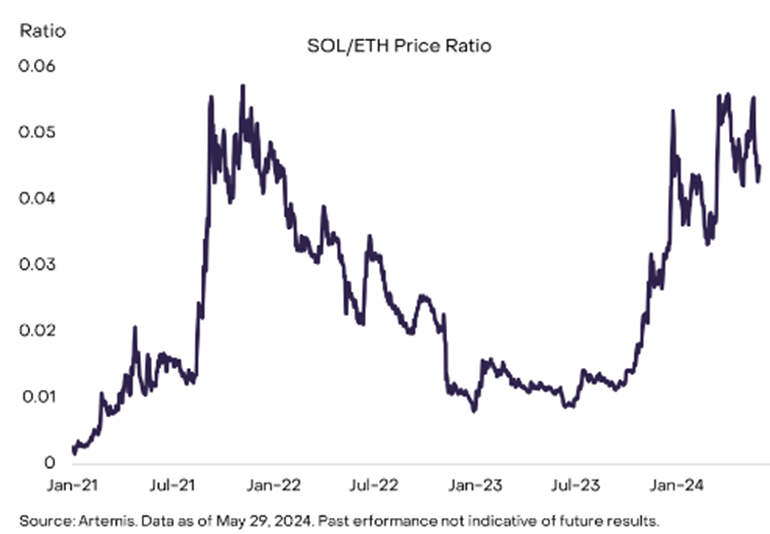
Finally, crypto-native investors may be concerned about the impact of a spot Ethereum ETF on competition in the smart contract platform cryptocurrency space, specifically the SOL/ETH price ratio. Solana is the second-largest asset in this segment (by market cap), and Grayscale Research believes that it is currently best positioned to take market share from market leader Ethereum in the long term. Solana has significantly outperformed Ethereum over the past year, with the SOL/ETH price ratio now near the peak of the last crypto bull run (Chart 9). [11] This may be due in part to the network’s user and developer community continuing to grow the ecosystem despite the involvement of failed crypto exchange FTX (in terms of token ownership and development activity). More importantly, Solana has also been able to drive increased trading activity and fee revenue through a compelling user experience. In the short term, we expect the SOL/ETH price ratio to stabilize as inflows from the new spot Ethereum ETF support the price of ETH. However, in the long term, the SOL/ETH price ratio will likely be determined by the relative growth of fee revenue between the two chains.
Figure 9: SOL/ETH price ratio is close to the previous cycle high
Looking ahead
While the launch of a spot ETH ETF in the U.S. market could have an immediate impact on valuations, regulatory approval is important beyond price. Ethereum provides an alternative framework for digital commerce based on decentralized networks. Modern online experiences work quite well, but public blockchains may offer even more possibilities, including near-instant cross-border payments, true digital ownership, and interoperable applications. While there are other smart contract platforms that offer this utility today, the Ethereum ecosystem has the most users, the most decentralized applications, and the deepest pool of capital. [12] Grayscale Research expects that the new spot ETF could introduce this transformative technology to a wider audience of investors and other observers and help accelerate the adoption of public blockchains.
[1] Source: Artemis, Dapp Radar. Data as of May 27, 2024.
[2] This metaphor comes from computer scientist Nick Szabo’s 1997 memo “The Idea of Smart Contracts.”
[3] Source: Artemis. Data as of May 27, 2024.
[4] For example, from December 31, 2022 to May 23, 2024, the price returns and returns divided by annualized volatility of Bitcoin and Ethereum exceeded those of the global equity market (represented by the MSCI World Index), the global bond market (represented by the Bloomberg-Barclays Global Aggregate Index), and the commodity market (represented by the S&P/GSCI). Source: Bloomberg, Grayscale Investments. Data as of May 23, 2024. Past performance is not indicative of future results.
[5] While Grayscale Research considers fee income to be the primary driver of smart contract platform valuations, other factors may include maximum extractable value (MEV), possible “monetary premium” (willingness to hold an asset for store of value and/or medium of exchange purposes), and other factors.
[6] Source: Bloomberg, Grayscale Investments. Data as of May 24, 2024.
[7] Source: Bloomberg, Grayscale Investments. Data as of May 28, 2024.
[8] Source: Artemis, Grayscale Investments. Data as of May 24, 2024.
[9] Source: DeFi Llama.
[10] Source: Bloomberg, Grayscale Investments. Data as of May 24, 2024.
[11] In terms of market capitalization, Solana’s gain is greater due to its relatively higher supply growth.
[12] Source: Artemis, Dapp Radar, Defi Llama. Data as of May 27, 2024.