

Currently, the price of Bitcoin continues to consolidate not far below its historical peak, and long-term investors have begun to accumulate Bitcoin assets again for the first time since December 2023. At the same time, as the first batch of Ethereum spot ETFs were historically approved for listing in the United States, the price of Ethereum rose by 20% accordingly.
Summary
Although the prices of Bitcoin and Ethereum have been trading sideways with small fluctuations since March, the markets of these two assets have shown relative strength after a long period of consolidation after experiencing historical price peaks.
The U.S. Securities and Exchange Commission (SEC)'s approval of an Ethereum spot ETF surprised the market, causing ETH prices to rise by more than 20%.
Net flows of U.S. Bitcoin spot ETFs turned positive again after four weeks of net outflows, indicating a recovery in demand from the traditional financial sector.
Selling pressure from long-term holders has dropped significantly, while investor behavior has returned to an accumulation mode, suggesting that higher volatility is needed to fuel the next wave.
Poised to rebound
After reaching its lowest point since the FTX crash (-20.3%), Bitcoin price began to recover to its historical peak and reached $71,000 on May 20. Compared with previous situations, the pattern of price retracements in the 2023-24 uptrend seems to be very similar to the retracements that occurred in the 2015-17 bull market.
The 2015-17 uptrend occurred during the infancy of Bitcoin, when there were no derivatives available to analyze the asset class. But now we can compare it with the current market structure, and the analysis shows that the 2023-24 uptrend may be mainly driven by the spot market. The launch and inflow of US spot ETFs just support this assertion.
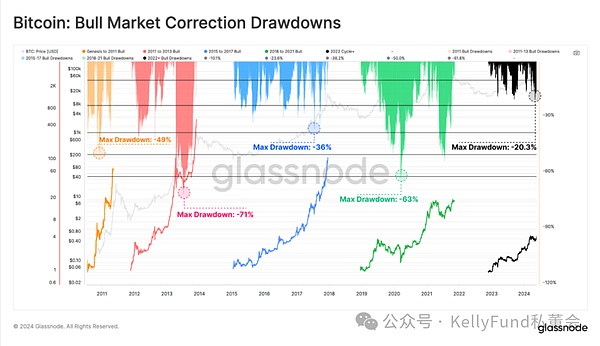
Figure 1: Bitcoin bull market adjustment retracement
Since the lows created by the FTX crash, Ethereum has seen significantly smaller corrections compared to previous cycles. This market structure suggests that market resilience is increasing to some extent between each successive pullback, while downside volatility is decreasing.
However, it is worth highlighting that Ethereum has recovered more slowly than Bitcoin. Over the past two years, ETH has significantly underperformed compared to other top crypto assets, which is mainly reflected in the relatively weaker ETH/BTC ratio.
Nonetheless, the approval of an Ethereum spot ETF in the U.S. is a broadly unexpected development that could provide the necessary catalyst to spur strength in the ETH/BTC ratio.
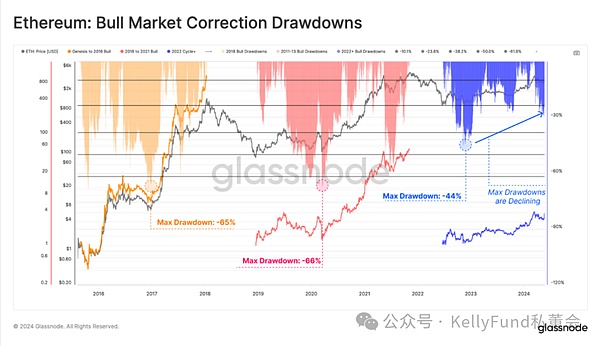
Figure 2: Ethereum bull market adjustment retracement
'Diamond Hands' Dominate the Market
(Note: "Diamond Hands" refers to investors who hold highly volatile financial assets and hold on to them even under extremely high selling pressure)
As prices rise due to new buying pressure, the importance of selling pressure from long-term holders also grows. Therefore, we can measure the reasons that are sufficient to motivate them to sell the asset by evaluating the unrealized profits of the long-term holder group, and evaluate the actual situation of sellers through their realized profits.
First, the MVRV ratio of long-term holders reflects their average unrealized profit multiple. Historically, the trading profits of long-term holders in the transition phase between bear and bull markets are above 1.5 but below 3.5, and this phase can last for one to two years.
If the market's upward trend continues and eventually forms a new historical price peak in the process, the unrealized profits of long-term holdings will expand, which will greatly increase their desire to sell and eventually lead to a certain degree of seller pressure, gradually exhausting the demand appearing in the market.
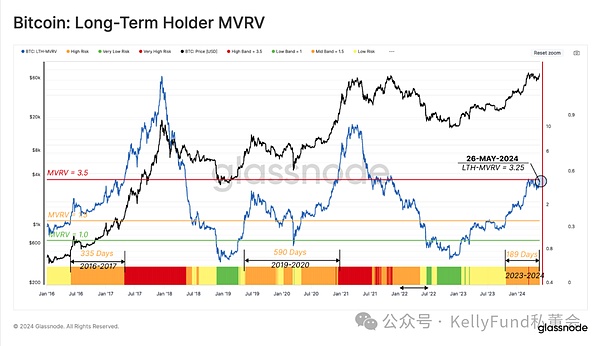
Figure 8: MVRV of long-term Bitcoin holders <span yes'; mso-bidi- font-size:10.5000pt;mso-font-kerning:1.0000pt;">
To conclude this analysis, we will assess the spending rate of long-term holders by looking at the 30-day net position change in supply from long-term holders. The market experienced its first major asset allocation from long-term holders in March as Bitcoin was heading towards a new all-time high.
In the past two bull markets, long-term holders have seen a net allocation rate of 836,000 to 971,000 bitcoins per month. Currently, the net selling pressure from them peaked at 519,000 bitcoins per month at the end of March, of which about 20% came from holders of the Grayscale ETF.
After this period of profligacy, the market entered a cooling-off period, with local accumulation of assets causing the total supply from long-term holders to grow by about 12,000 bitcoins per month.
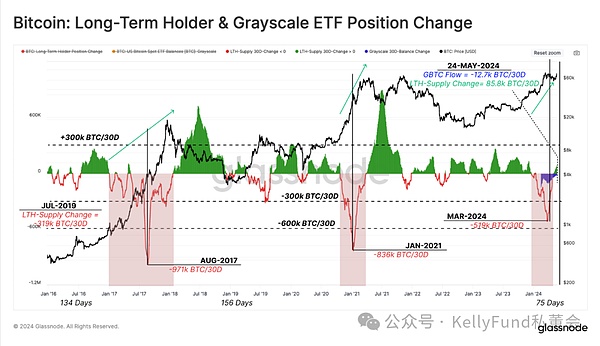
Figure 9: Changes in ETF holdings of long-term holders and Grayscale<span yes'; mso-bidi- font-size:10.5000pt;mso-font-kerning:1.0000pt;">
Summarize
After the Bitcoin price hit an all-time high of $73,000, the seller pressure shrank significantly as a large number of long-term holders began to reallocate their Bitcoin assets. Subsequently, long-term holders began to accumulate Bitcoin again for the first time since December 2023. In addition, the market demand for spot Bitcoin ETFs also rebounded significantly, which led to positive capital inflows in the market and reflected huge buyer pressure.
In addition, with the SEC’s approval of the U.S. Ethereum spot ETF, the competitive environment between Bitcoin and Ethereum has become evenly matched. This allows digital assets to further deepen their presence throughout the traditional financial system and is also an important step forward for the industry.


