This week, from June 3 to June 10, the highest price of BTC was around $71,997 and the lowest was close to $67,612, with a fluctuation range of about 6.4%.
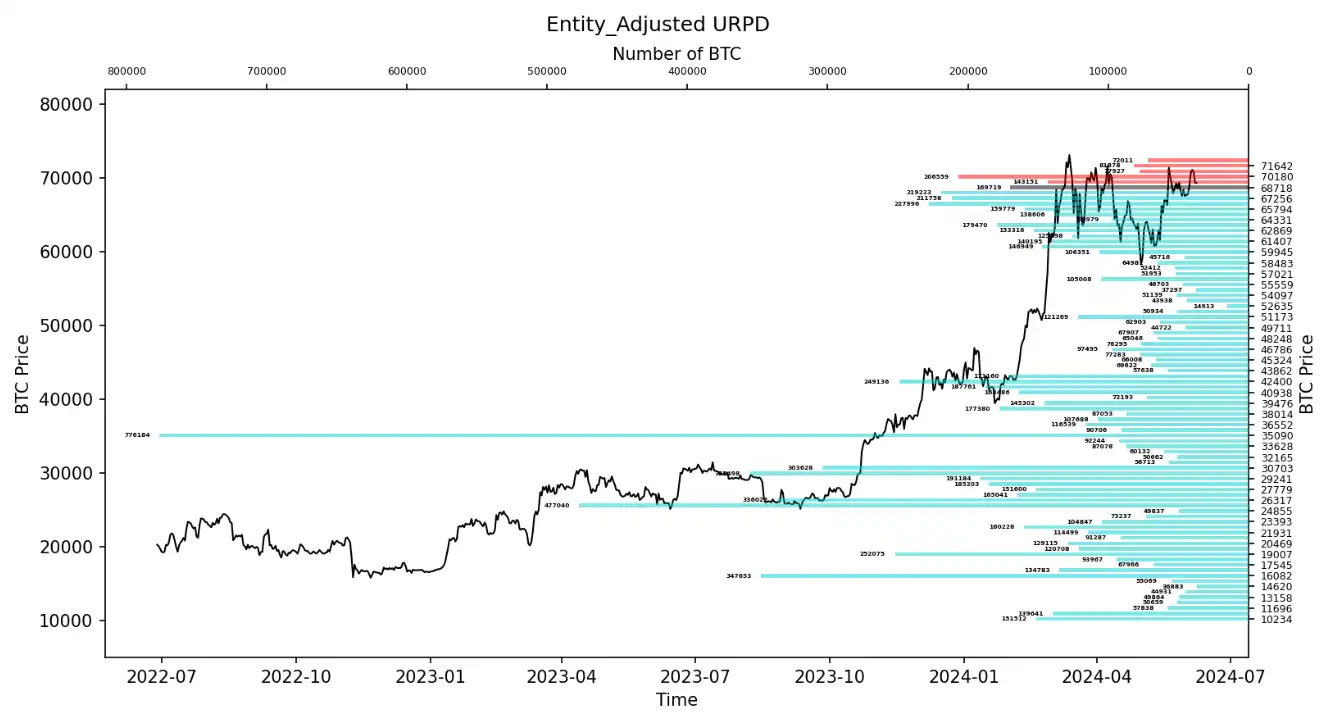
Observing the chip distribution chart, there are a large number of chip transactions around 67,000, which will have a certain support or pressure.
• analyze:
1. 59000-63000, about 890,000 pieces;
2. 64000-68000, about 830,000 pieces;
• The probability of not falling below 57,000-61,000 in the short term is 82%;
• The probability that the price will not break through 71,000-74,000 in the short term is 67%.
Important news
Economic News
1. On Thursday, June 6, the European Central Bank announced its June interest rate decision, and as expected, it cut interest rates by 25 basis points, the first time since 2019 and the second central bank among G7 member countries to cut interest rates.
2. On June 5, the Bank of Canada cut interest rates by 25 basis points to 4.75%, in line with market expectations.
3. Interest rate market data shows that the probability of the Bank of Canada further cutting interest rates in July is 60%.
4. On Thursday, U.S. data showed that the number of JOLTs job vacancies in the United States in April was 8.059 million, lower than the expected value of 8.355 million and lower than the previous value of 8.488 million.
5. U.S. non-farm payrolls increased by 272,000 in May, compared with expectations of 180,000 and the previous value of 175,000.
6. The US unemployment rate in May was 4%, expected to be 3.90%, and the previous value was 3.90%.
Encrypted ecological news
1. According to HODL15Capital data, the Australian Monochrome spot BTC ETF had a net inflow of 1 BTC on the first day.
2. South Korea’s new law will require banks to pay interest on deposits in cryptocurrency exchanges, and will take effect in July 2024.
3. According to Bitcoin Magazine, El Salvador currently holds 5,770 BTC, worth $402 million.
4. The US spot BTC ETF attracted approximately US$2.4 billion in the past month, making it the third largest ETF in terms of net inflows in the entire ETF market.
5. K33 Research reported that the spot ETH ETF will soon be listed in the United States. K33 estimates that the inflow of ETH ETF in the first five months will be between 3 billion and 4.8 billion US dollars.
6. Bernstein analysts said that after Biden vetoed the SAB 121 repeal bill, the changing narrative behind the U.S. Securities and Exchange Commission (SEC)'s unexpected approval of the ETH ETF has reduced credibility.
7. Biden vetoed the bill to repeal SAB 121, indicating that the SEC’s decision was more pragmatic to avoid legal disputes.
8. David Krause, a professor at Marquette University in the United States, believes that the Wisconsin Investment Board (SWIB) purchased $164 million of BTC spot ETFs in the first quarter, which may just be a test of market reaction. It is expected that SWIB and other US pension plans may continue to follow up. SWIB manages assets of approximately $156 billion.
Long-term insights: used to observe our long-term situation; bull market/bear market/structural change/neutral state
Mid-term exploration: used to analyze what stage we are currently in, how long this stage will last, and what situations we will face
Short-term observation: used to analyze short-term market conditions; the possibility of certain directions and certain events occurring under certain conditions
Long-term insights
• Capitulation and profit realization by long and short term players
• Large net positions on exchanges
• Traditional whale net positions
• US Crypto ETF Net Positions
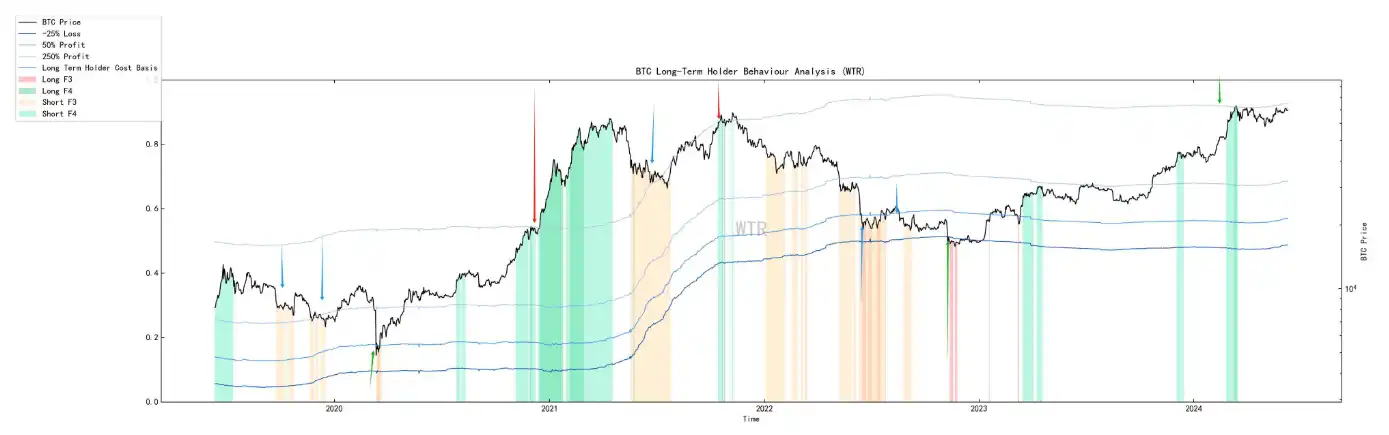
(The figure below shows the surrender and profit realization of long-term and short-term participants)
This is new experimental data:
Light green area: short-term speculators taking profits
Green area: long-term investors have made huge profits
Yellow Zone: Short-term speculators capitulate
Red area: long-term investor portraits.
The blue moving averages represent relative losses, relative profits, large profits, and super large profits for long-term investors.
Generally speaking, when the green and light green areas and the light blue moving average, which is the dividing line for super large profits, meet for the first time, the market will fall into a state of stagnation or a stage top.
The simultaneous occurrence of yellow and red areas is generally the bottom of the cycle, and the yellow area is generally the bottom of the bull market.
Currently, the huge profits of long-term investors are around 71,800. Before that, there were fluctuations and periodic tops at this position.
(The following figure shows the large net positions of exchanges)
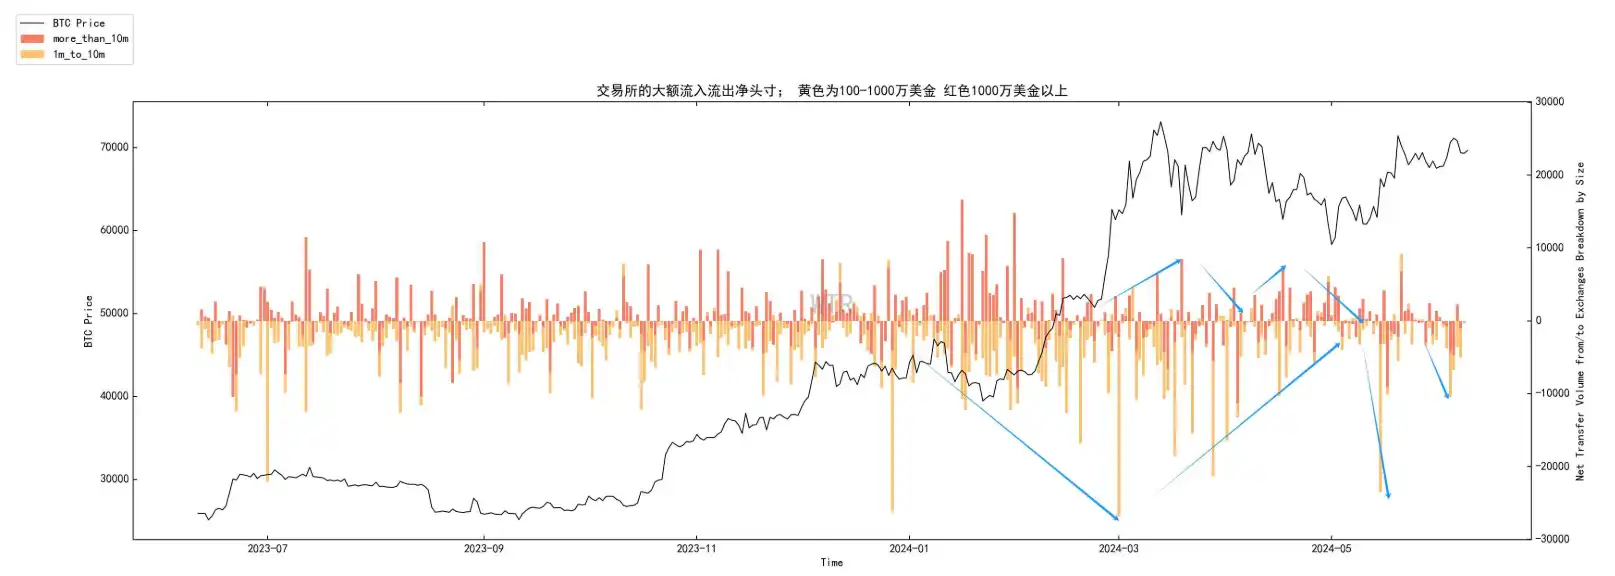
The chart shows that the number of single transfers of over $1 million into the exchange (negative) has decreased to a relatively low level.
The market's massive sell-off began to decline.
(The figure below shows the traditional whale net position)
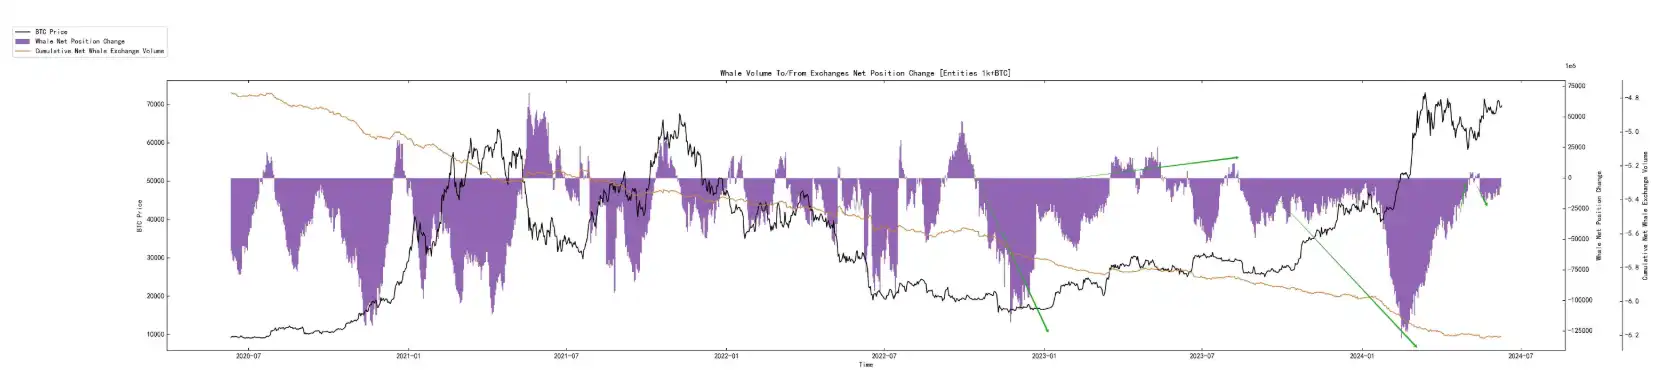
Whale also began to accumulate funds, but their willingness to buy began to decline.
(The following figure shows the net position of US crypto ETFs)
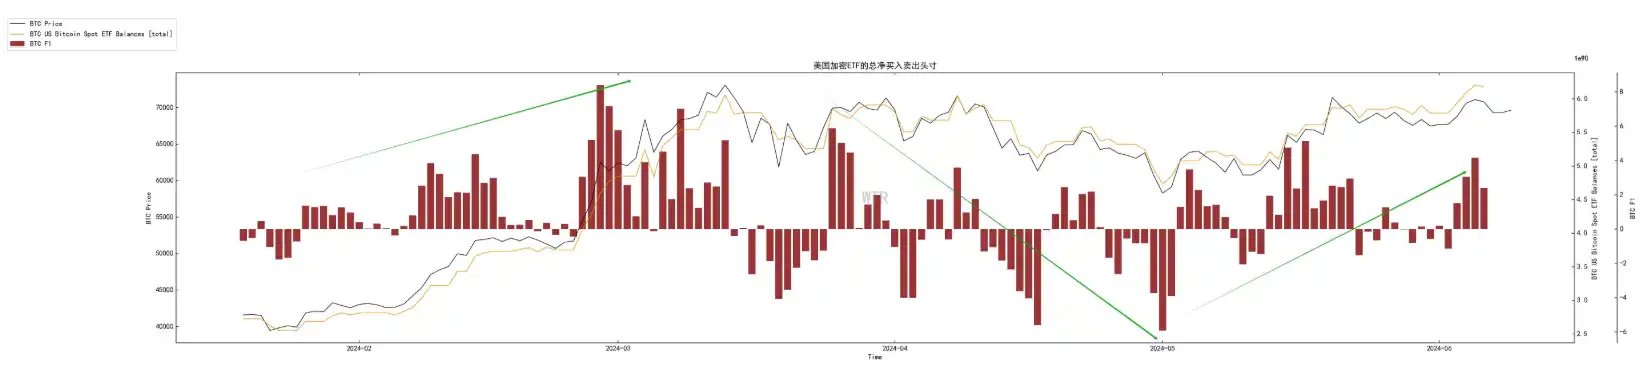
The net positions of US ETF cryptocurrencies showed continuous positive inflows for several days, and the selling pressure on ETFs began to ease.
The market started to see more external capital inflows.
Mid-term exploration
• Incremental model
• Accumulation Trend
• Ratio of long-term to short-term SOPR
• Positive online sentiment
(Incremental model shown below)
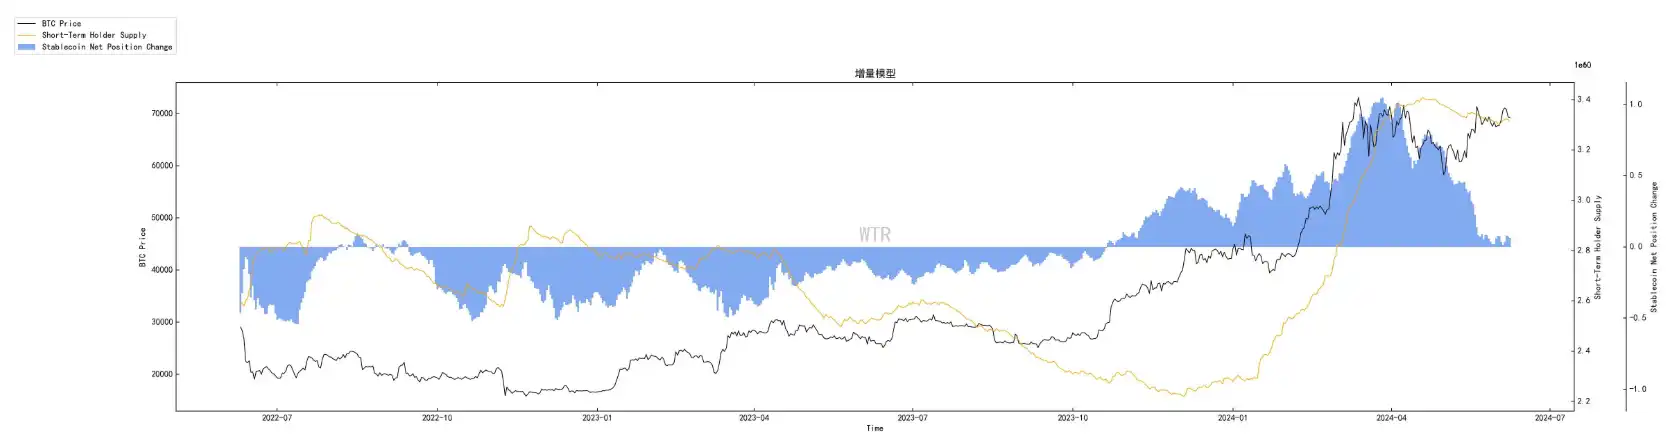
In the recent market conditions, the overall performance is close to the game situation in the existing market.
There is no sign of a reversal in the incremental volume in the market. Perhaps from the perspective of BTC, the stock situation in the market is still maintained.
(The following figure shows the cumulative trend)
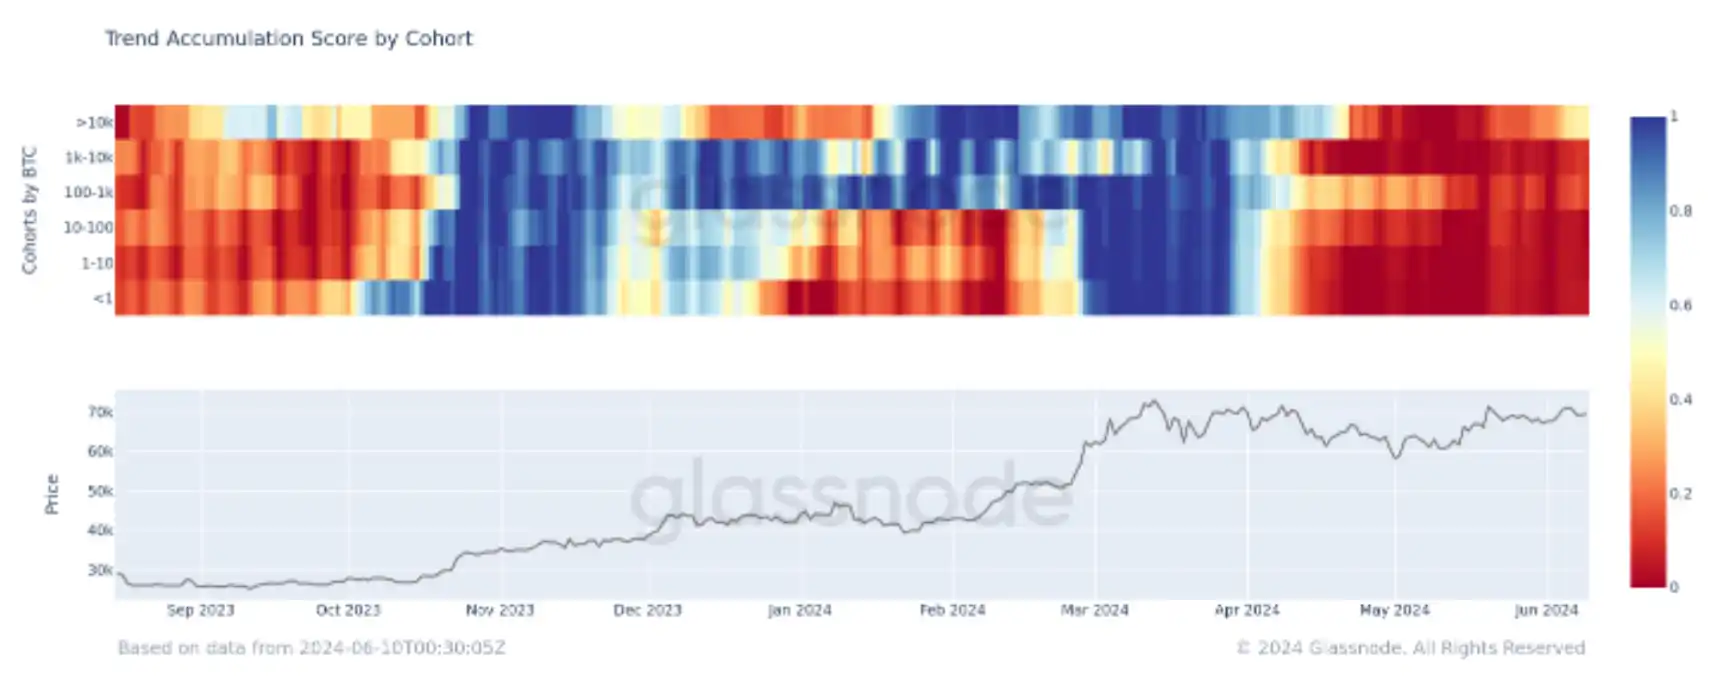
The accumulation situation in the market has eased slightly, and the accumulation status of addresses >10k is gradually approaching 0.5 points.
If this situation continues, the market may gradually present an accumulation structure, exchanging time for space.
Combined with the incremental model, in a stock environment, the accumulation trend of large groups may improve the situation in the market.
(The ratio of long-term to short-term SOPR is shown in the figure below)
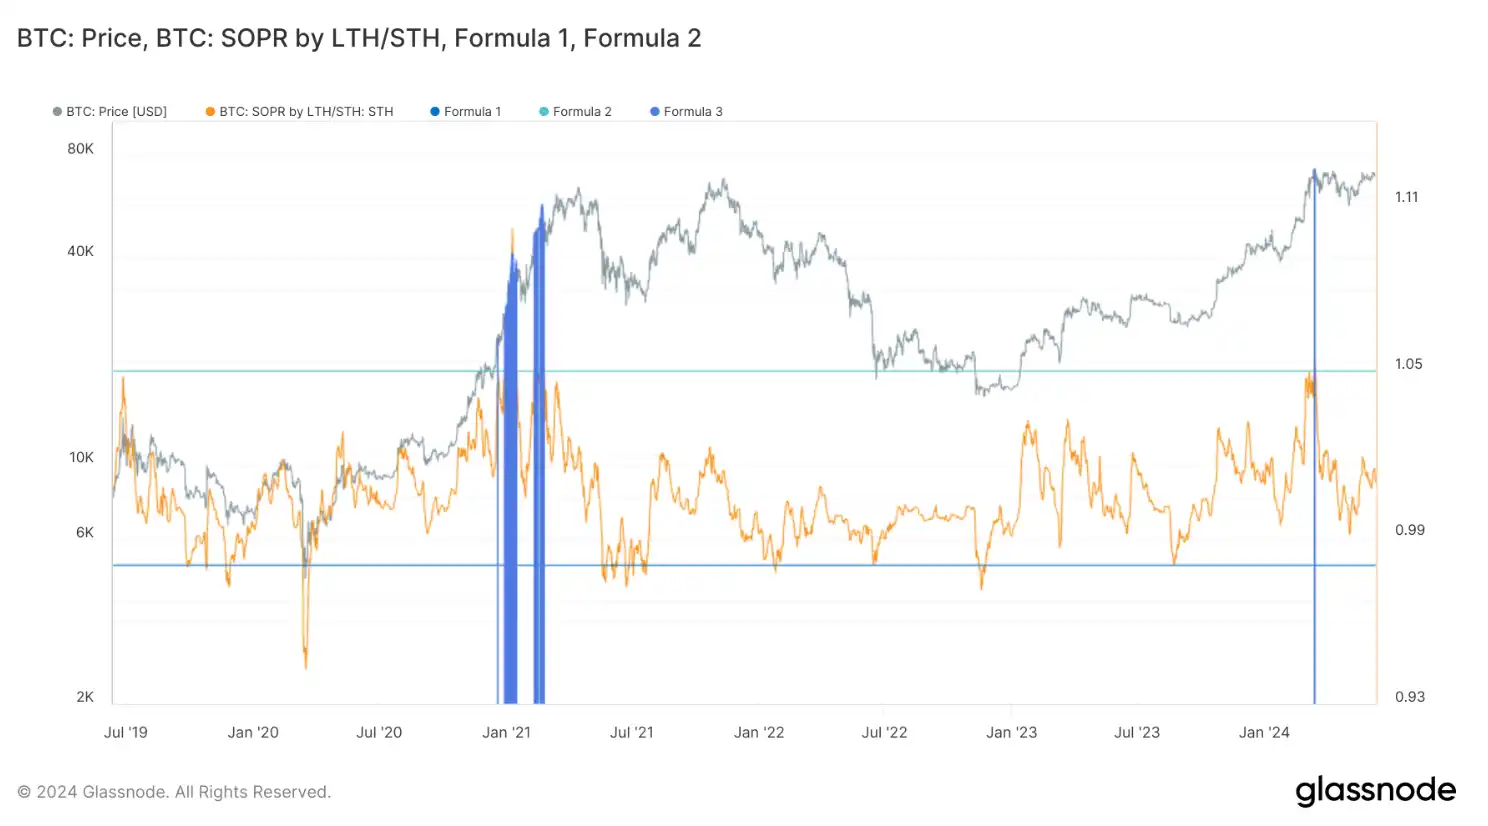
SOPR, or the cost-output profit ratio, looks at the ratio of profit to loss over a period of time.
This indicator sets the green line as the upper threshold and the light blue line as the lower threshold.
When the model breaks through the upper threshold, it may mean that the market has reached the highest profit level that it can currently bear.
It has already been touched once in March 2024, and the current market is closer to a neutral tone.
It is possible that SOPR is still oscillating within the threshold range.
(The following figure shows the positive sentiment of the network)
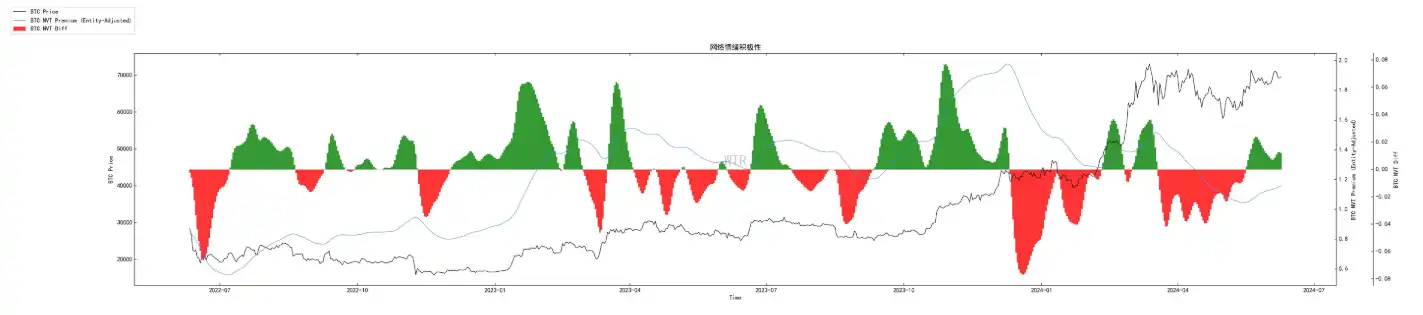
On-chain transaction sentiment shows signs of slowing down slightly, but judging from the growth situation, it is still in the upward trend channel.
It is possible that the current growth situation remains to be seen.
Short-term observation
• Derivatives risk factor
• Option intention to trade ratio
• Derivatives trading volume
• Option implied volatility
• Profit and loss transfer volume
• New addresses and active addresses
• Net position of BTC Exchange
• Net position on the ETH Exchange
• High-weight selling pressure
• Global purchasing power status
• Stablecoin exchange net positions
• Off-chain exchange data
Derivatives Rating: The risk factor is in the neutral area. The risk of derivatives is moderate.
(The following figure shows the risk factor of derivatives)
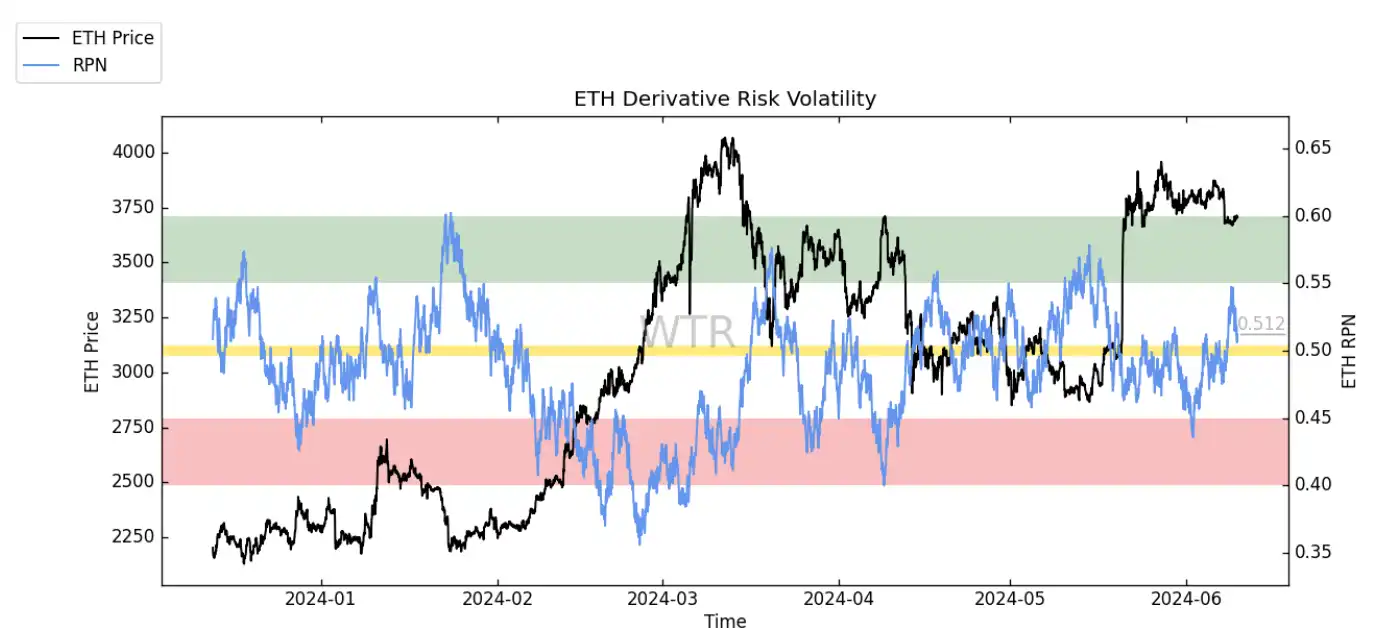
As expected last week, ETH showed a volatile adjustment. After the risk factor rose from the red area to the green area last week, it is now in the neutral area. However, judging from the risk factor, the market may continue to fluctuate and adjust this week.
(The following figure shows the option intention transaction ratio)
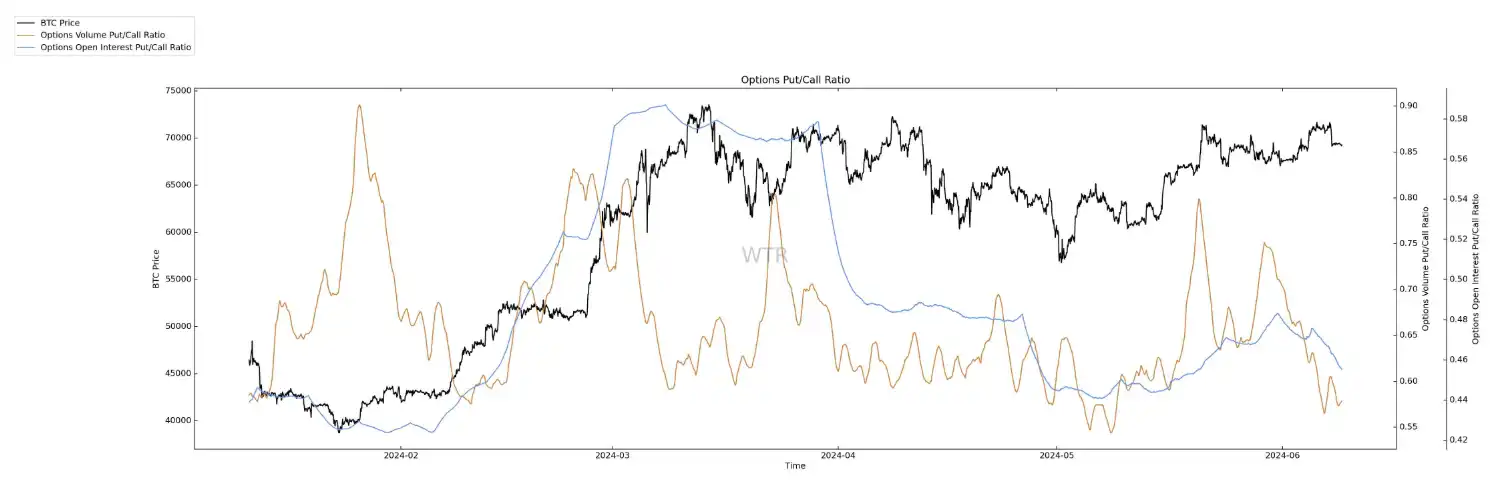
Option trading volume has declined slightly and the put option ratio is low.
(The figure below shows the derivatives trading volume)
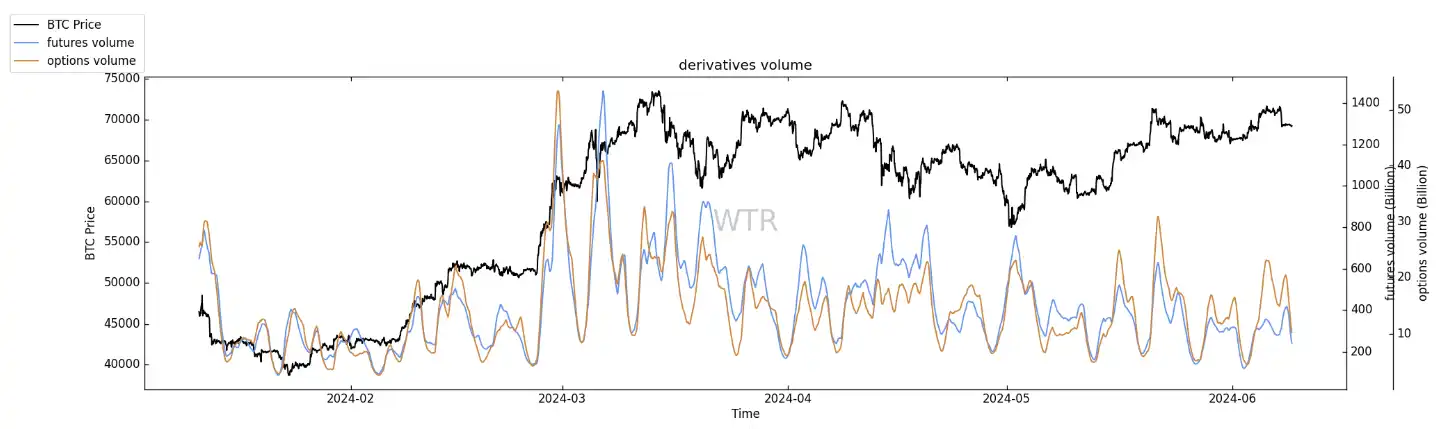
Derivatives trading volumes are at low levels.
(The figure below shows the implied volatility of options)
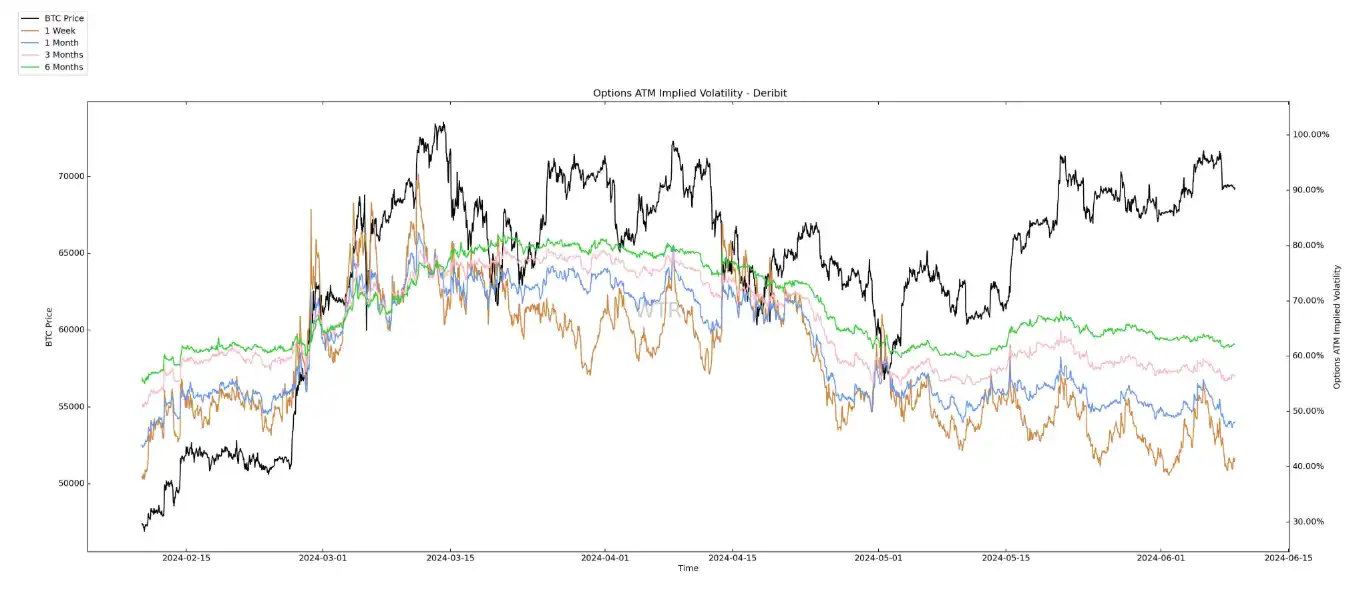
Implied volatility fell slightly.
Emotional state rating: Neutral
(The profit and loss transfer amount in the figure below)
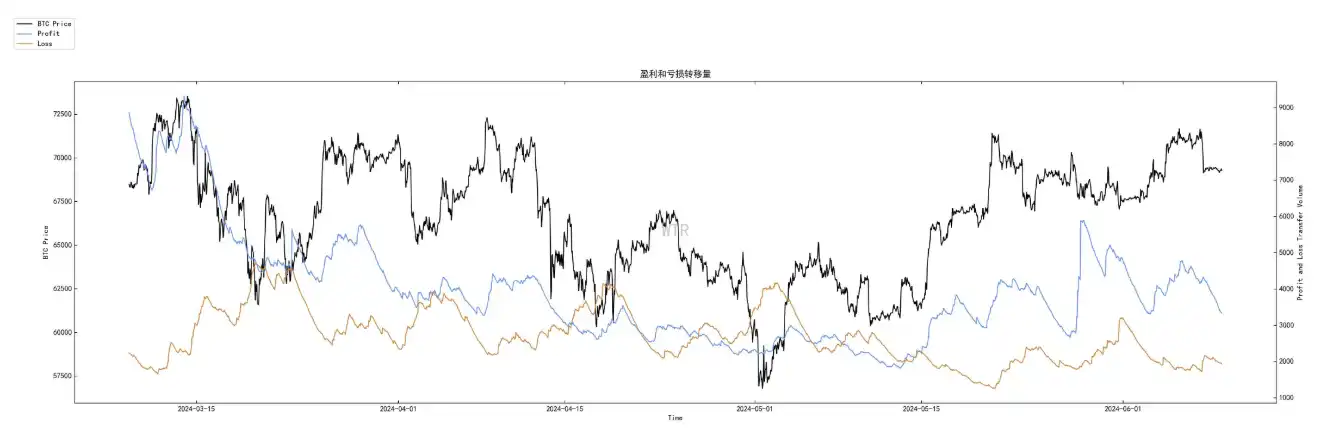
The short-term holder cost line is around 63K. The continuous market fluctuations also indicate that panic sentiment (orange line) is likely to continue to rise at the current price if there is no external black swan.
If the conditions are right, it is difficult for a sustained rise to cause a sharp drop in the market.
Currently, both positive sentiment (blue line) and fear sentiment (orange line) are at lower levels.
(Newly added addresses and active addresses are shown in the figure below)
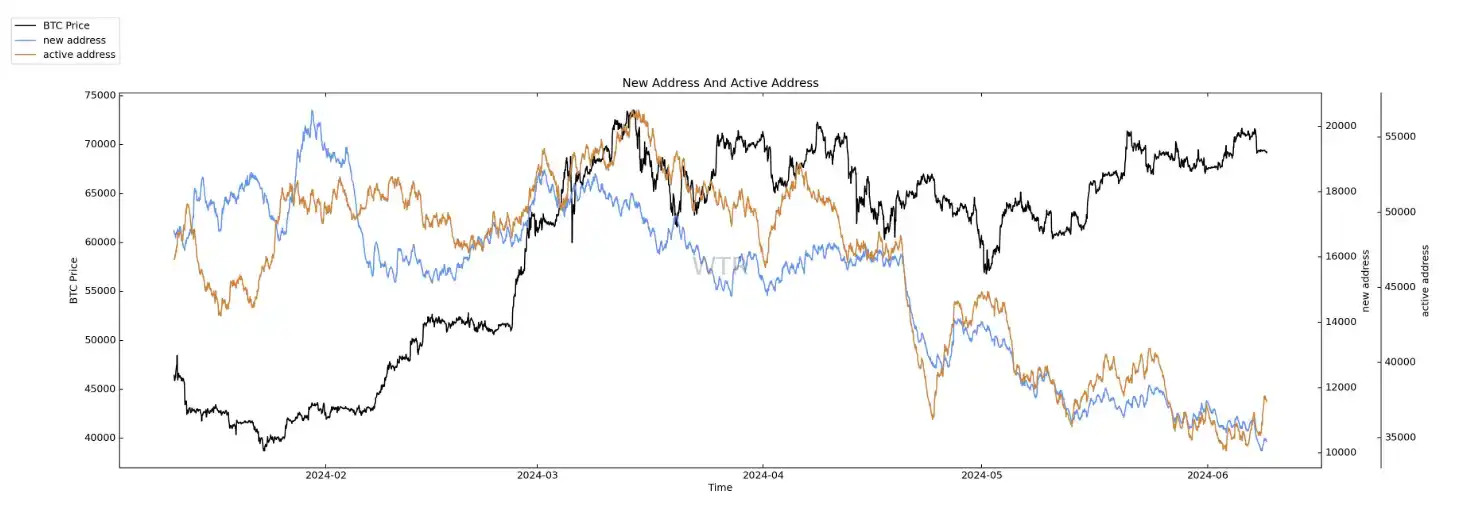
New and active addresses are at low levels.
Spot and selling pressure structure rating: Overall, there is a large amount of accumulated outflow, and the selling pressure in the market is relatively low.
(The following figure shows the net position of BTC Exchange)
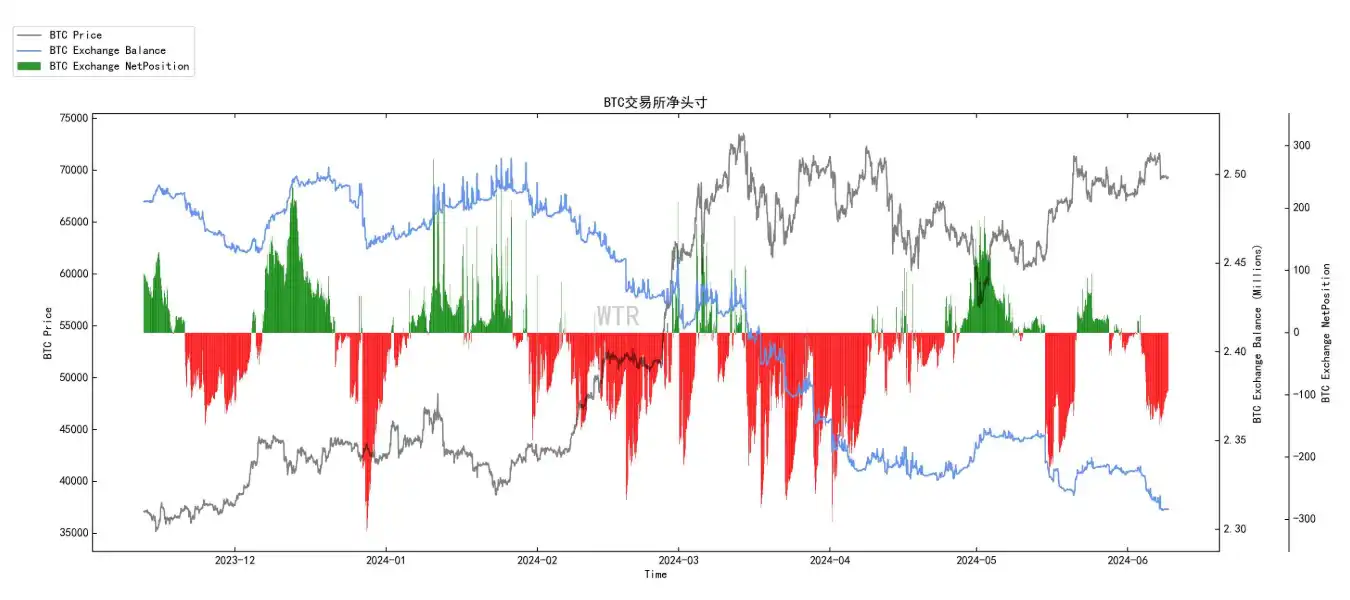
BTC exchange net positions are in a state of large outflow accumulation.
(Figure E below shows the net position of the Tai Exchange)
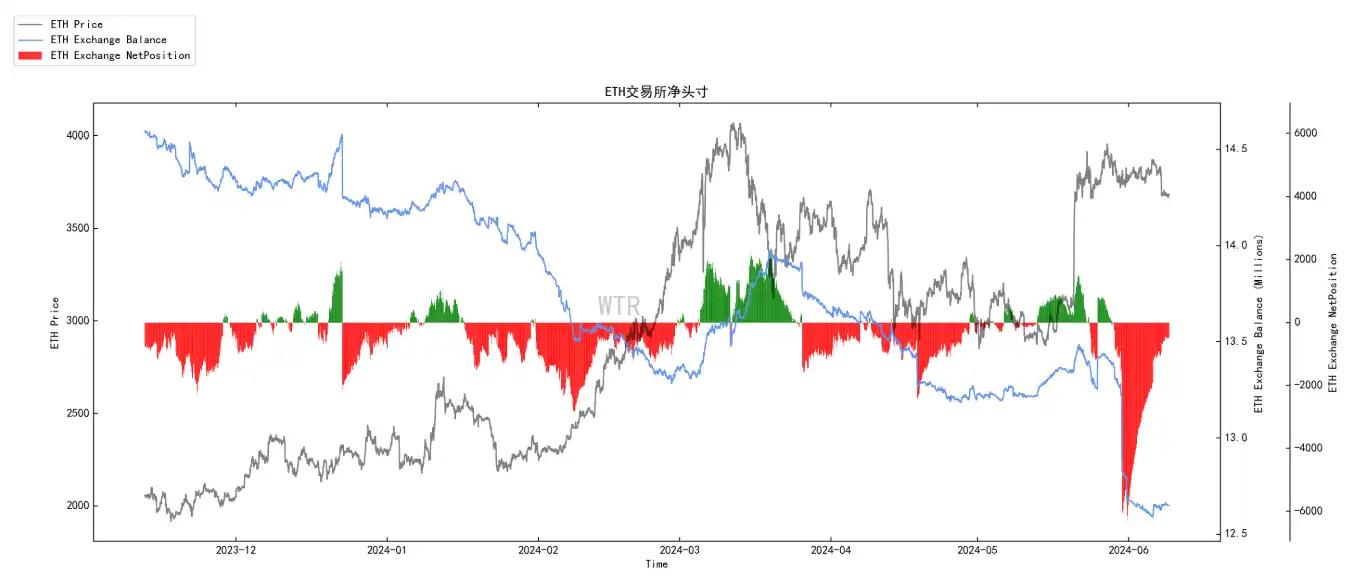
ETH exchange net positions are in a state of large outflow accumulation.
(The figure below shows high-weight selling pressure)
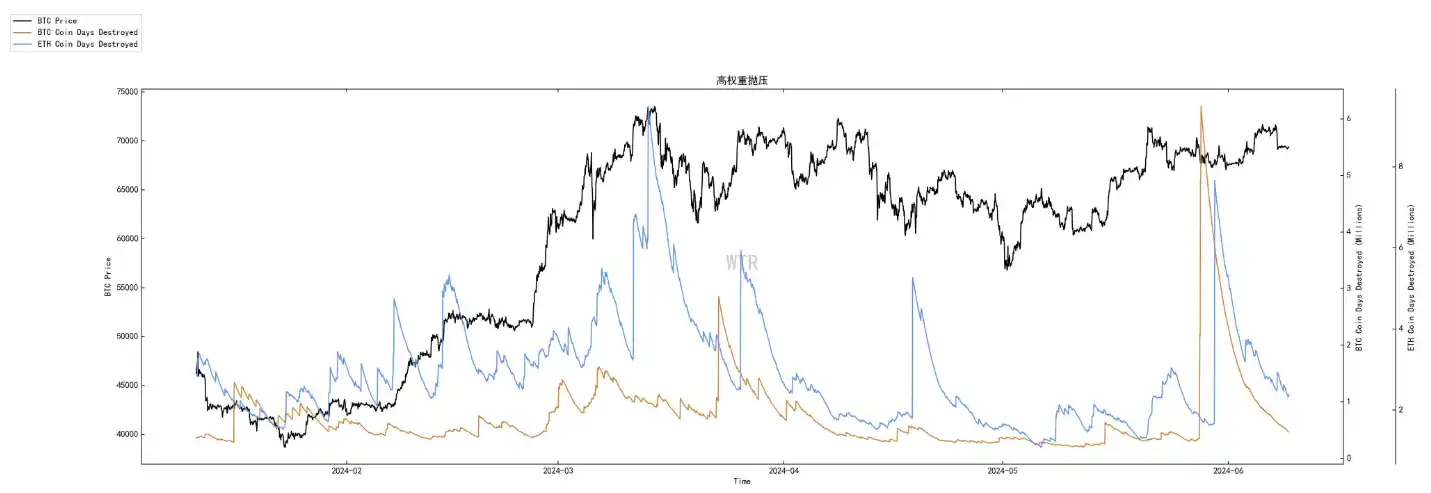
There is no high-weight selling pressure at the moment.
Purchasing power rating: Global purchasing power has declined slightly, and stablecoin purchasing power has rebounded slightly.
(The following figure shows the global purchasing power status)
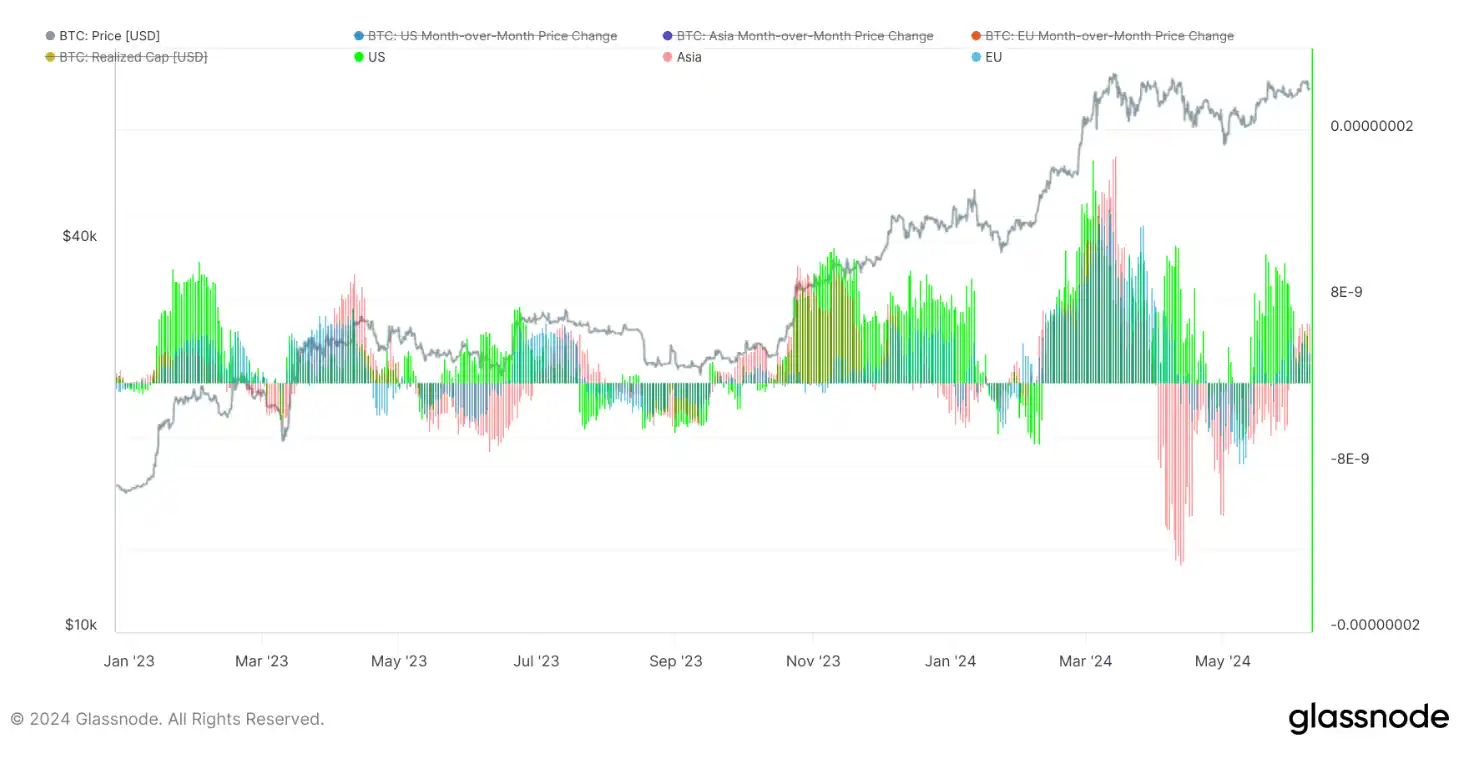
This week continued the tone of last week, with a slight decline in purchasing power in the Americas, but a slight recovery in purchasing power in Asia and Europe. Overall, purchasing power fell slightly compared to last week.
(The following figure shows the net position of USDT exchanges)
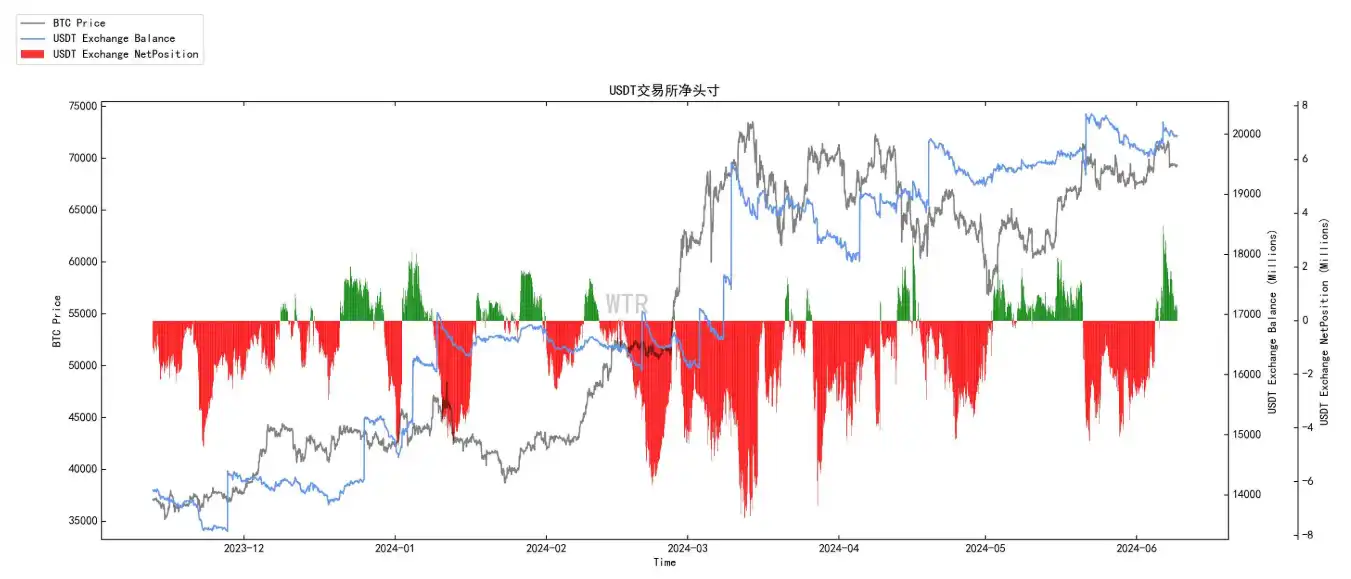
USDT exchange net positions have recovered slightly.
Off-chain transaction data rating: There is a willingness to buy at 65,000; there is a willingness to sell at 71,000.
(The following figure shows Coinbase off-chain data)
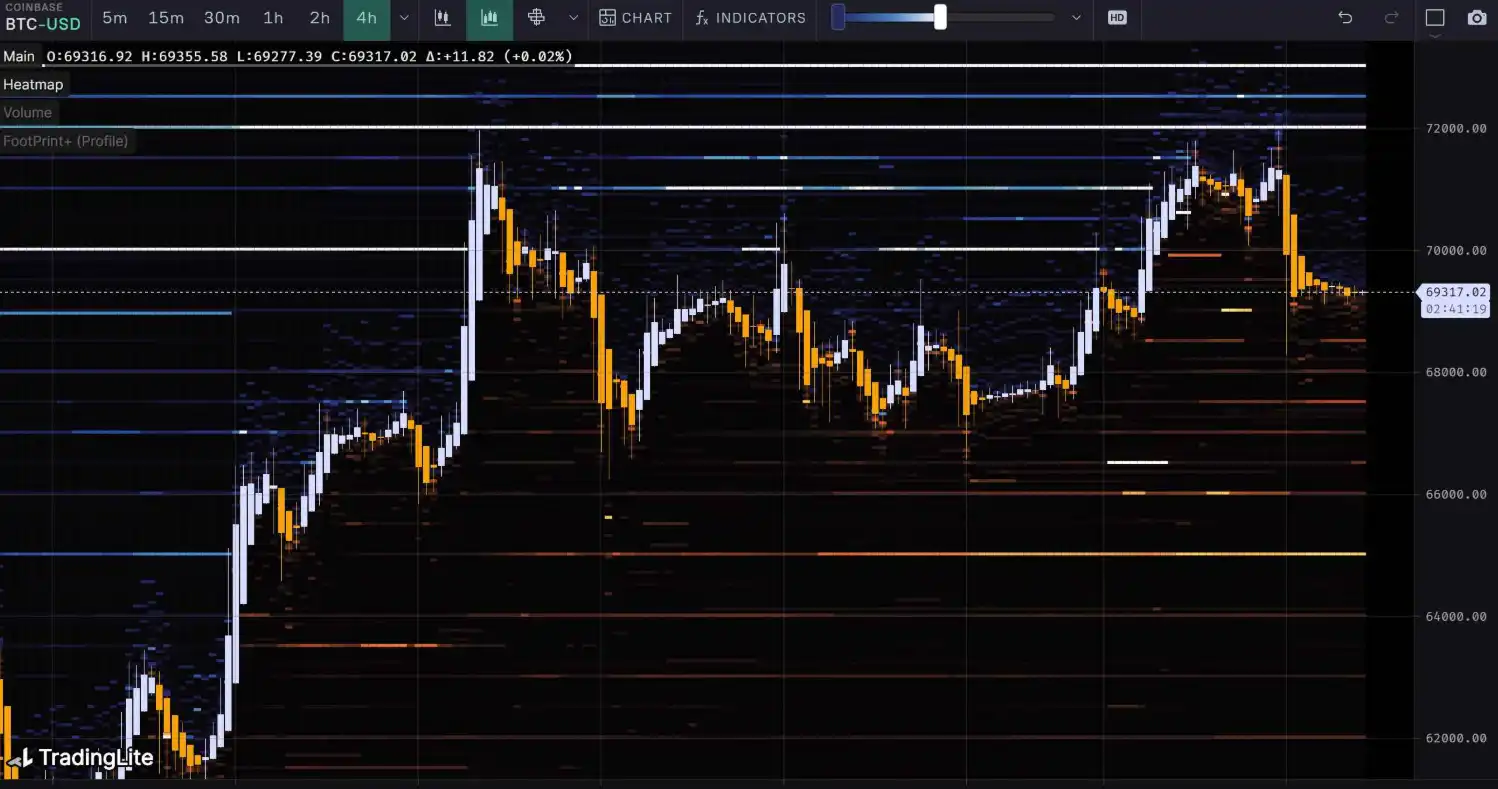
There is a willingness to buy at prices around 65000 and 67500;
There is a willingness to sell at prices around 71000, 72000 and 73000.
(Binance off-chain data in the figure below)
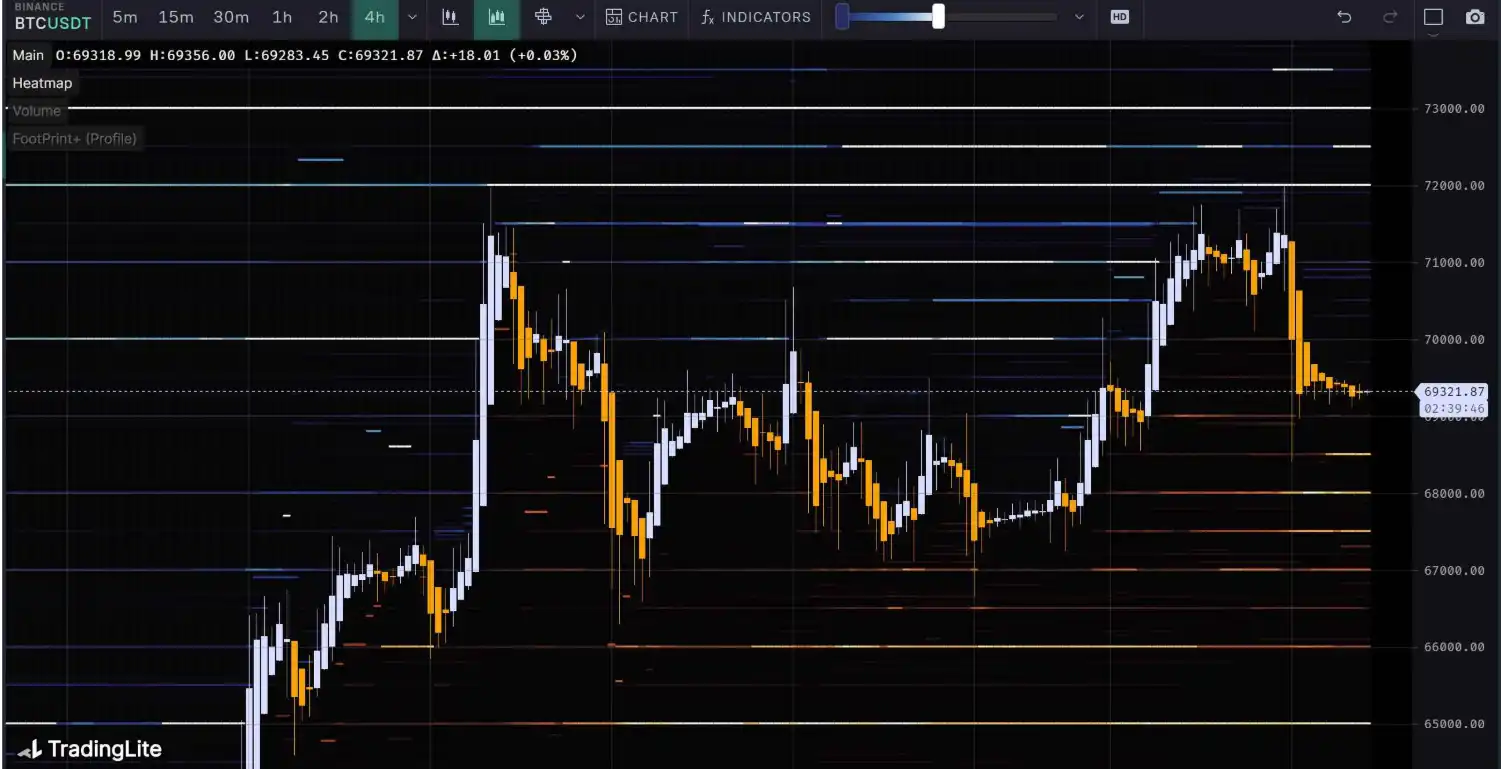
There is willingness to buy at prices around 65000, 66000, 67000, and 68000;
There is a willingness to sell at prices around 71000, 72000 and 73000.
(Bitfinex off-chain data below)
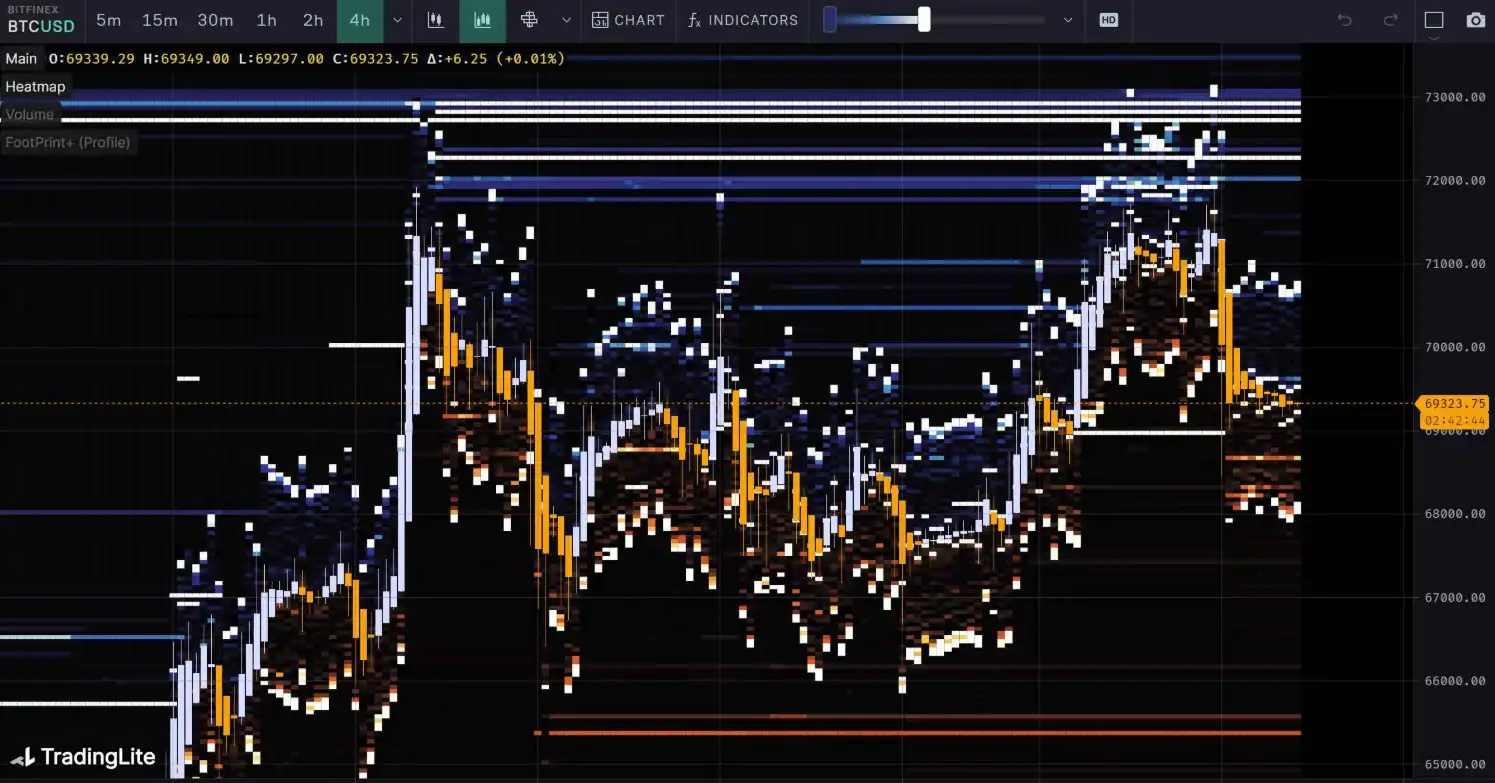
There is a willingness to buy at prices around 65000 and 68500;
There is a willingness to sell at prices around 70000, 71000, 72000 and 73000.
This week’s summary:
Summary of news:
1. The non-farm payrolls data far exceeded expectations, exceeding expectations by only 90,000 people, but at the same time, the unemployment rate unexpectedly rose from 3.9% to 4.0%, the highest level in two years.
2. New employment far exceeded expectations, and the unemployment rate rose instead of falling. This only explains the logic of the data and does not meet expectations.
3. In the past year, native workers lost 668,000 jobs, while immigrants added 934,000 jobs. This is most likely due to the impact of immigration.
4. Therefore, the overall expectation can still maintain a certain degree of optimism. As for the abnormal data, the market needs to react, and all this takes time.
5. When interest rate cuts take place, it may be the climax of the bull market.
6. In the short term, focus on the CPI on June 12.
On-chain long-term insights:
1. The long-term investors around 71,800 made more than double profits, and it became the stage top of the market, and there were multiple callbacks;
2. Large-scale selling on exchanges begins to decline;
3. The accumulation of funds by whale has dropped significantly compared to the beginning of this year, but is still accumulating;
4. US crypto ETFs have shown positive inflows for many days, and the market has once again gained an additional channel for capital inflows rather than pressure.
• Market setting tone:
The selling pressure in the market began to decline and turned back to accumulation, but the degree of accumulation was not strong.
On-chain mid-term exploration:
1. From the perspective of BTC, the market is still in a stock state;
2. Addresses > 10k are accumulating, which may slightly improve the current situation;
3. SOPR is oscillating in the neutral zone;
4. On-chain sentiment remains positive.
• Market setting tone:
Accumulation, stalemate
The accumulation situation in the market has improved, and the rhythm in the market may be relatively stalemate in the inventory environment.
On-chain short-term observations:
1. The risk factor is in the neutral area and the risk is moderate.
2. The number of newly added active addresses is relatively low.
3. Market sentiment status rating: Neutral.
4. The overall net position of the exchange shows a large amount of accumulated outflow, and the selling pressure is relatively low.
5. Global purchasing power has declined slightly, and the purchasing power of stablecoins has rebounded slightly.
6. Off-chain transaction data shows that there is a willingness to buy at the price of 68,000 and a willingness to sell at the price of 71,000.
7. The probability that the price will not fall below 57,000-61,000 in the short term is 90%; the probability that the price will not rise below 71,000-74,000 in the short term is 67%.
• Market setting tone:
The overall market sentiment is in a neutral position, and the short-term holder cost line (short-term strong support) has come to around 63K. In the short term, without external interference, the overall probability of a large-scale short squeeze is still expected to be low, and it is more inclined to fluctuate upward. The probability of a large-scale decline in the market is still extremely low.