Source: Lookonchain
5 indicators to see whether the BTC price has reached the peak of this bull market.
1. Rainbow Picture
The Rainbow Chart is a long-term valuation tool that uses a logarithmic growth curve to predict the potential future price movement of BTC. The Rainbow Chart shows that now is still a good time to buy BTC . https://blockchaincenter.net/en/bitcoin-rainbow-chart/

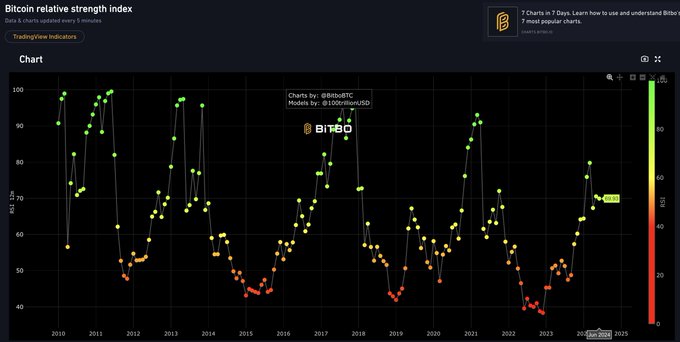
2. Relative Strength Index (RSI) Chart
≥ 70: BTC is overbought and may fall soon.
≤ 30: BTC is oversold and may rise soon.
The current RSI is 69.93. Compared with the previous data, it seems that BTC has not yet reached its peak.
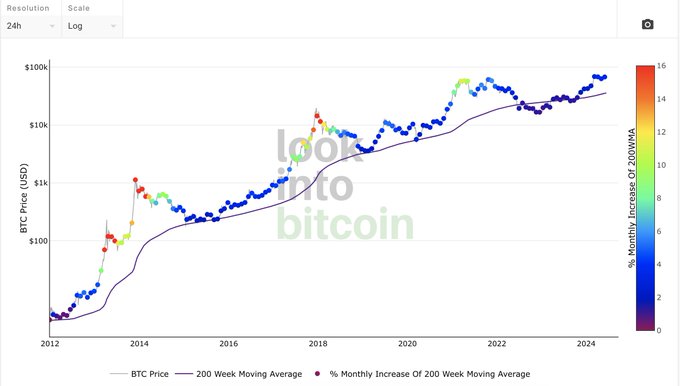
3. 200-week moving average heat map
The 200-week moving average heatmap shows the current price point in blue, which means the price top has not yet been reached and now is the time to hold and buy. https://lookintobitcoin.com/charts/200-week-moving-average-heatmap/
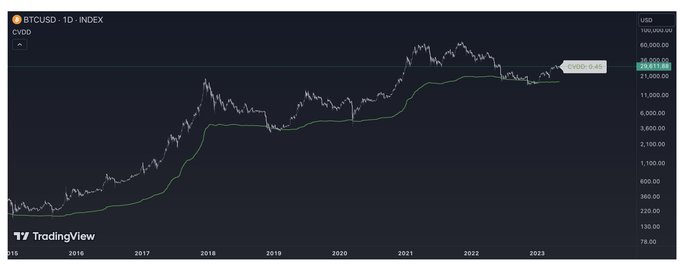
4. Cumulative Destroyed Coin Value (CVDD)
When the BTC price touches the green line, the BTC price is undervalued, which is a good buying opportunity. The current CVDD shows that the top of BTC seems to have not yet been reached. https://tradingview.com/script/3CEPlBsb-Cumulative-Value-Coin-Days-Destroyed/
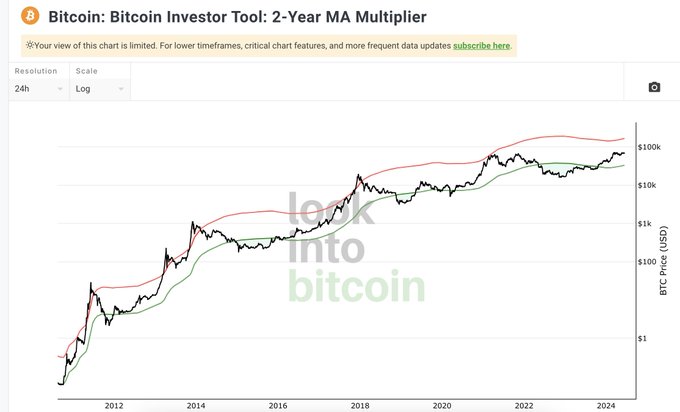
5. 2-year MA multiplier
The 2-year moving average multiplier shows that the price of BTC is in the middle of the red and green lines. It has not yet touched the red line and the market has not yet topped. https://lookintobitcoin.com/charts/bitcoin-investor-tool/