

CPI is lower than expected, interest rate meeting maintains interest rate
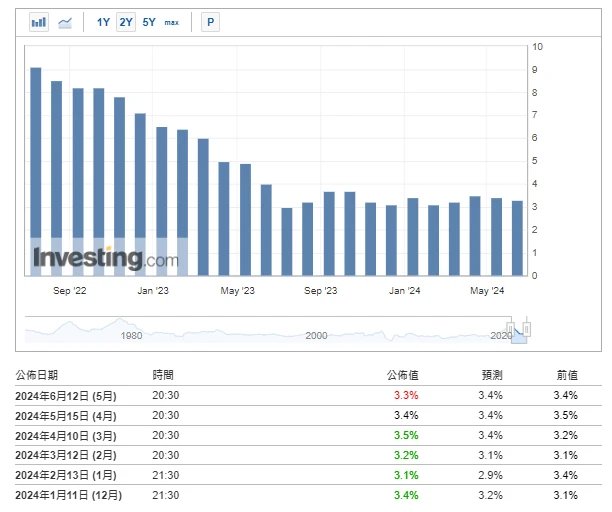
At 20:30 on June 12 (Beijing time), the US CPI was lower than expected. After the data was released, Bitcoin rose from $68,000 to $70,000 in a short period of time, up 3%. After the Fed’s interest rate meeting at 02:00 on June 13 (Beijing time), the price of Bitcoin fell from $70,000 to $67,000, down -4.3%. Chairman Powell clearly released a message at the subsequent press conference: it is very inappropriate to cut interest rates in a short period of time. Only when the Fed sees more encouraging data and is more confident that inflation can sustainably move closer to the 2% target, can interest rate cuts be put on the agenda.
There are about 45 days until the next Federal Reserve interest rate meeting (2024.08.01)
https://hk.investing.com/economic-calendar/interest-rate-decision-168
Market technical and sentiment environment analysis
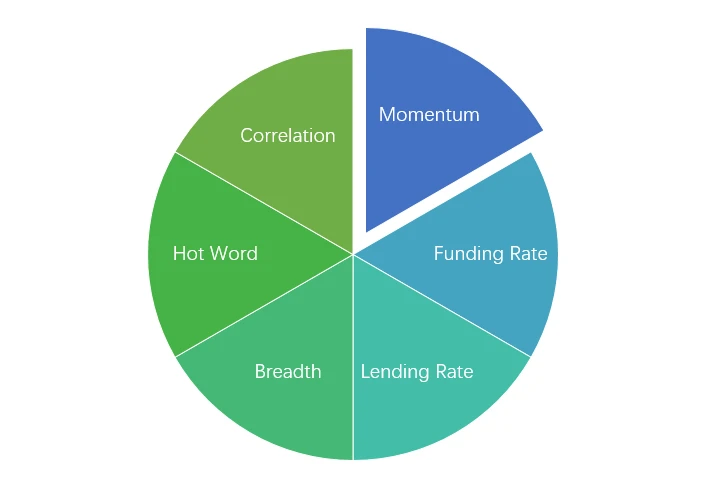
Sentiment Analysis Components

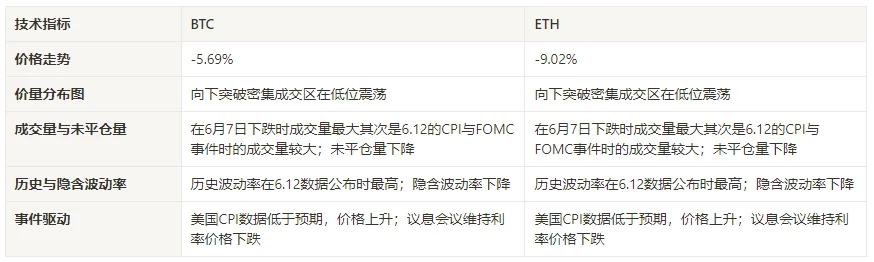
Technical indicators
Price trend
BTC price fell -5.69% and ETH price fell -9.02% in the past week.
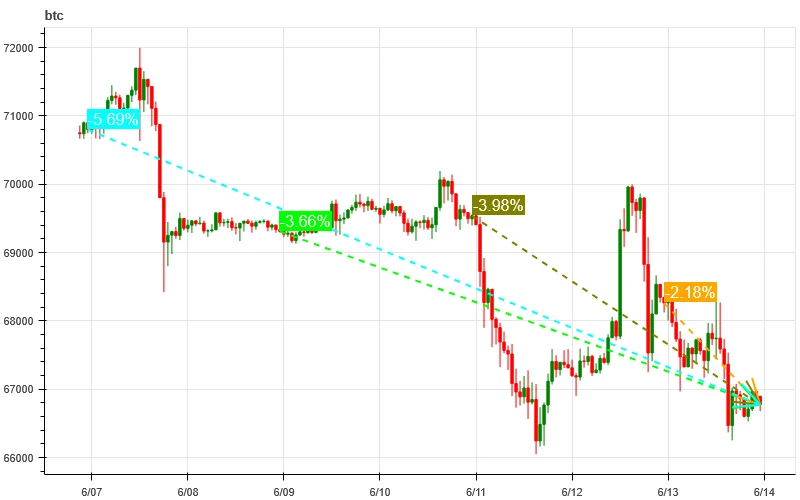
The above picture is the price chart of BTC in the past week.
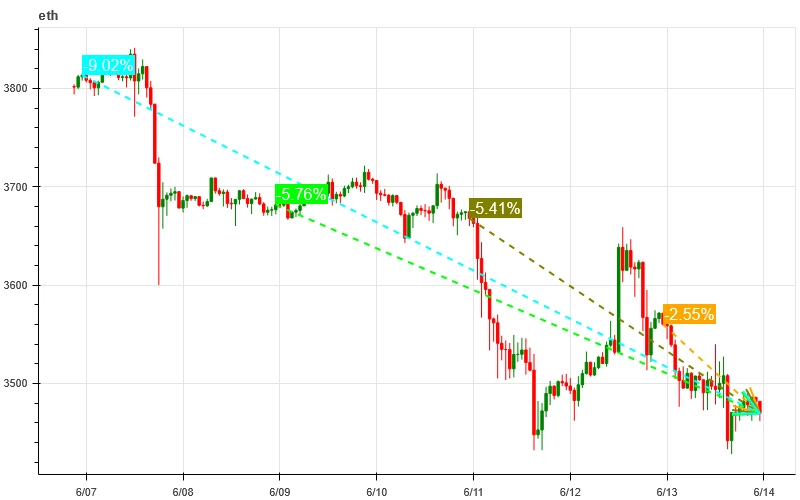
The above picture is the price chart of ETH in the past week.
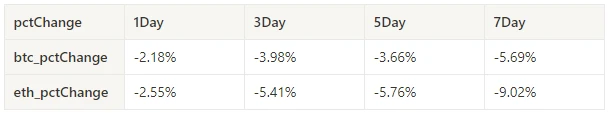
The table shows the price change rate over the past week.
Price Volume Distribution Chart (Support and Resistance)
In the past week, BTC and ETH broke down from the dense trading area and fluctuated at a low level.
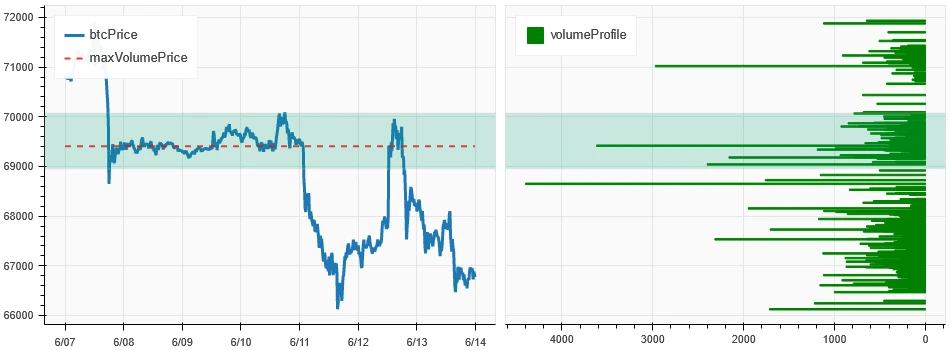
The above picture shows the distribution of BTC's dense trading areas in the past week.
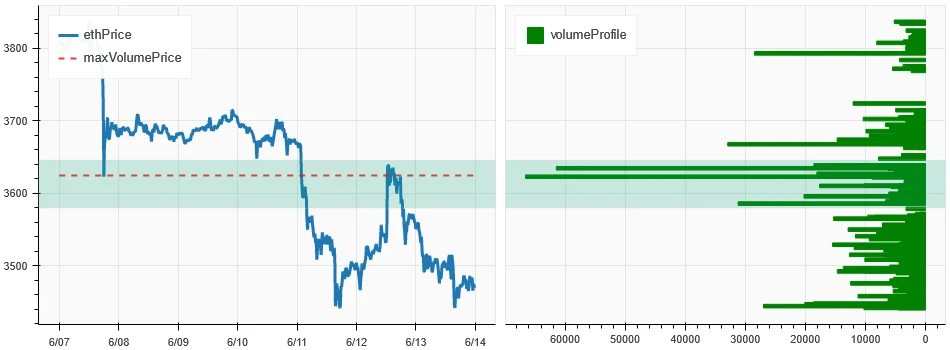
The above picture shows the distribution of ETH's dense trading areas in the past week.
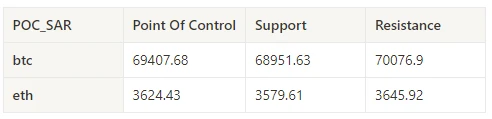
The table shows the weekly intensive trading range of BTC and ETH in the past week.
Volume and Open Interest
In the past week, BTC and ETH had the largest trading volume when they fell on June 7, followed by the CPI and FOMC events on June 12. The open interest of BTC and ETH both decreased.
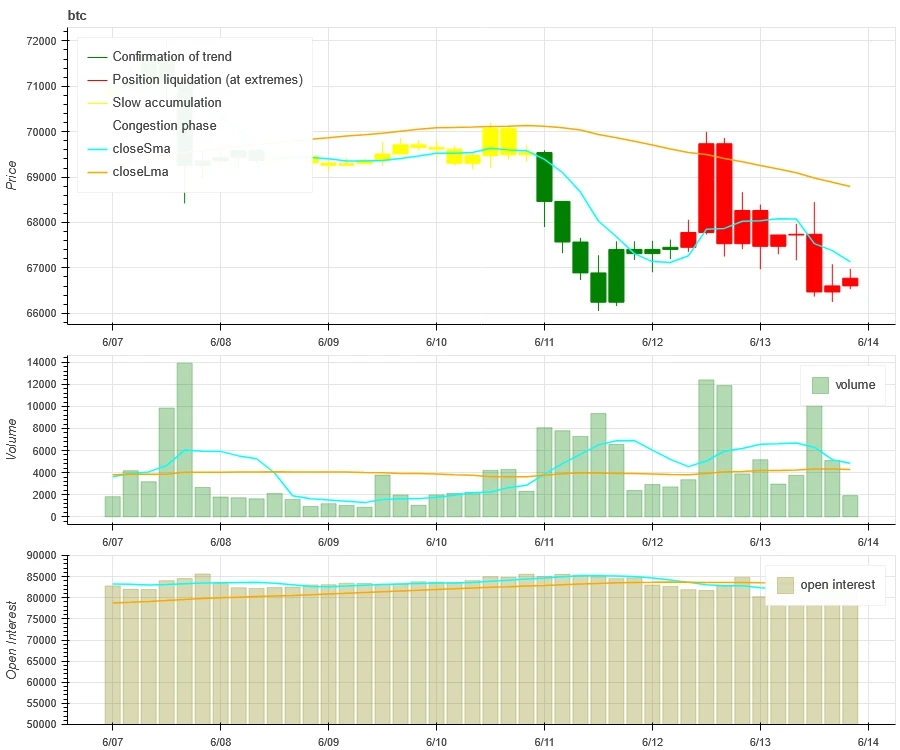
The top of the above picture shows the price trend of BTC, the middle shows the trading volume, the bottom shows the open interest, the light blue is the 1-day average, and the orange is the 7-day average. The color of the K-line represents the current state, green means the price rise is supported by the trading volume, red means closing positions, yellow means slowly accumulating positions, and black means crowded state.
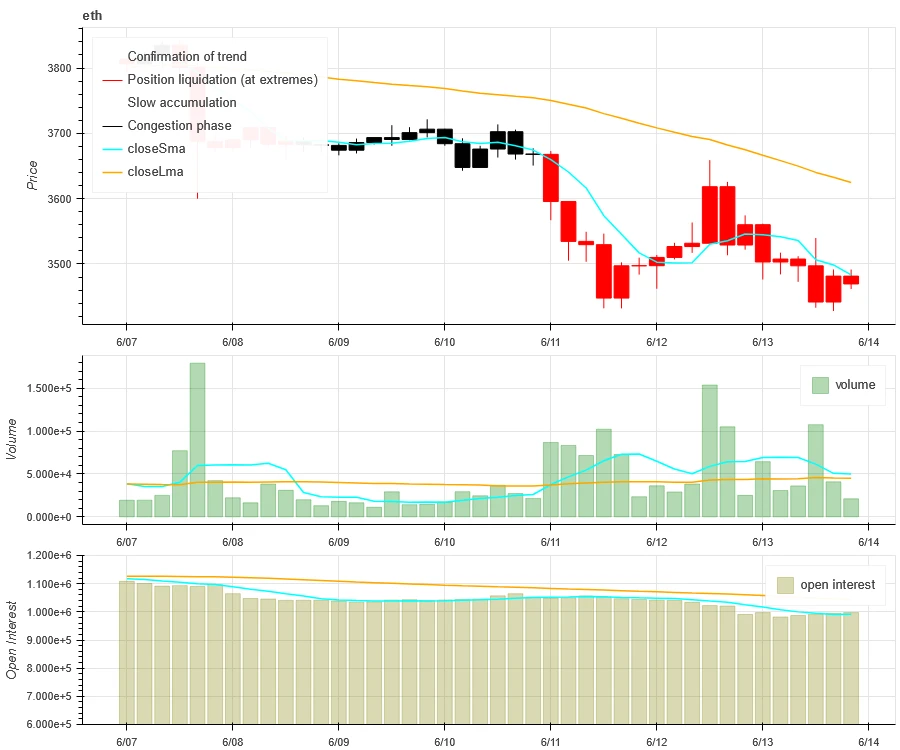
The top of the above picture shows the price trend of ETH, the middle is the trading volume, the bottom is the open interest, the light blue is the 1-day average, and the orange is the 7-day average. The color of the K-line represents the current state, green means the price rise is supported by the trading volume, red is closing positions, yellow is slowly accumulating positions, and black is crowded.
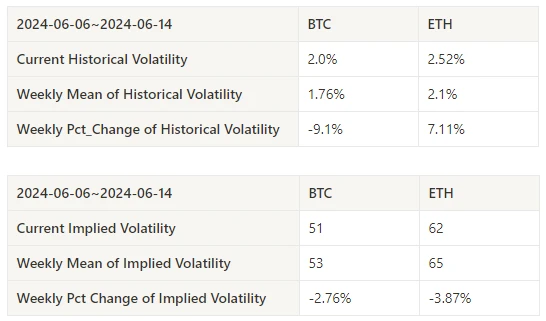
Historical Volatility vs. Implied Volatility
In the past week, the historical volatility of BTC and ETH was the highest when the data was released on June 12; the implied volatility of BTC and ETH has declined.
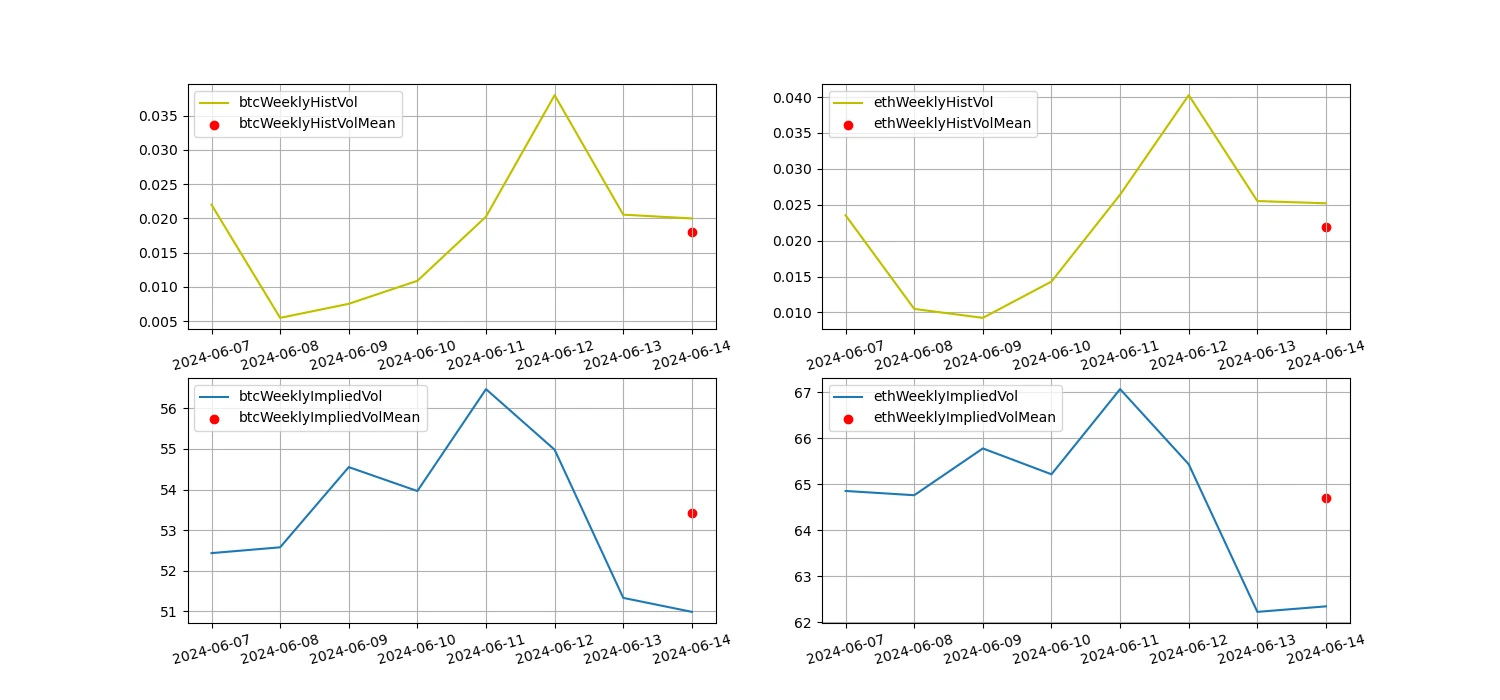
The yellow line is the historical volatility, the blue line is the implied volatility, and the red dot is its 7-day average.
Event-driven
In terms of events, at 20:30 on June 12 (Beijing time), the US CPI was lower than expected. After the data was released, Bitcoin rose from US$68,000 to US$70,000 in a short period of time, an increase of 3%. Subsequently, at 02:00 on June 13 (Beijing time), the Federal Reserve announced that it would maintain interest rates at its interest rate meeting. The price of Bitcoin fell from US$70,000 to US$67,000, a decrease of -4.3%.
Sentiment Indicators
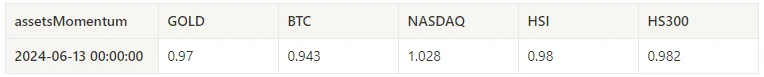
Momentum Sentiment
In the past week, among Bitcoin/Gold/Nasdaq/Hang Seng Index/SSE 300, Nasdaq was the strongest, while Bitcoin performed the worst.
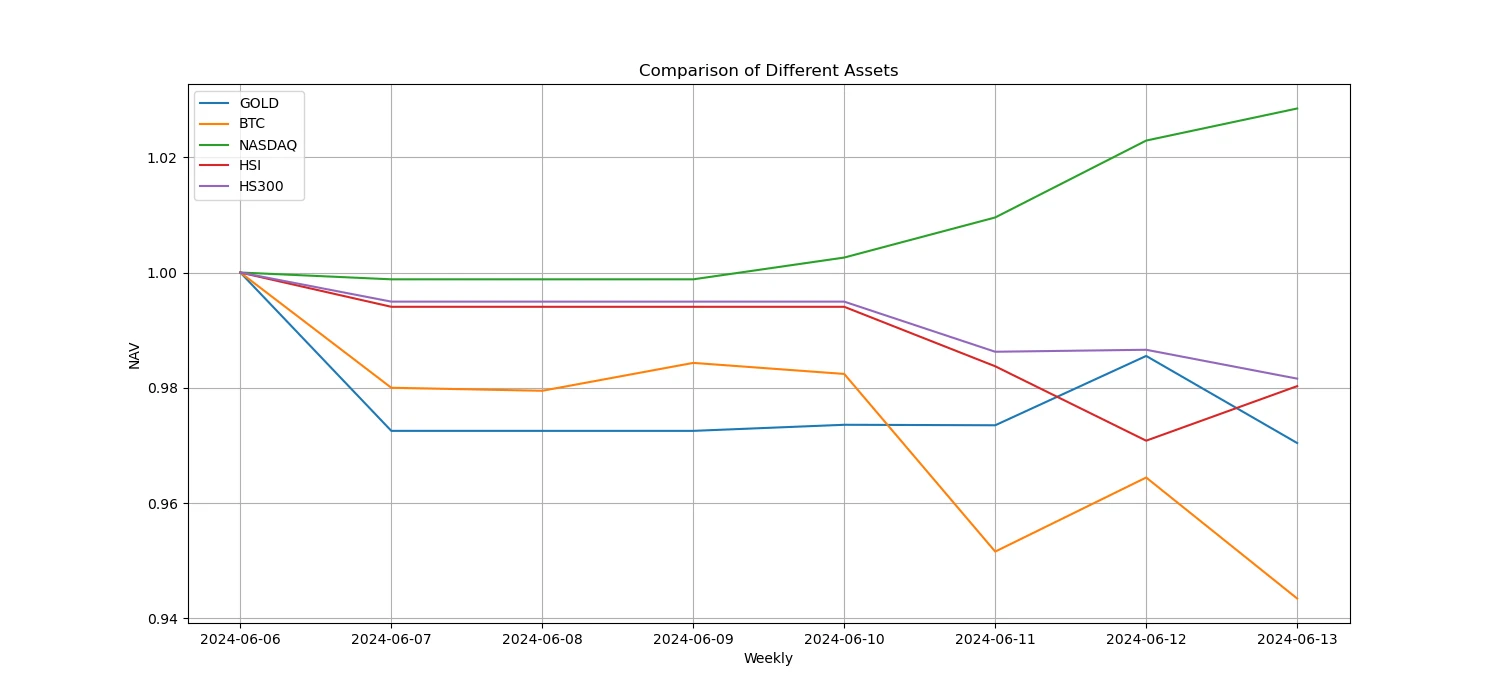
The above picture shows the trend of different assets in the past week.
Lending Rate_Lending Sentiment
The average annualized return on USD lending over the past week was 10.4%, and short-term interest rates rebounded to around 11.2%.
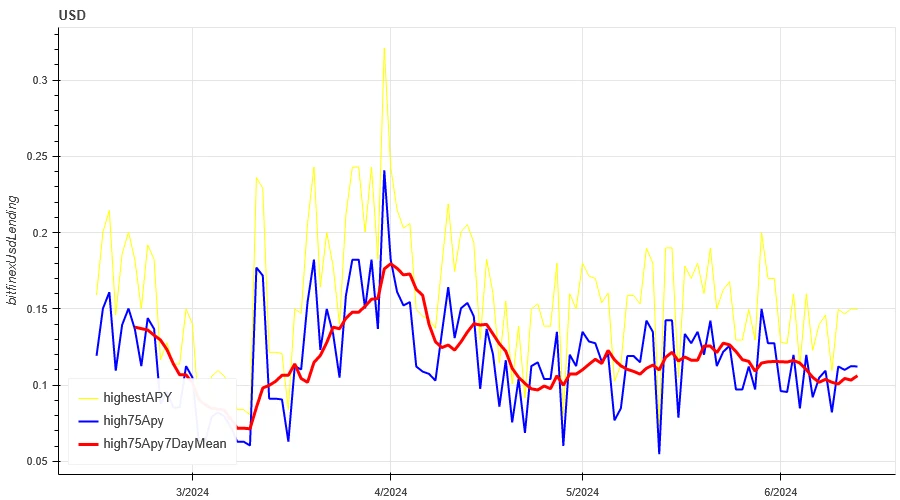
The yellow line is the highest price of USD interest rate, the blue line is 75% of the highest price, and the red line is the 7-day average of 75% of the highest price.
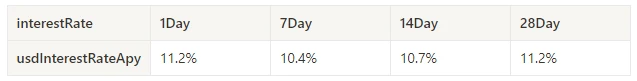
The table shows the average returns of USD interest rates for different holding days in the past
Funding Rate_Contract Leverage Sentiment
The average annualized return on BTC fees in the past week was 11%, and contract leverage sentiment remained at a normal level.
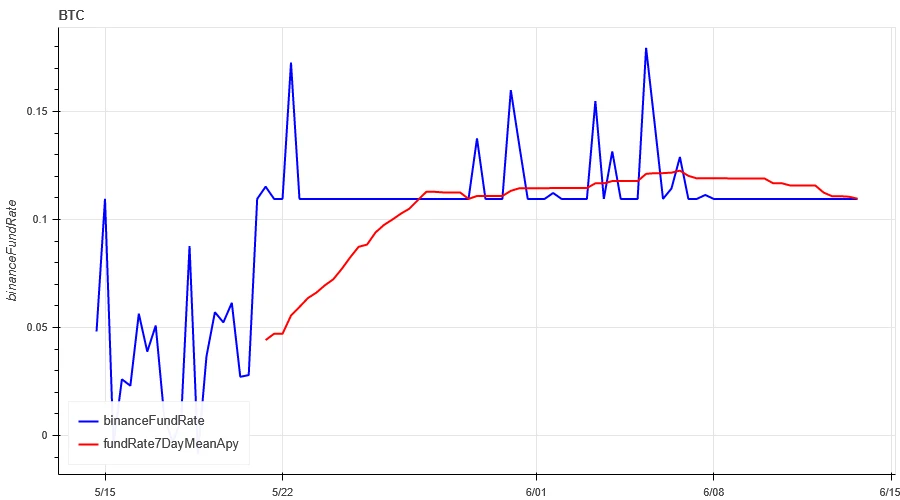
The blue line is the funding rate of BTC on Binance, and the red line is its 7-day average

The table shows the average return of BTC fees for different holding days in the past.
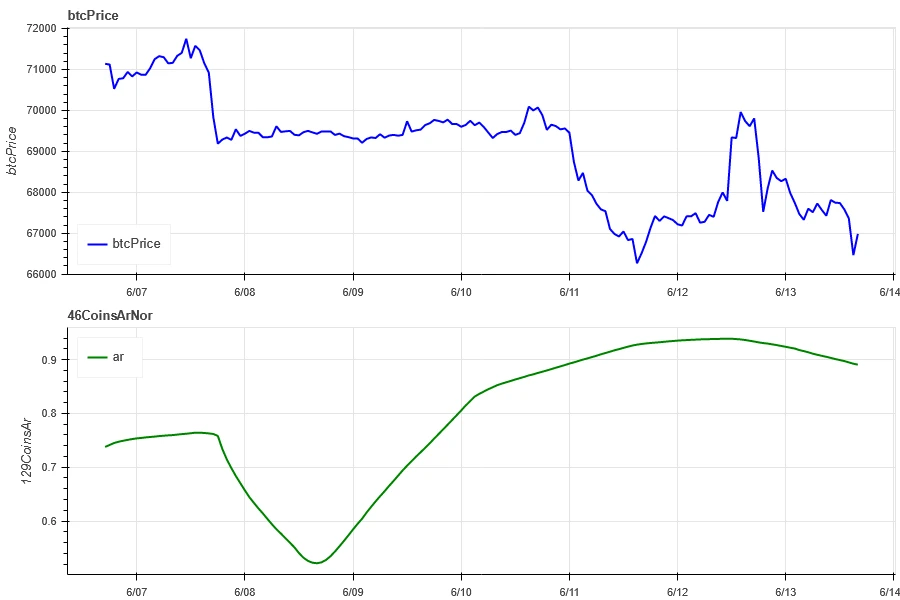
Market Correlation_Consensus Sentiment
The correlation among the 129 coins selected in the past week rose to around 0.9, and the consistency between different varieties was at a high level.
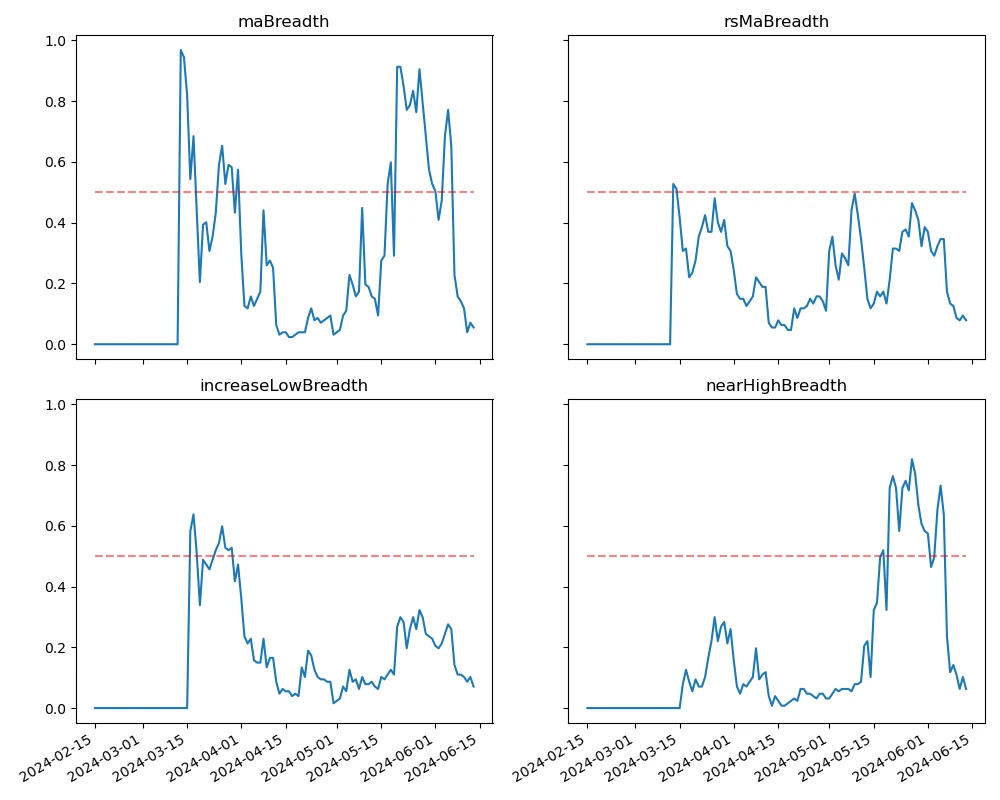
Market Breadth_Overall Sentiment
Among the 129 coins selected in the past week, 5.5% of the coins were priced above the 30-day moving average, 7.8% of the coins were priced above the 30-day moving average relative to BTC, 7% of the coins were more than 20% away from the lowest price in the past 30 days, and 6.3% of the coins were less than 10% away from the highest price in the past 30 days. The market breadth indicator in the past week showed that the overall market was in a downward trend with most coins returning to a downtrend.

Summarize
In the past week, both Bitcoin (BTC) and Ethereum (ETH) experienced two price declines, and volatility reached an all-time high when the data was released on June 12. Bitcoin and Ethereum's trading volume reached its highest level during the decline on June 7, and then there was a large volume when the data was released on June 12. The open interest of Bitcoin and Ethereum has dropped slightly, and the implied volatility has also dropped. In addition, Bitcoin's funding rate remains at an average level, and the market breadth indicator shows that most currencies have returned to a downward trend. In terms of events, the prices of mainstream currencies rose after the release of US CPI data, and then fell again after the Fed's interest rate meeting.


