

Trading activity in the cryptocurrency market decreased this week. During this period, global cryptocurrency market capitalization fell 4%. The top altcoins with rising rates in the third week of June are as follows.
During this period, altcoin market dominance fell by 6%. However, some altcoins, including Ethereum Name Service (ENS), LDO, and PENDLE, still recorded double-digit price increases over the past seven days.
Ethereum Name Service (ENS) led the altcoin market, recording the largest increase.
ENS, the native token that powers the Ethereum Name Service , a decentralized domain name system based on Ethereum, has seen a 20% price increase over the past seven days. It is currently trading at $25.31 .
There was a surge in trading activity during the period under review. In fact, on June 19th, ENS' daily trading volume hit a monthly high of $237 million. The double-digit price rise is partly due to the positive weight sentiment towards altcoins since June 17th. By June 19, it had risen to a 30-day high of 1.21.
An asset's weighted sentiment tracks the overall mood in the market for that asset. This indicator takes into account sentiment and social media discussion volume about the asset. If the weight is positive, market sentiment is bullish.
Confirming the bullish trend, ENS' Relative Strength Index (RSI) and Money Flow Index (MFI) are currently in an upward trend. ENS has an RSI of 59.21 and an MFI of 61.05.
This indicator measures overbought and oversold market conditions by tracking the price movements of an asset. It ranges from 0 to 100, with anything above 70 indicating overbought and in need of a correction, while anything below 30 indicates oversold and a possible rebound.
At current values, ENS's RSI and MFI indicate that buying is significant and continues to outperform selling.
If demand for ENS continues to surge, the price could rise to $27.59.
Read more: Ethereum Name Service (ENS ): Everything you need to know
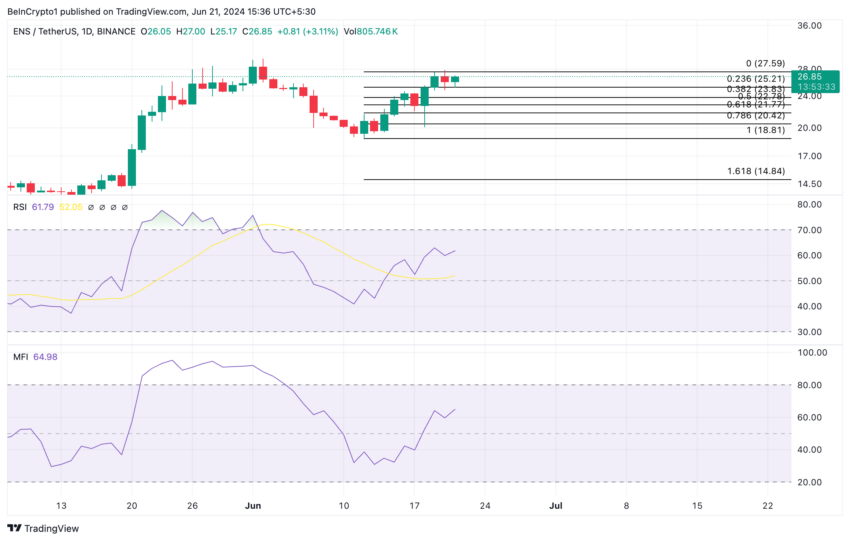
However, at this point, if sellers start making a profit, the token price could drop to $25.21.
Lido (LDO) breaks through major moving averages
LDO, the governance token of Lido Finance, Ethereum's most liquid staking protocol, witnessed a 13% price increase during the week.
Trading activity on LDO has increased over the past few days, with the stock trading well above its 20-day exponential moving average (EMA) (blue) and 50-day small moving average (SMA ) (yellow).
An asset's 20-day EMA tracks its average price over the past 20 trading days, while its 50-day SMA measures its average closing price over the past 50 days.
When an asset is trading above these key moving averages, it indicates a strong upward trend. When an asset is trading above its 20-day EMA, it indicates a short-term upward trend, while when it is trading above its 50-day SMA, it indicates a long-term upward trend.
LDO's Arun rising line confirms the strength of the current uptrend. At press time, the indicator's value is 85.71%.
The Arun indicator for assets measures trend strength and potential price reversal points. If the rising line is at or near 100%, the market's uptrend is strong and the most recent highs have been reached.
If the upward trend continues, LDO could reach $2.41.
Read more: Lido's Stake 11 Best Decentralized Finance Platforms to Profit with Ethereum (stETH)
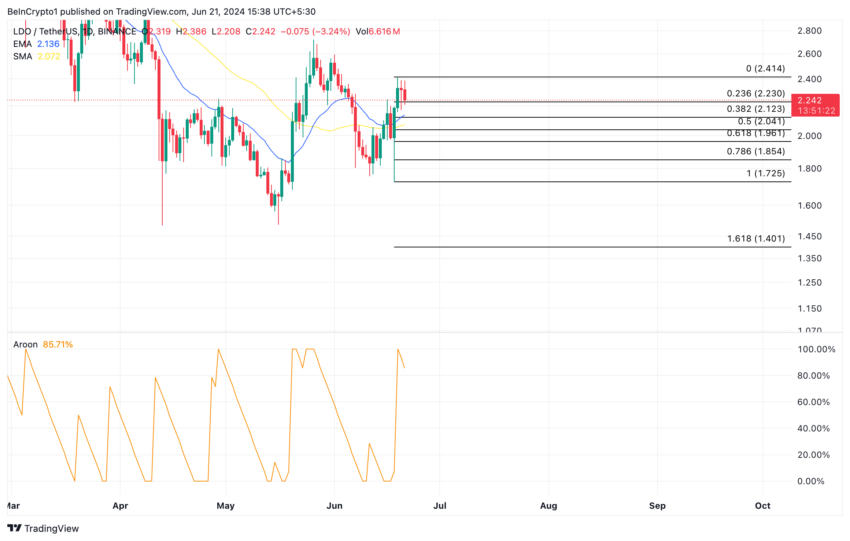
However, if bears reemerge and gain market dominance, the token price could fall to $2.13.
PENDLE holder pocket benefits
Pendle is the governance token of Pendle, a protocol focused on monetization and management on decentralized finance (DeFi) platforms.
Trading at $5.78 at press time, the value of this altcoin has risen 11% in the past seven days. The daily trading volume of the token also surged during the period under review.
According to on-chain data, PENDLE's daily trading volume on June 19 was $121 million, the highest since May 28.
We were able to confirm the bullish bias through the altcoin’s moving average convergence divergence (MACD) figure. The MACD line (blue) rose above the signal line (orange) and rose above the 0 line.
The MACD indicator for an asset tracks price movements and trend strength. When the MACD line crosses above the signal line, it usually indicates increasing upward momentum. When the MACD line rises above the zero line, it confirms a bullish trend in the market. Traders often interpret this to mean that asset prices will continue to rise.
If the pendle trailing sentiment remains strong, the price could rise to $6.19.
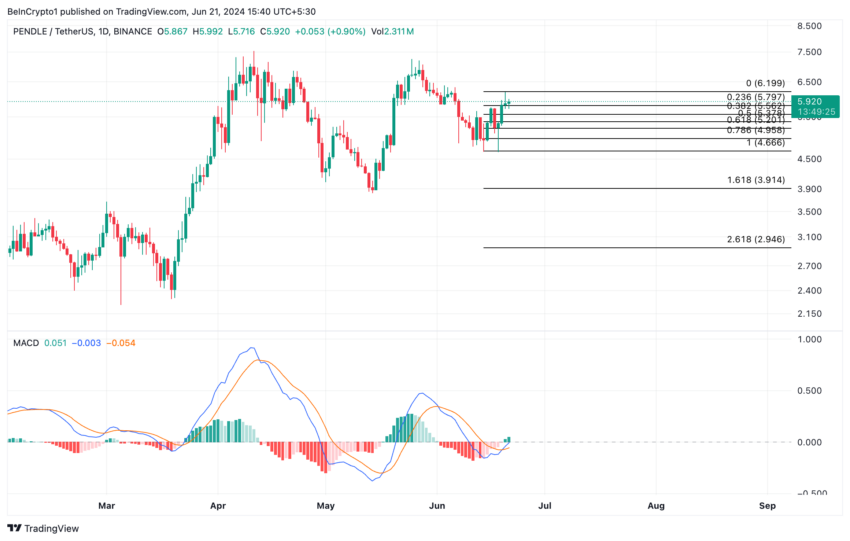
However, if this prediction is invalidated by bearish arguments , the price of PENDLE could fall to $5.79 .


