Over the past week, the price of INJ, the token on which Injective is based, has risen by almost 10%.
While this price rise could indicate a shift in market sentiment from bearish to bullish, key indicators suggest it was driven by speculative buying activity.
Injective traders may soon start selling for profits.
INJ's price-to-daily active address (DAA) divergence indicator suggests that the recent rise in altcoin values may be short-lived.
This indicator compares the price movement of an asset with the change in the number of daily active addresses. Investors use this indicator to track whether price movements are supported by corresponding network activity .
At press time, INJ’s price-DAA divergence is 154.52%. This means that the price of the coin has increased significantly compared to the increase in daily active addresses. There is a 154.52% difference between the price of an altcoin and the daily change in active addresses.
Read more: 9 Cryptocurrencies with the Highest Return on Staking (APY) in 2024
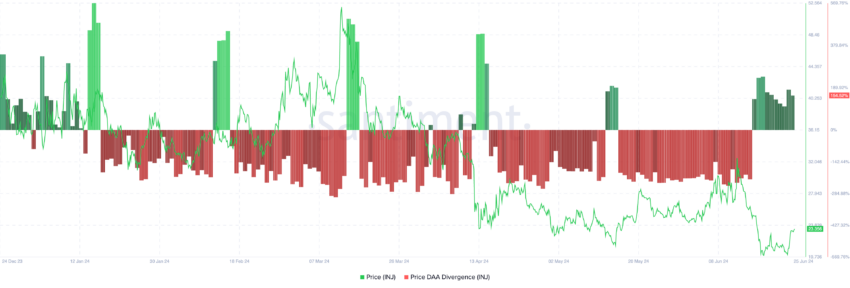
A spike like this in this indicator means that the price of the asset has risen without any increase in network activity. This is a sign that the price rise may have been driven by speculative buying or potential overvaluation.
At this point, traders are known to start taking profit.
INJ’s Market Value to Realized Value (MVRV) ratio confirms that the coin may be overvalued. As of this writing, the value of this indicator is 128.71%.
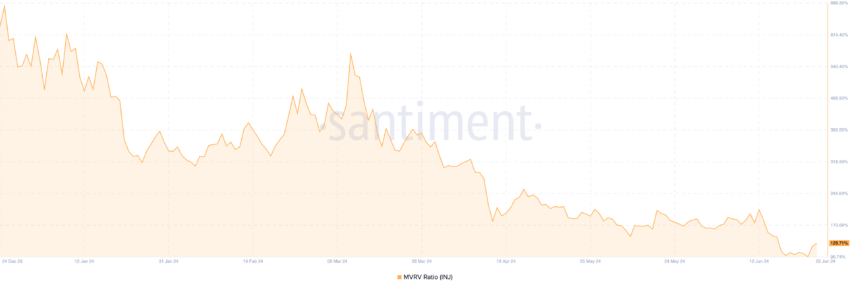
This indicator measures the ratio between the current market price of an asset and the average price at which all coins or tokens were acquired.
If this number is above 1, it means that the current market value of the asset is much higher than the price at which most investors acquired it. This is considered overvalued, and most traders sell for profit at this level .
INJ price prediction: The current upward trend is not strong enough.
Although prices have risen 9% over the past week, bears still dominate the market in INJ. This can be seen, for example, by looking at the directional movement index (DMI) readings.
This indicator measures the strength of an asset's trend. At press time, INJ's negative directional index (red) is 29.40, exceeding the positive index (blue) of 19.83.
When an asset's DMI is set this way, it is a bearish signal indicating that selling pressure is greater than demand for the asset.
INJ's Arun uptrend is at 0%, indicating that the current uptrend is weak. This indicator measures the strength of an asset's trend and identifies potential price reversal points.
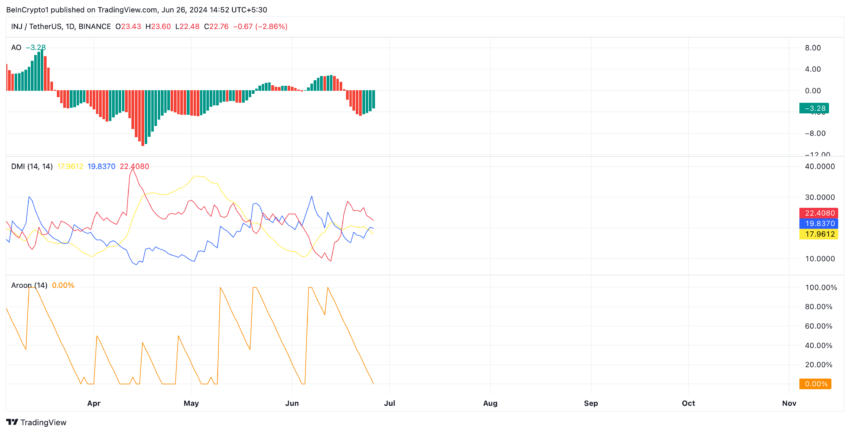
If the Arun ascending line is close to 0, the upward trend is weak and the most recent high was reached a long time ago.
If the speculative buying stops, INJ will lose all its profits and trade at $19.67.
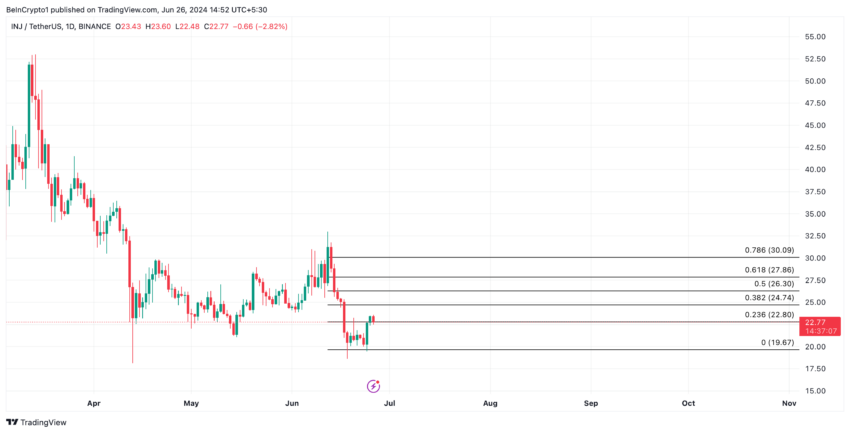
However, if the current trend continues and real demand for the coin starts to increase , it could rise to $22.80 .