Recently, the price of Bitcoin is trying to return to its historical peak. In this article, we will study the contribution of long-term and short-term holders to the market supply and demand during this period. As a supplement to this research, we will also use new segmentation indicators to evaluate the impact of the consumption and investment behaviors of different sub-groups of long-term investors on the market.
Summary
Since Bitcoin hit an all-time high of $73,000 in March, the upward momentum has stalled and the market has been moving sideways accordingly. According to our analysis, the momentum of market demand has turned from positive to negative since the beginning of May.
This article will analyze the cost basis of short-term investors and use it as a basis to analyze how capital flows into the market at the current stage.
To analyze the role of the supply side in the market, this paper examines the investment activities of long-term holders and finds that the unrealized profits held by this group are statistically far below previous historical peaks.
Looking at the behavior of long-term holders selling their Bitcoin assets, it can be seen that although the Bitcoin assets sold by this group of investors only account for 4%-8% of the total market sales, the profits they obtain from selling these Bitcoins usually account for 30%-40% of the accumulated profits during the bull market. This finding highlights the fact that market profits are concentrated on those Bitcoins that are held for a long time, and these profits are gradually realized in the bull market. The rich profits are not disappointing the patience of these "diamond hands" (referring to investors who still firmly hold high-risk assets such as Bitcoin during drastic market fluctuations).
Market demand tracking
In previous analysis, we proposed a method to track the capital flowing into or out of the market, determine the direction of the capital flow in the market and estimate its scale. Here, we will continue to use this method, using the holding time of Bitcoin assets as a measure to subdivide the short-term holder group and continue to deepen our analysis:
When the cost basis of the short-term holder group rises, it indicates that new buyers are purchasing Bitcoin assets at higher prices. At this time, capital is in a state of net inflow into the market (and vice versa).
When the spot price deviates upward (or downward) from the current cost basis, we can approximate the unrealized profit held by each group using the MVRV ratio.
We can use MVRV to measure the incentive for investors to take profits (when MVRV reaches high levels) or to detect signs of seller exhaustion (when MVRV falls to low levels).
First, we compare the spot price to the cost basis of two groups of short-term investors:
Holders who hold Bitcoin assets for between 1 week and 1 month.
Holders who hold Bitcoin assets for between 1 month and 3 months.
This allows us to determine how capital flows and changes from a macro perspective when the market is in the early stages of a bull market and a bear market. The chart below shows how these two price models support the entire market during the bull market in 2023-24.
Since mid-June, the spot price of Bitcoin has fallen below the cost basis of holders who hold the currency for 1 week to 1 month ($68,500), and even below the cost basis of holders who hold the currency for 1 month to 3 months ($66,400). Based on historical experience, if this situation continues, it will cause a blow to investor confidence and may lead to a deeper price correction. And there is no doubt that it will take longer for the market to recover from such a deep correction.
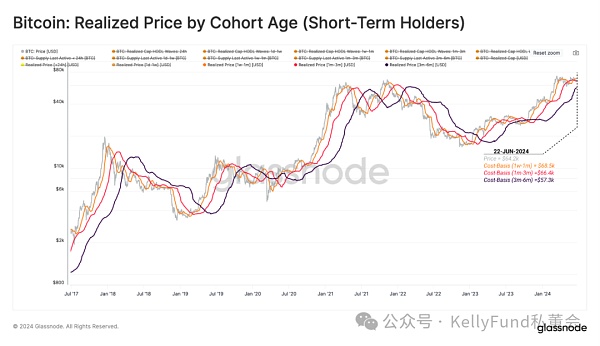
Figure 1: Realized price for short-term holders of different holding periods
We can also describe the current market momentum by comparing the cost basis of these different short-term investor segments. This is shown in the following figure:
Capital Inflow: At this time, the cost basis of short-term holders who hold the currency for 1 week to 1 month is higher than the cost basis of investors who hold the currency for 1 month to 3 months. The positive momentum of the market is very obvious at this time, and the strong market trend is constantly attracting new capital into the market.
Capital outflow: At this time, the market is in the exact opposite situation - the cost basis of the former falls below the cost basis of the latter. This market structure indicates that the momentum on the demand side is weakening and the market is beginning to see a net outflow of capital.
This negative capital flow structure has occurred five times in the previous bull market. In addition, we can see that this structure has been formed since May and has lasted until early June.
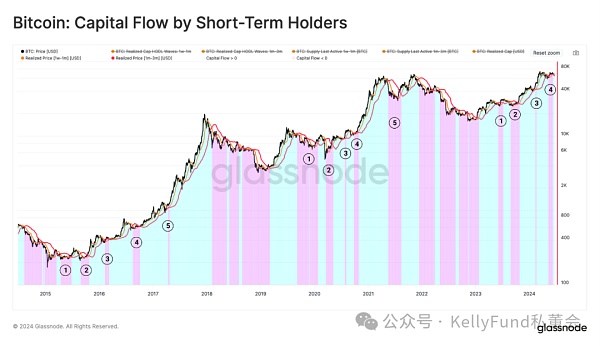
Figure 2: Short-term holders’ fund flows
Market supply side analysis
In order to fully understand the current market, we need to introduce indicators related to the behavior of long-term holders for further analysis. The long-term holder group is the main provider of market supply during the bull market, because they will sell their Bitcoin in the market to seek profit. In a sense, the formation of the top of the market cycle can be partly attributed to the long-term holders who are constantly increasing their efforts to sell Bitcoin, and this scale of selling will eventually exhaust the new demand that has poured into the market during the bull market.
In the chart below, we compare two important metrics: the spot price of Bitcoin and the key multiple of the average cost basis of the long-term holder group (i.e., the realized price of the long-term holder group).
1.0x realized price for the long-term holder group (green line in the figure): In our historical experience, the occurrence of this situation is consistent with the bottom formation stage of the bear market cycle and the market recovery stage.
1.5x long-term holders realized price (orange line in the figure): This price position is often seen as the watershed between the market recovery phase and the long-term market equilibrium phase during the bull market. During this period, although the price of Bitcoin will continue to rise, the rate of increase is very slow. On average, during this stage, the unrealized profit held by long-term holders is about 50%.
3.5 times the realized price of the long-term holder group (red line in the figure): This price is the dividing line between the equilibrium stage and the euphoria stage of the bull market. Once entering this stage, the price of Bitcoin usually rises rapidly. Moreover, in this stage, the unrealized profits held by long-term holders are about 250% or even higher. Under the stimulation of such high profits, long-term holders tend to accelerate the sale of their Bitcoin assets.
If we apply the above framework to the current cycle, we can see that from a macro perspective, the current bull run is very similar to the 2017 cycle. In particular, when Bitcoin price consolidated below the current all-time peak, the market performance was exactly consistent with the watershed between the equilibrium and euphoria phases described by the 3.5x long-term holder group realized price point (shown in red in the figure).
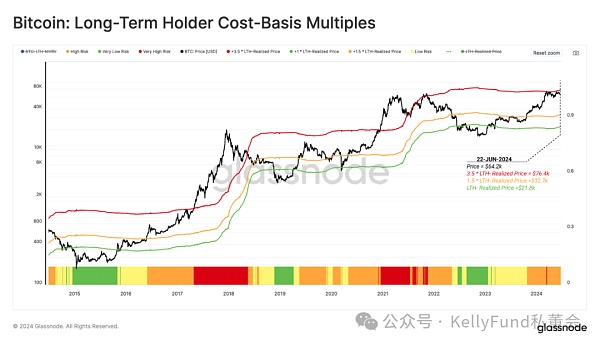
Figure 3: Average cost basis multiple for long-term holders
The unrealized profits held by the long-term holders can be seen as a psychological benchmark to measure whether they are willing enough to sell their Bitcoin assets to seek profit. We can use the LTH-NUPL (Long-term Holder Net Unrealized Profit/Loss) indicator to intuitively show the psychological motivations of long-term holders when making investment decisions.
At the time of writing, LTH-NUPL is 0.66, which indicates that the market is roughly in the "pre-euphoria" phase (shown by the green line in the figure). So far, the Bitcoin market has been in this phase for 96 days, and the market has also been in this phase for such a long time in the 2016-17 cycle.
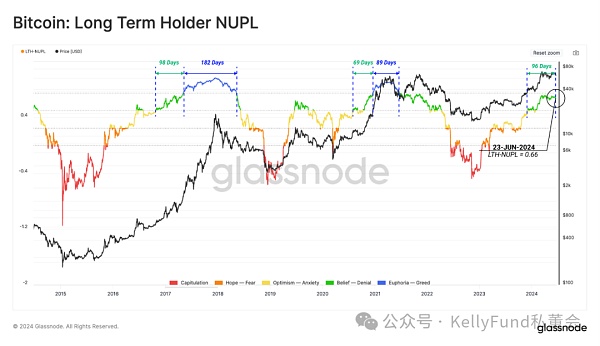
Figure 4: NUPL indicator for long-term holders (LTH-NUPL)
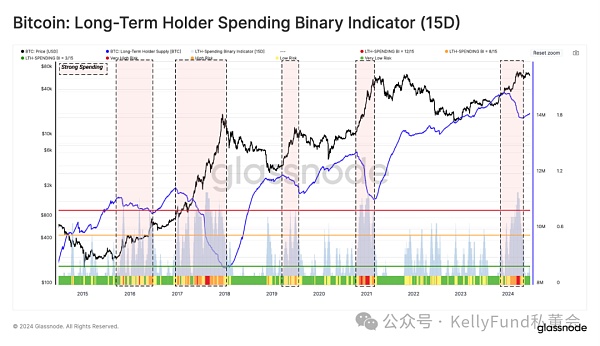
Through the long-term holders' expenditure binary indicator, we can determine the period of time when long-term holders will sell off their Bitcoin assets in large quantities. Undoubtedly, during such a concentrated selling period, the total balance of assets held by long-term holders will drop significantly.
This allows us to identify different stages of long-term holders selling off their assets:
During periods of weak selling, Bitcoin supply from long-term holders has fallen on at least three of the past 15 days.
During a normal sell-off, the supply of Bitcoin from long-term holders has been declining on at least 8 of the past 15 days.
During periods of strong selling, the supply of Bitcoin from long-term holders has been declining for at least 12 of the past 15 days.
Figure 5: Long-term holders’ expenditure binary indicator (last 15 days)
Our next chart aims to combine the two models above to comprehensively evaluate and visualize the sentiment and investment behavior of long-term investors. In the following derivation, we will comprehensively analyze what motivations make them decide to cash in their profits (or losses) and choose to exit, and how they actually operate.
We consider four different motivations that may lead long-term investors to choose to liquidate their assets and exit:
1. Capitulation: This is when the spot price of Bitcoin is below the cost basis of long-term holders. Therefore, any large sales of Bitcoin assets during this phase can be attributed to a collapse in investor confidence and panic selling.
2. Transition: At this time, the spot price is slightly higher than the cost basis of long-term holders, and long-term holders occasionally sell small amounts of Bitcoin assets. Such sporadic sales are generally considered to be typical daily transactions.
3. Balance: When the market recovers from a long bear market, it will reach a new balance between the inflow of small new demand, weakening liquidity, and the gradual profit-taking of underwater holders in the previous cycle. In this stage, large asset sales from long-term holders are usually associated with sudden rebounds or pullbacks in prices.
4. Euphoria: As a sign of this stage, the LTH-MVRV indicator will break through the threshold of 3.5, and it will be consistent with the level of the indicator when the market reached the historical peak of the previous cycle. In this stage, the long-term holder group holds an average of more than 250% unrealized profits, which pushes the market into the euphoric rise stage in one fell swoop, prompting these long-term holders to accelerate the sale of their large Bitcoin assets in order to seek profit-taking.
Using this approach, we can see that the long-term holder group saw large-scale asset sales in both the fourth quarter of 2023 and the first quarter of 2024, which pushed the market higher during this period and then returned to a new equilibrium.
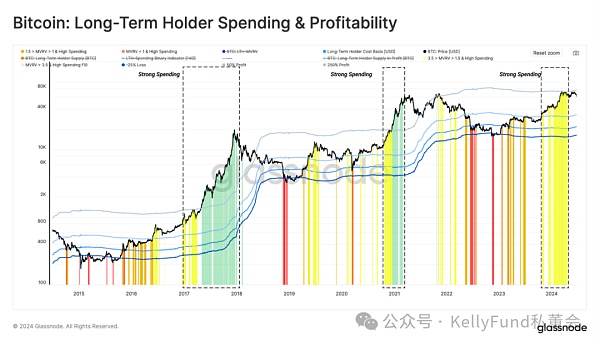
Figure 6: Long-term holders’ selling behavior and resulting gains and losses
Who is influencing sell-side pressure?
The above analysis shows the different logics behind the selling behavior of these investors during the period of declining total supply from long-term holders. In addition, we can also classify and see who among the sub-groups with different holding periods has played a decisive role in the changes in the selling pressure in the market.
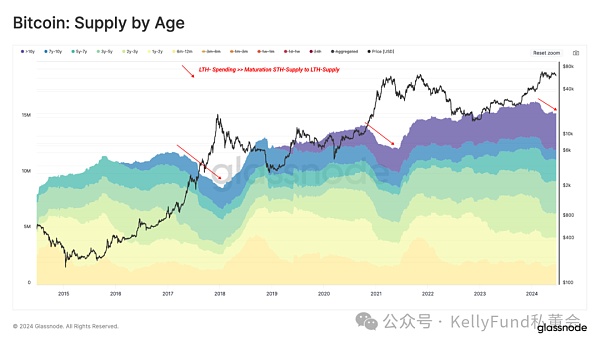
Figure 7: Coin age stratification in the market Bitcoin supply
To disaggregate and assess the extent to which each segment of long-term holders influences Bitcoin spending in the market, we will focus on periods of time when Bitcoin spending in the market was at least one standard deviation above the annual average.
While every investor group experiences occasional bursts of spending, the frequency of high-spending days increases dramatically during the frenzy phase of a bull market, suggesting that long-term holders tend to take profits during periods of rapid price appreciation.
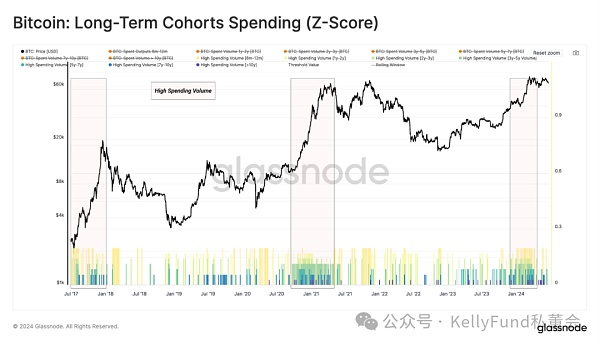
Figure 8: Spending by long-term holders (Z-score)
Considering that only 4%-8% of daily on-chain volume in the current time period is associated with the long-term holder group, we will use another core on-chain metric (realized profit/loss) to analyze their relative weight on the market supply side.
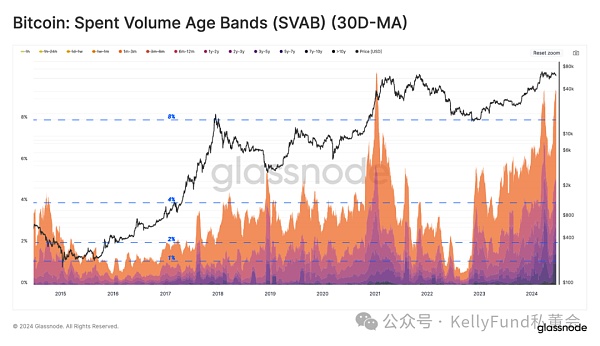
Figure 9: Bitcoin coin age layer (SVAB) by market expenditure (30-day moving average)
The chart below shows the cumulative realized profits of long-term holders during the bull market. We found that profits from long-term holders typically account for 20% to 40% of the total locked profits.
Furthermore, although the trading volume of Bitcoin assets from long-term holders only accounts for 4% to 8% of the total daily trading volume, the profits generated by them can account for up to 40% of investors' profits.
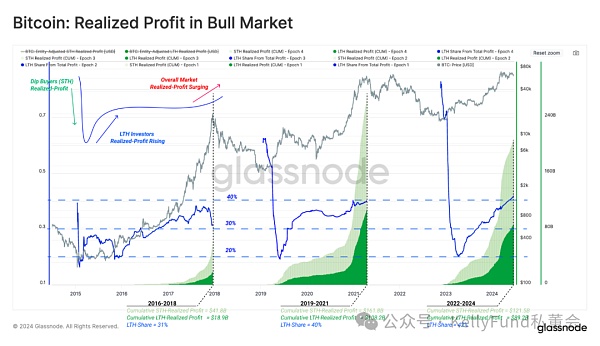
Figure 10: Realized profits in a bull market
Summarize
Since the beginning of March, the market's price action has been mainly sideways. Therefore, we use the cost basis of long-term and short-term holders to assess the current supply and demand in the market.
Based on the changes in the cost basis of short-term investor segments, we built a toolkit to estimate the trend of capital inflows into the Bitcoin network. The results confirm that after the price hit a record high in March, there was a period of net capital outflow (the trend indicator is negative).
We then further segmented the long-term holder group by how long they have held the coins and discussed each of the investor groups separately. The conclusion of this analysis shows that the frequency of high-spending days increases sharply during the euphoric phase of the bull market. Interestingly, although the trading volume from long-term holders only accounts for 4% to 8% of the total daily trading volume, the profits of this group account for 40% of the total profits of investors.