Author: JAY
Compiled by: TechFlow

Bitcoin has been hovering between $60,000 and $70,000 for nearly four months.
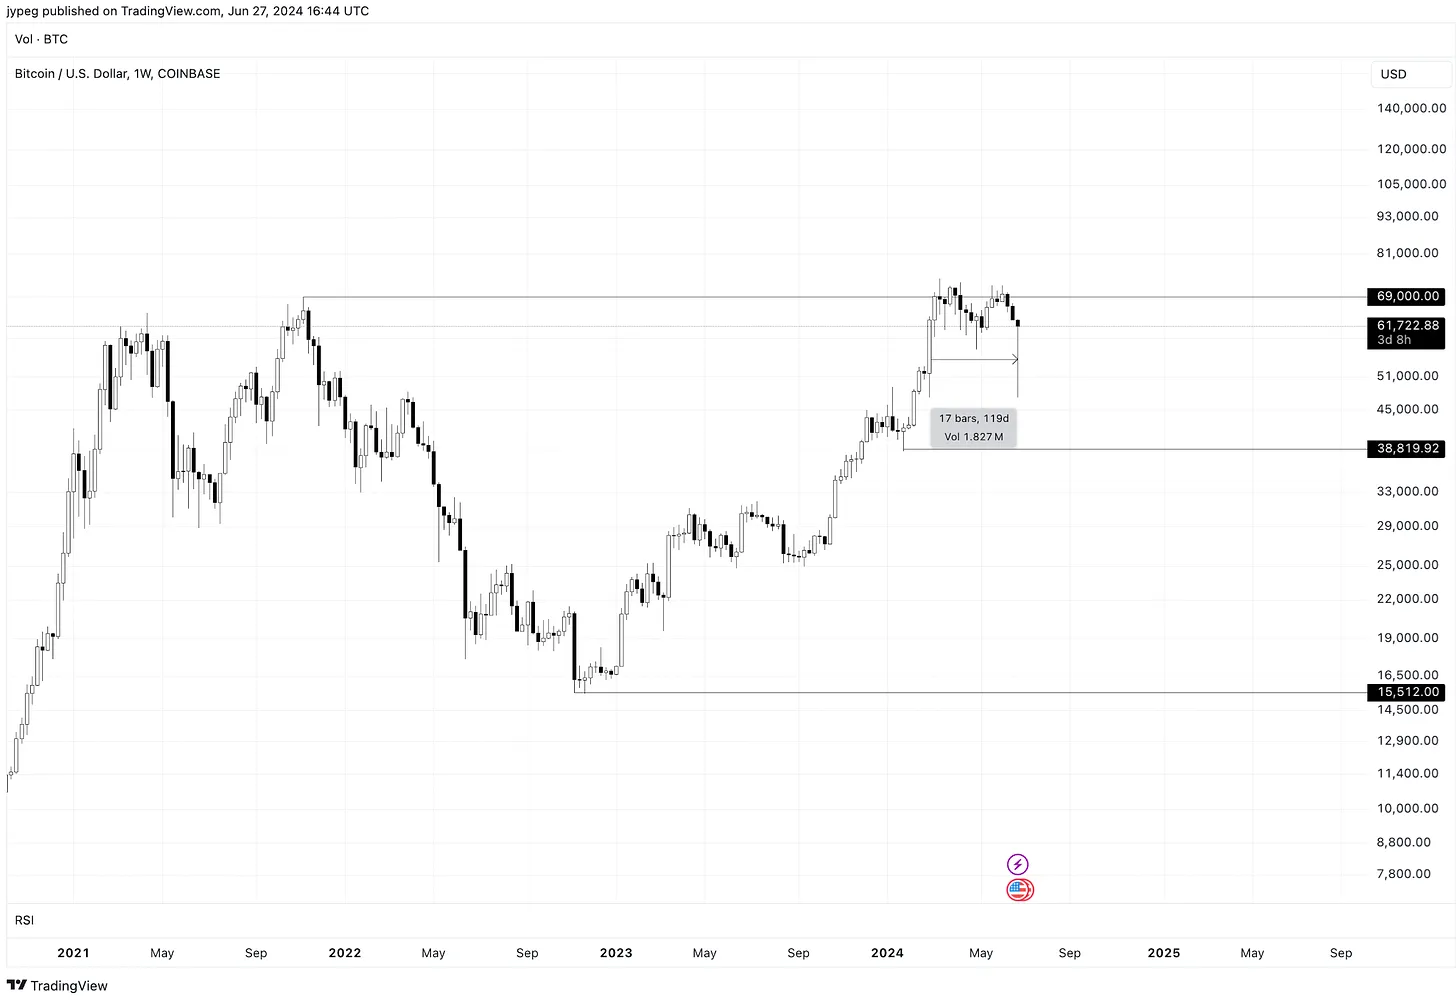
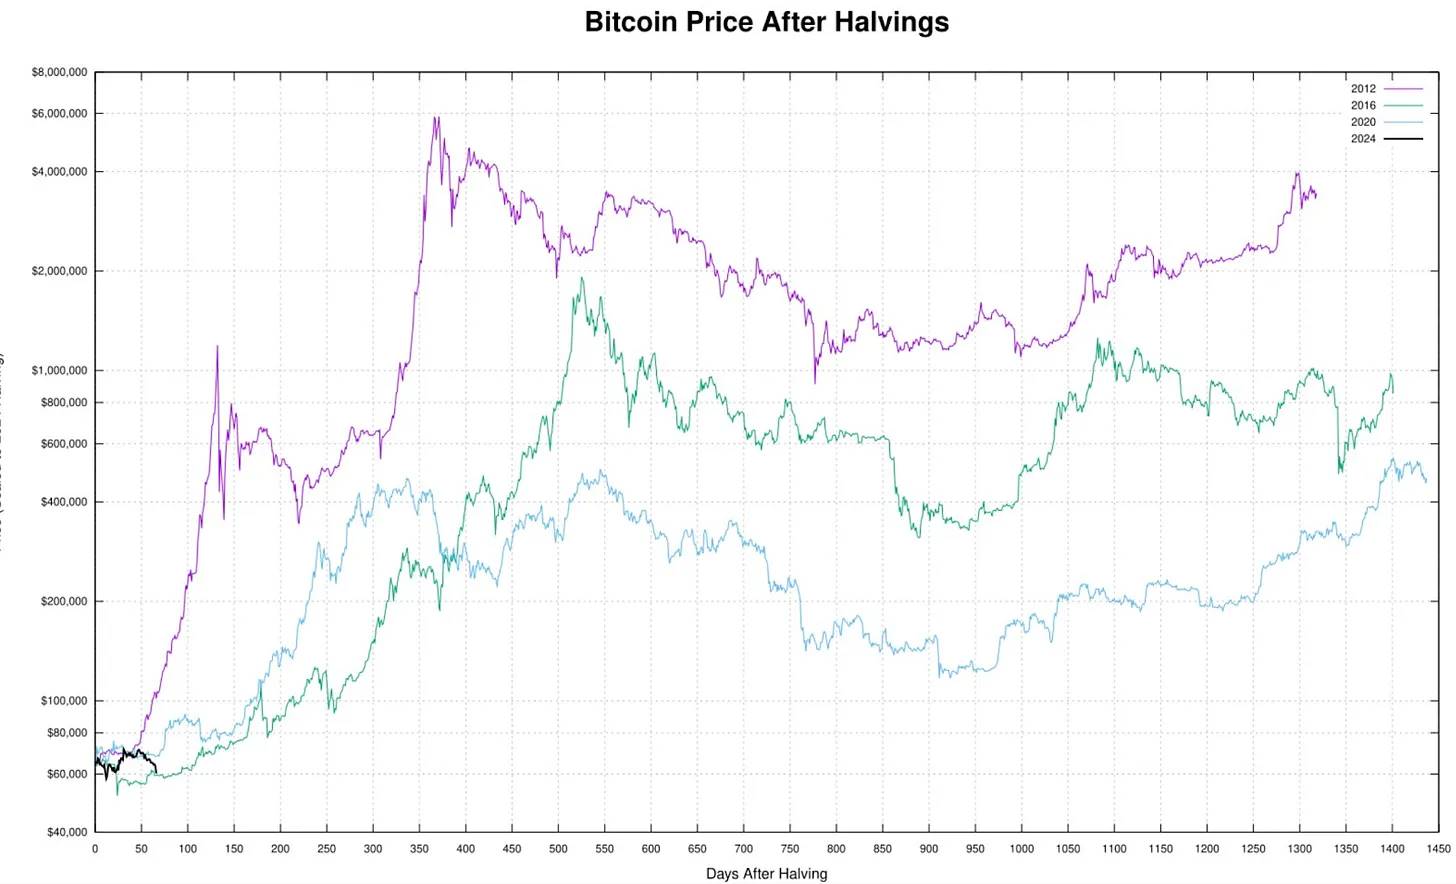
This is frustrating, but not uncommon. Usually after a halving event, we see the market enter a period of downturn. If we look back at the halving cycles in 2016 and 2020, we can see similar consolidation phases before entering the so-called "banana zone", the final parabolic rise phase.
However, we cannot simply be content with “that’s how it was in the past”, but should try to parse current market conditions in order to learn from them and even profit from them.
“What about other cryptocurrencies? What about airdrops? What about the ETH ETF ?”
These issues will be discussed in future articles, and this article focuses on Bitcoin.
On the surface, if one were to try to answer why there is such a large amount of supply around $70,000, the simplest and most obvious answer would probably be:
A large amount of funds entered the market in advance before the halving event;
Miners’ income was halved and they were forced to sell;
(Potential) US tax considerations;
We could list countless reasons, but it makes more sense to look at some objective indicators .
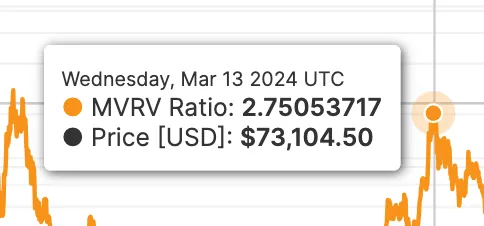
Market Value vs. Realized Value (MVRV)
This is the ratio between the weighted average purchase price of Bitcoin (i.e. the price at the time of the last move) and the current market price. In short, this reflects the unrealized profits of Bitcoin.
MVRV peaked in March at a ratio of 2.75, meaning that when the Bitcoin price was $73,100, the average purchase price was $26,580. While this metric isn’t completely accurate (for example, centralized exchanges may not move tokens but simply update database entries), it typically rises in sync with market price peaks. At some point, people need to take profits, right?
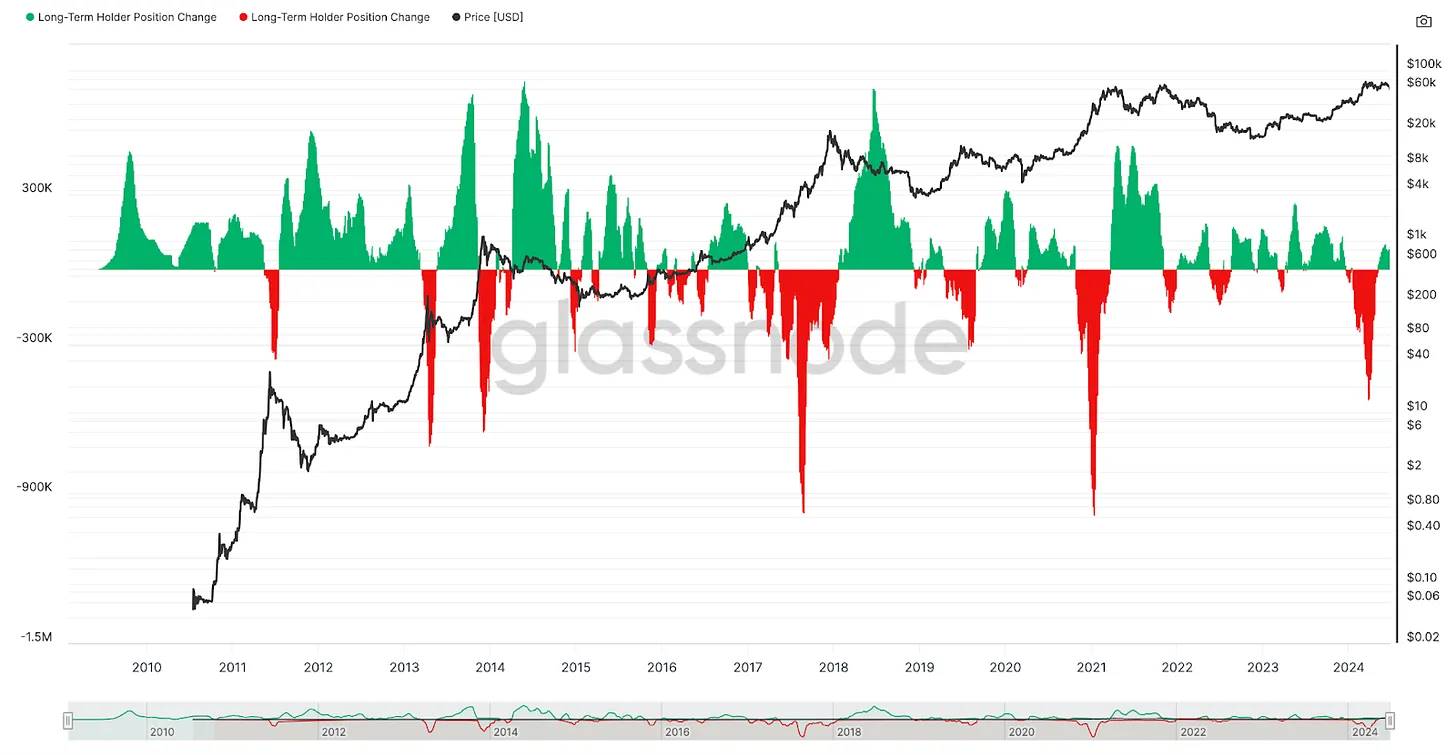
Another interesting indicator is the change in the position of long-term holders, defined as wallets that have held Bitcoin for more than 155 days. Tops are usually formed when these holders finish selling, while bottoms are formed when they start buying. From the end of January to the end of March, it is clear that the selling volume increased sharply. More importantly, they also started buying again.
Finally, given that Bitcoin is priced in U.S. dollars, it is also crucial to look at the dollar supply. How much “money” is flowing in the market? More importantly, is this amount increasing or decreasing? At what speed? Is it accelerating or decelerating?
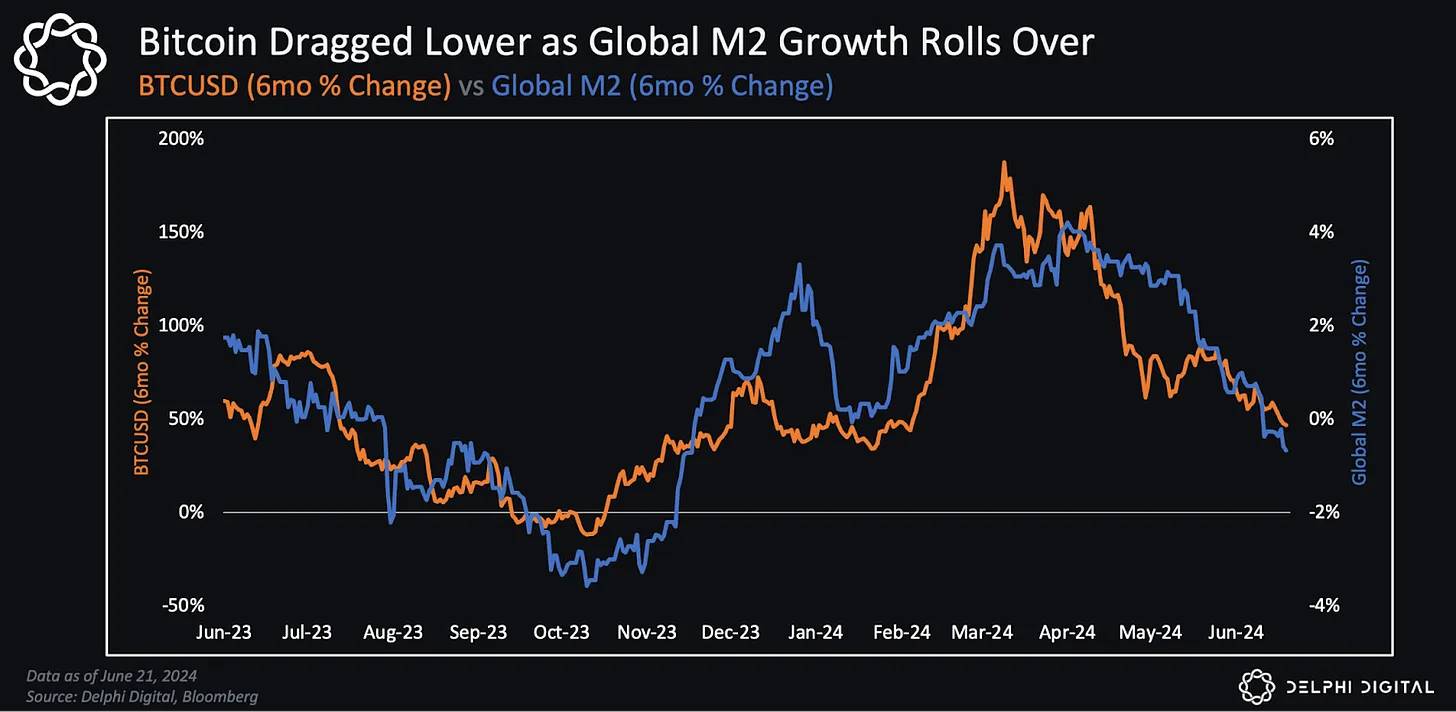
I think this chart says it all - the rate of growth of global M2 (an important factor in global liquidity) has clearly slowed since late March/early April. Markets are forward-looking, and if the outlook for M2 is slowing, markets will expect the dollar to strengthen relative to cryptocurrencies (all else being equal).
In addition, there are many other signals:
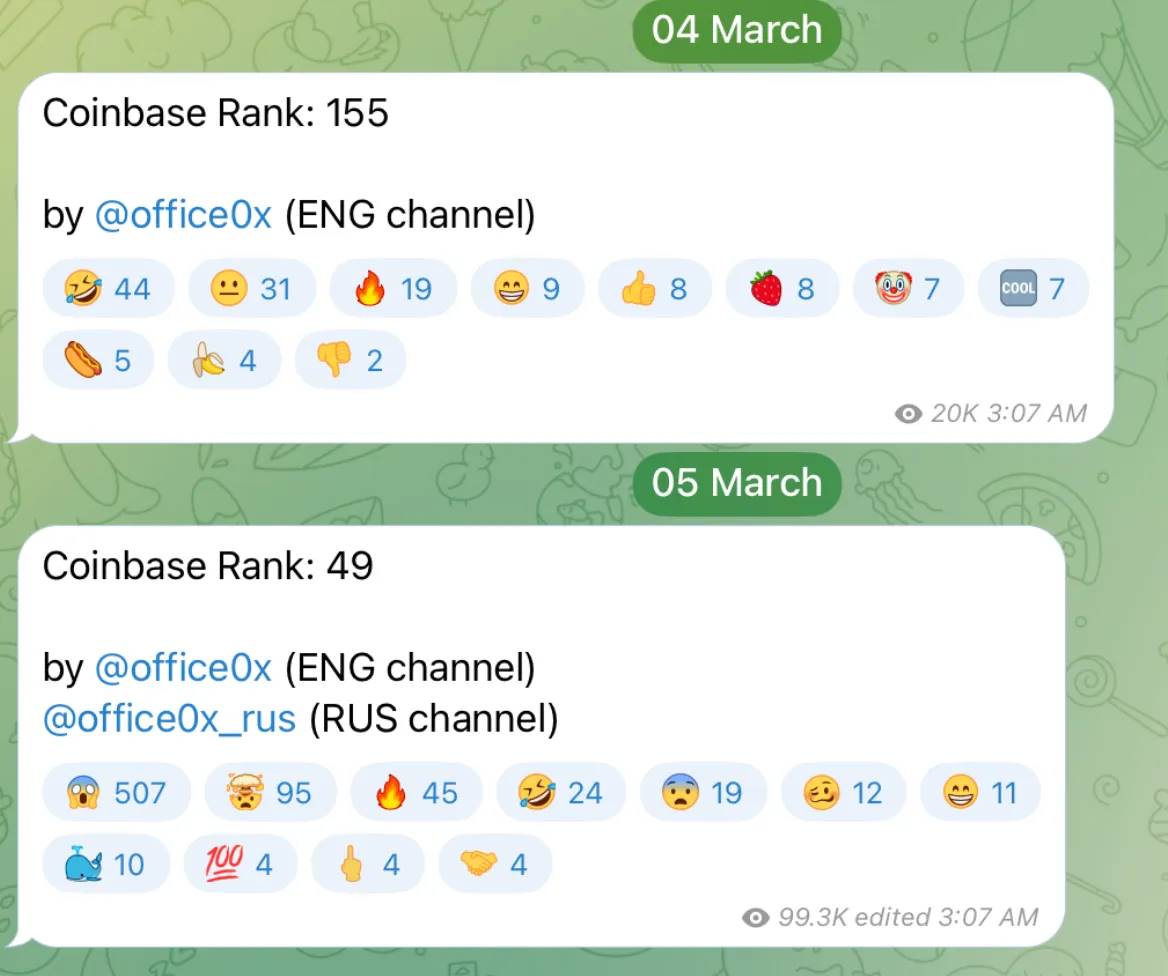
Coinbase jumped 106 spots in one day (they got a ton of app downloads).
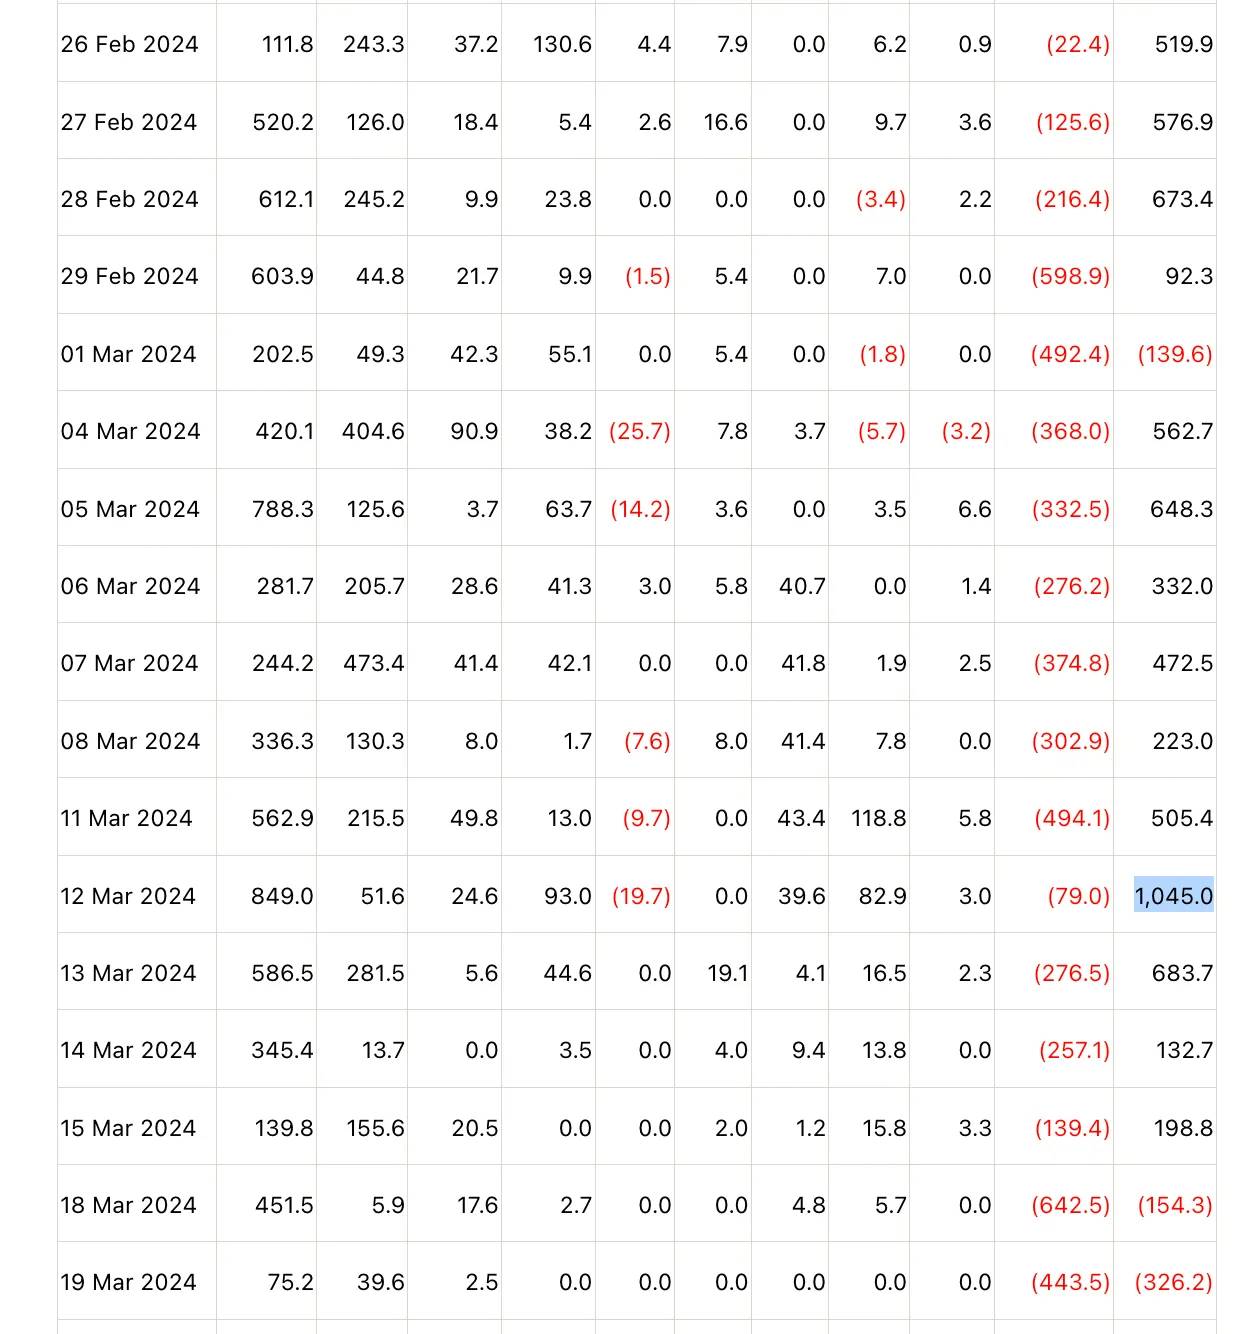
Bitcoin ETF inflows peaked at $1.045 billion before slowing dramatically.
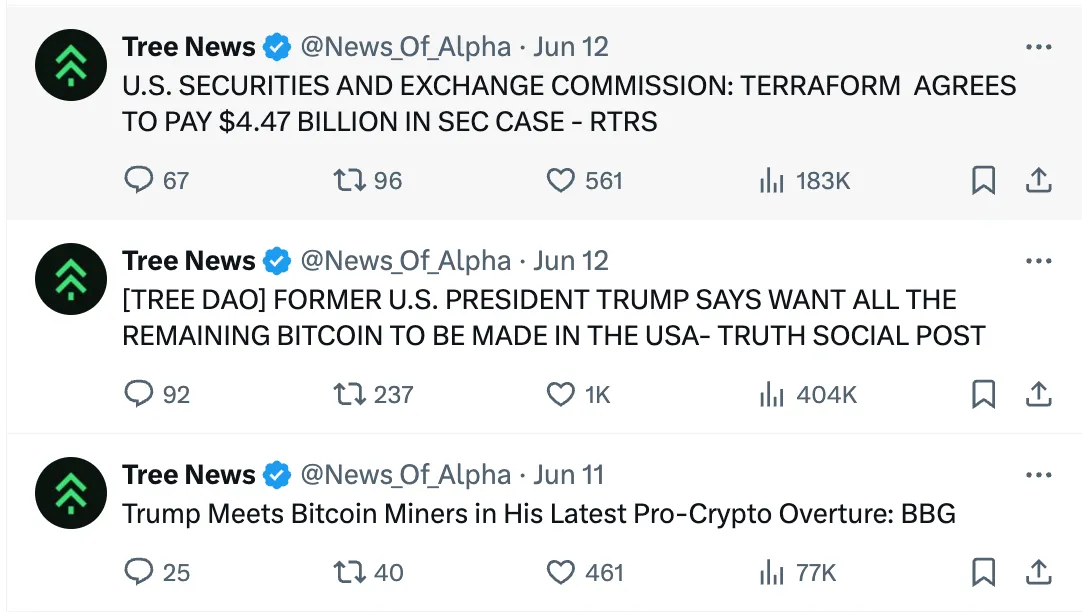
Lots of very positive regulatory news but increasingly weak price follow-through.
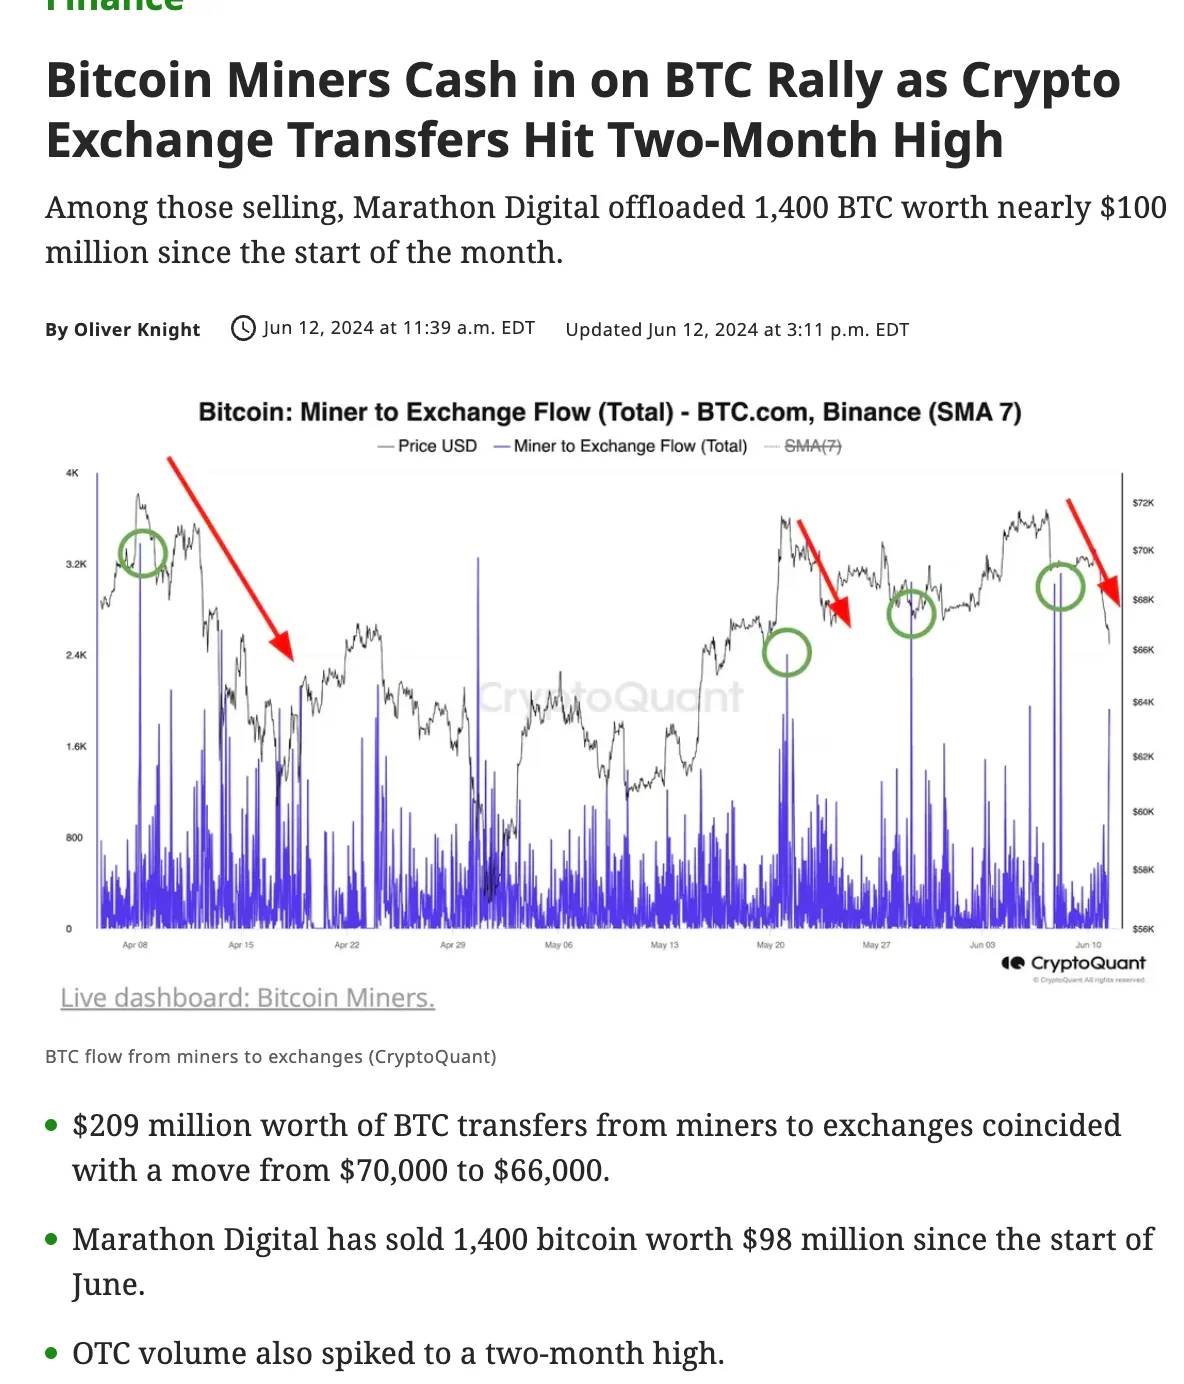
Miners actively sold during the post-halving downturn.
It is always difficult to sell at tops (including local tops) because they tend to last longer (or shorter) than we expect and emotions make it difficult to remain objective. In addition, the market can sway us and we can be cautious at the beginning of the breakout, then envy those who are making more than us (buying memes, increasing leverage), and finally try to copy and "catch up" until the end.
The good news is that I don’t think this is a cycle top (if the concept of a cycle top still exists given factors like ETFs ). As I mentioned at the beginning, I think this is fairly typical in the weeks and months following the halving. Each cycle is obviously different, but I think the basic principles are roughly the same:
There can only be so much unrealized profit in the system;
Selling by long-term holders forms tops (buying forms bottoms);
The rate at which the supply of dollars increases or decreases;
These factors will manifest themselves in different ways depending on the positioning of the participants.
I think this is unlikely to be a cycle top. While it is hard to say exactly when we will move higher again, I think we are closer to breaking out of this range (hopefully to the upside) than the beginning.
Welcome to TechFlow TechFlow official community
Telegram subscription group:
Official Twitter account:
Twitter English account: