

Bitcoin (BTC) price had a somewhat disappointing week, but Ethereum (ETH) followed BTC's lead and managed to recover slightly. On the other hand, the price of Ripple (XRP) has not only failed to recover but is facing further decline.
Bitcoin price stabilization.
Bitcoin's price fell 6% over the weekend, falling from $64,000 to $60,400. The cryptocurrency asset fell below nearly $60,000 before recovering over the course of the week.
Currently, BTC is trading at $61,525, showing some signs of recovery and could continue to rise further. This is because Bitcoin has reached oversold territory according to the Relative Strength Index (RSI).
The Relative Strength Index (RSI) is a momentum metric that measures the speed and change in price movements. It ranges from 0 to 100, with values above 70 indicating overbought conditions and values below 30 indicating oversold conditions.
A recovery is likely from here, and BTC could regain support at $63,068 over the weekend.
Read more: Bitcoin Halving History : Everything you need to know
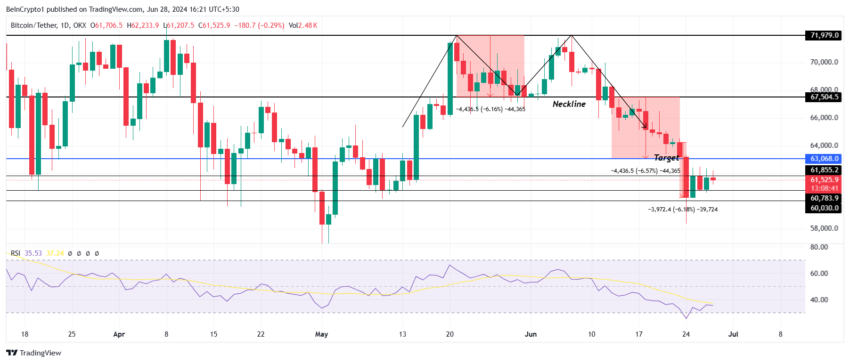
If this does not happen and it falls again, there is a possibility that it may fall to $60,000.
Ethereum begins recovery
Ethereum price has rebounded from the 38.2% Fibonacci retracement level and is trading at $3,445 at the time of writing. Ethereum is on the verge of turning $3,459 back into support, which could help the second-generation cryptocurrency push towards the 50% Fibonacci line.
The MACD also supports a potential bullish outcome as the red bar continues to retreat. Moving Average Convergence Divergence (MACD) is a trend-following momentum indicator that shows the relationship between two moving averages of a security's price.
You can confirm the start of a rally when this indicator hits a bullish crossover.
Read more: How to invest in Ethereum ETF?
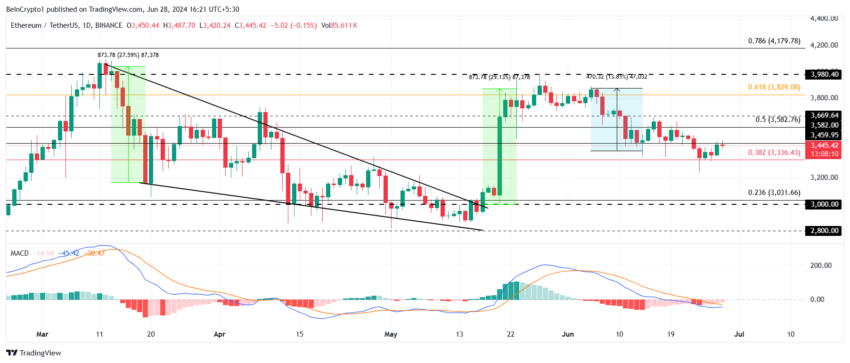
However, if BTC falls and Ethereum follows in its footsteps, it could fall below the 38.2% Fibonacci line. If this happens, the altcoin could fall to $3,200.
XRP price will not recover
XRP price continues to decline on the daily chart after failing to form an ascending triangle pattern. As of this writing, the altcoin is trading at $0.4800 and hovering close to the support bottom of $0.47.
Ichimoku Cloud is currently showing bearish results for XRP. It is a comprehensive indicator that defines support and resistance, determines trend direction, measures momentum and provides trading signals.
This indicator is currently above the candlestick, which is a negative sign for altcoins. Therefore, the price of XRP may break through this support and fall to a low of $0.44.
Read more: Ripple (XRP) Price Prediction 2024/2025/2030
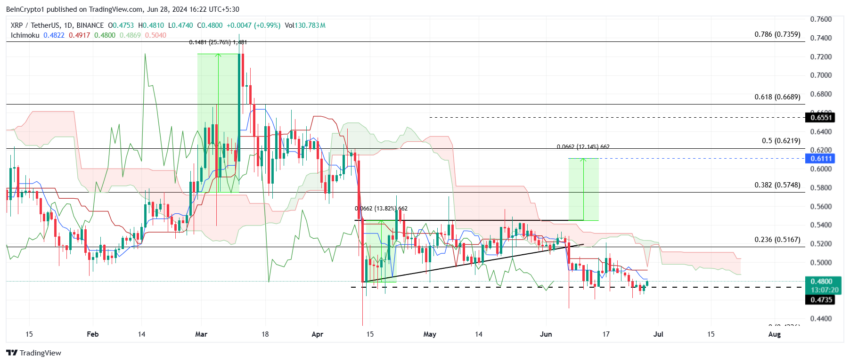
The best way to prevent XRP from falling is to pay attention to its sideways pattern. The expected direction for the altcoin is to bottom out between $0.47 and $0.51.


