Recently, there has been a divergence between the trends of BTC and the Nasdaq index of the US stock market. The Nasdaq keeps hitting new highs while BTC falls and drives the overall crypto market to fall significantly. This is inconsistent with the traditional impression that the Nasdaq has a positive correlation with BTC. So what is behind this What's the logic? Have similar situations occurred in history? This article will try to explore the strength and changes in the correlation between the two in different time dimensions by reviewing the current and last bull markets.
In fact, BTC and US stocks do not always have a positive correlation with a fixed coefficient, but have different degrees of correlation at different stages of the cycle. Looking back at the last bull market and this current bull market, we can find several patterns:
- The initial starting point and final end point of the two rises are completely consistent in time latitude.
- The rising process of the two is different
The rate of rise of the Nasdaq is relatively stable, and the K line shows a straight line with an approximate fixed slope.
BTC is different. The rising process is closer to exponential growth. The initial rising rate is slow, and then it rises rapidly after a certain point in time. Coincidentally, this "turning point" of accelerated rise corresponds to the rising stage of the Nasdaq. Stand firm during the first pullback.
3. At the same time, the first peak of BTC corresponds to the second small correction platform in the rising stage of the Nasdaq.


Which stage in history does the current market position correspond to?
Is there any trace of the rise and fall of BTC in U.S. stocks that the market is experiencing?
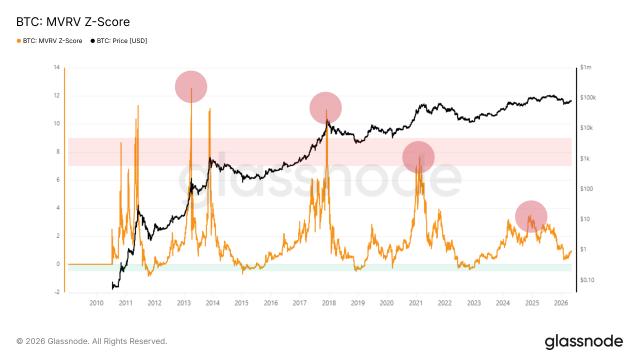
It can be found that during most of the two bull markets, BTC and U.S. stocks maintained a positive correlation. Negative correlation stages occurred but were not dominant. In the last bull market, after BTC peaked for the first time, the Nasdaq continued to rise, but BTC pulled back, and the trends of the two diverged (the yellow box in the figure below). This is similar to the current situation of the market, and history has Repeated again in the same place.
What will be the subsequent market trend? How long will the divergence between BTC and the Nasdaq continue? How will the divergence be responded to? From two aspects: time and intensity:
1. In the last bull market, the divergence between the two lasted for a short time. On a weekly basis, it lasted about 9 weeks, and then returned to a positive correlation (weekly level).


2. In the last bull market, the time when the two recovered their positive correlation was when the BTC daily level showed obvious decline in strength and reached an important support position.


If we use historical standards to measure it, we can see that the current market has not fully met the conditions for divergence and recovery, and we need to wait for more K-line information.
How to logically understand this special common trend that occurred in both bull markets
Regardless of whether BTC, gold, or U.S. stocks are in the same macro environment, prices are restricted by factors such as financial liquidity and risk-free asset yields. BTC, as a more elastic asset type, can rise strongly in the early stages of a bull market. , significantly outperformed the U.S. stock market, but things tend to reverse, and there is no permanent strength. After the main rise, it became weaker than the U.S. stock market. This is similar to the relationship between Altcoin and BTC.
From another perspective, during the main rise stage, market liquidity is sufficient to support the overall rise in asset prices. However, after the rise reaches a certain level, the fuel or motivation for the rise is exhausted and it is difficult to support the collective rise of all categories of assets. There is a gap between assets. There may be ups and downs.
Judging from event factors, the market has recently been affected by selling pressure from the German government and Mentougou. No matter how you interpret this trend, BTC will eventually return to a positive correlation with US stocks after the adjustment is fully in place.
(The above are the author’s personal opinions for reference only)