


Get the best data-driven crypto insights and analysis every week:
State of the Network’s Q2 2024 Wrap-Up
By: Tanay Ved
Key Takeaways:
ETH, BTC and SOL saw YTD gains of 48%, 44% and 38% respectively in Q2 2024, despite a more subdued quarter overall for crypto markets.
Bitcoin’s 30D hash rate declined 7% post-halving to 580 EH/s, while looming Mt. Gox repayments and German authorities' BTC sales add to market pressure.
Ethereum staking reached 33M ETH (27% of supply), while 13.7M ETH (11.5%) is locked in smart contracts and bridges, constraining liquidity.
Stablecoin transfer volumes hit a record $1.2T in May 2024, with DAI on Ethereum and USDT on Tron leading at $345B and $388B respectively.
Introduction
In this special edition of State of the Network, we take a data-driven look at major developments that impacted the digital assets industry in Q2 2024.
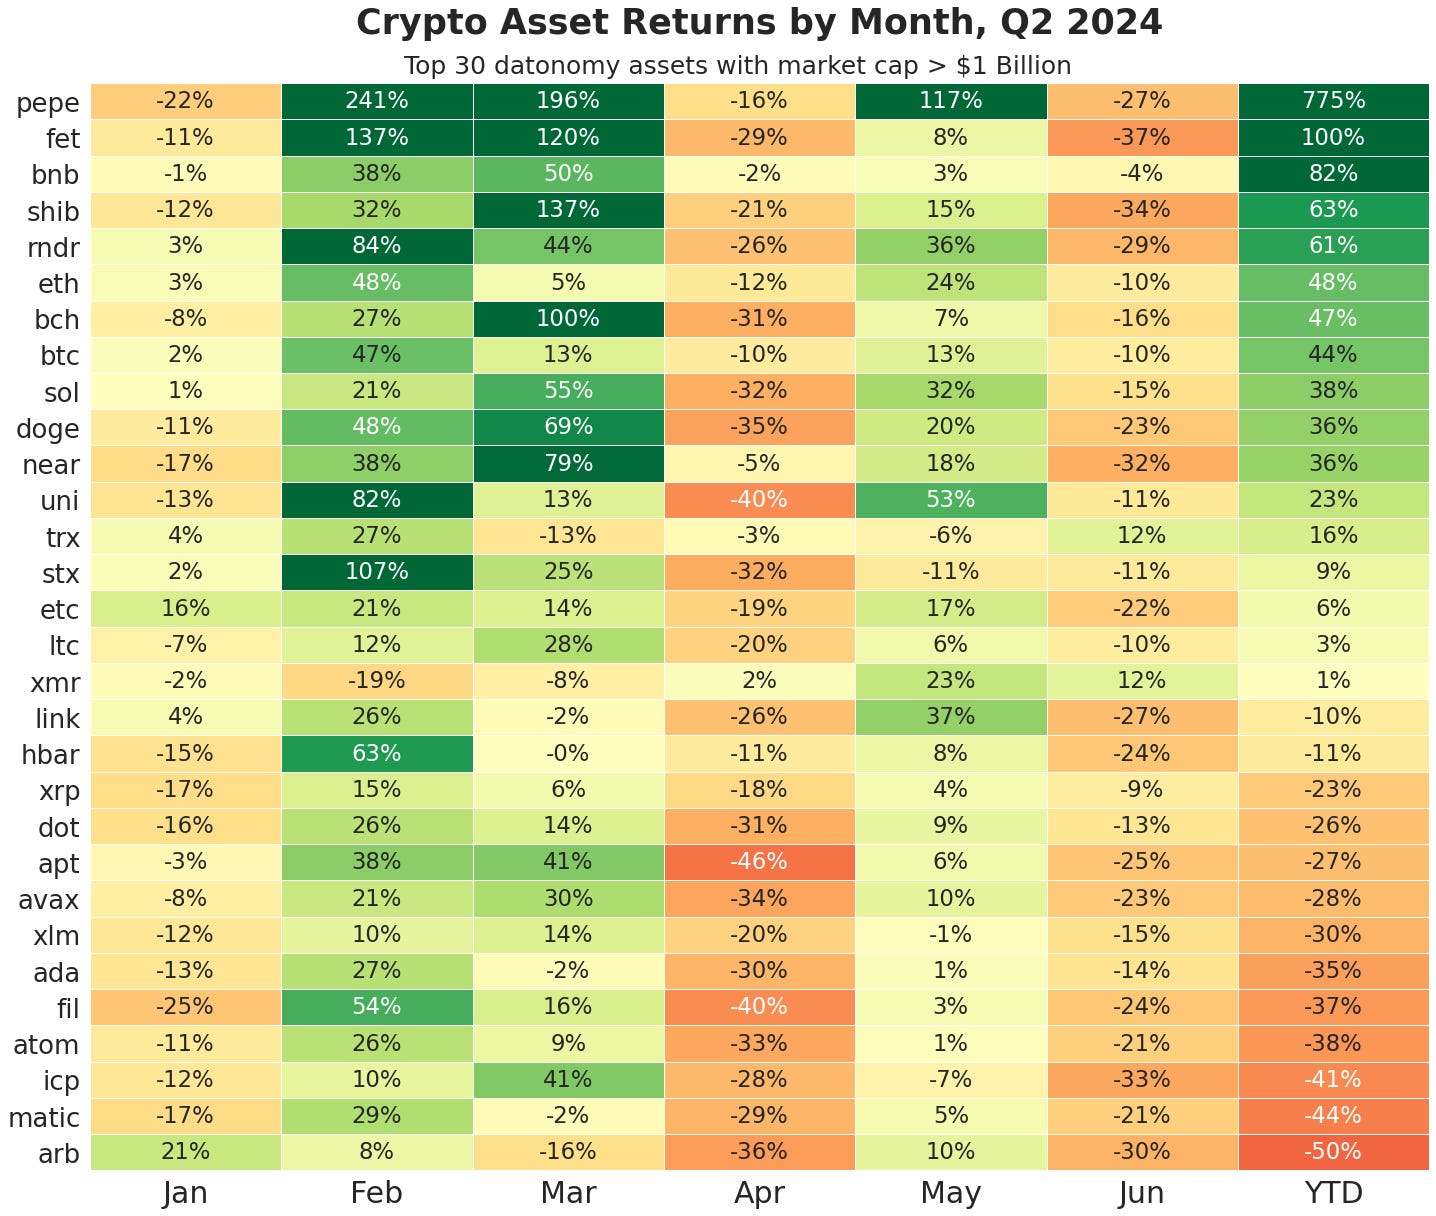
Source: Coin Metrics Reference Rates, datonomy™
After a strong start to the year, with the long-awaited launch of spot bitcoin ETFs, Ethereum’s stride towards scalability, momentum in the stablecoin and layer-1 ecosystem, Q2 displayed a more subdued market performance. Among the largest crypto assets, Ethereum (ETH) saw a 48% gain year-to-date, followed by Bitcoin (BTC) and Solana (SOL) rising by 44% and 38% respectively. The meme coin, real world asset (RWA) and artificial intelligence (AI) compute sectors stood out, with tokens like PEPE and Fetch.ai (FET) posting substantial gains.
Characterized by the Security and Exchange Commission’s (SEC) surprise approval of Ether spot ETFs, May provided greener pastures to an otherwise challenging period of April and June. These months featured Bitcoin’s 4th halving and market-wide caution around new token launches and distribution mechanisms, resulting in a mixed performance across different sectors.
Zooming Out: Macro Trends & Market Performance
The fortunes of the market are not only confined to internal events occurring within the crypto ecosystem, but also influenced by external market conditions and developments. Examining the performance of major traditional market indexes, ETFs and equities alongside those in the digital asset universe can provide crucial context for understanding the broader economic landscape.
In Q2 2024, we witnessed a notable divergence between crypto markets and traditional risk assets, particularly technology equities. Artificial intelligence remained at the forefront of investor mindshare, with NVIDIA crossing a $3T valuation to become the world’s most valuable company, while single-handedly accounting for over a third of S&P 500’s gains in 2024. Apple saw a 24% increase, buoyed by announcements in collaboration with OpenAI during the annual Worldwide Developers Conference (WWDC), together buoying the Magnificent 7 Index higher by 14.8% in Q2. Along this theme, a few publicly traded Bitcoin miners, positioning themselves infrastructure providers for a broader set of compute applications, contributed to the Valkyrie Bitcoin Miners ETFs (WGMI) gains.
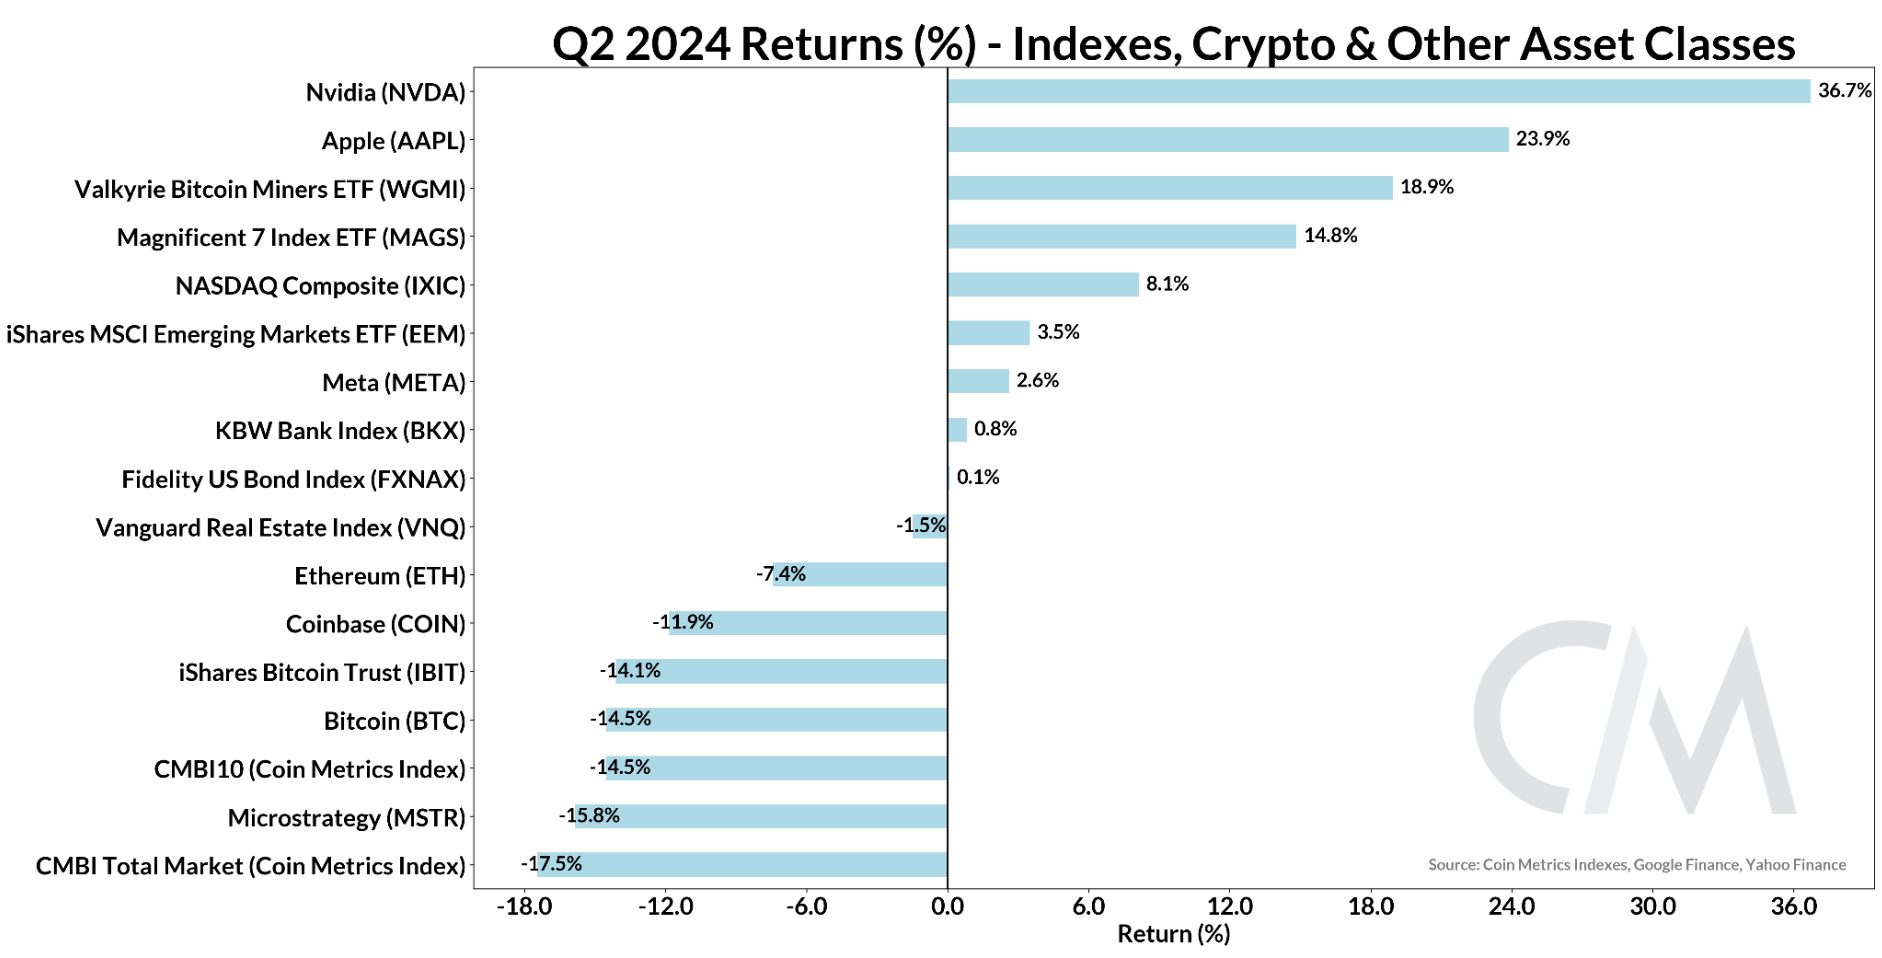
Source: Coin Metrics Indexes, Google Finance, Yahoo Finance
The digital asset market has generally fallen behind these bullish trends in tech and public miners alike—both the Coin Metrics' CMBI 10 index (a performance benchmark for a basket of the 10 largest cryptoassets) and the CMBI Total Market Index—posted double-digit declines over Q2. As equities reach record highs, participants in crypto markets may look for a reversal, catalyzed by interest rate cuts, favorable outcomes from the presidential election or a reduction in pressures currently clouding the market.
Bitcoin’s Brace For Impact
In predictable fashion, Bitcoin entered its 5th epoch with the completion of its 4th halving in April. However, a combination of developments may have contributed to the downward pressure on BTC’s price of late. Despite boosts in transaction fee revenue from the launch of Runes in the aftermath of the halving, the drop in block rewards from 6.25 BTC to 3.125 BTC have compressed miners’ margins, leading to a 7% decline in the 30-day moving average of Bitcoin’s hash rate to 580 EH/s. While to a lesser extent than prior halvings, miner-held BTC reserves have also dipped to their lowest since April 2021, now standing at 1.78M BTC.
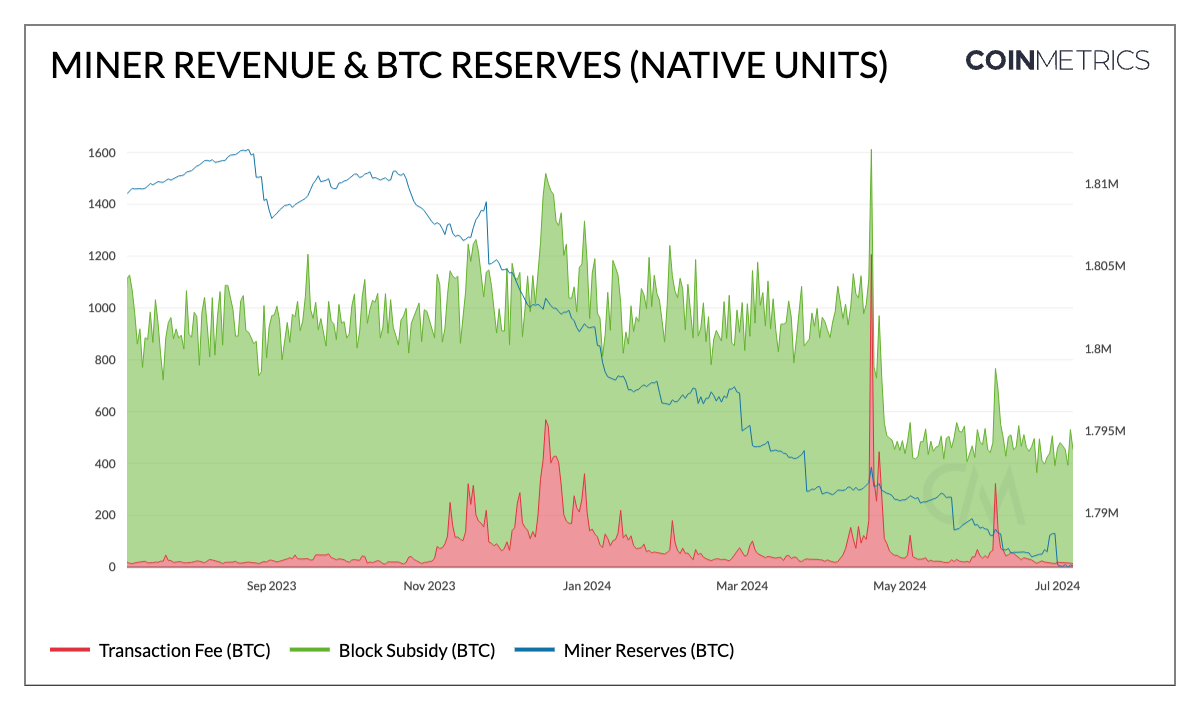
Source: Coin Metrics Network Data Pro
Additionally, market sentiment has been shaken by concerns over increased sell pressure from impending supply overhangs. Notably, the long-defunct exchange Mt. Gox announced that it would redistribute approximately 142K BTC (valued at around $8B), or closer to ~65K BTC for initial payouts to creditors this July. While former users would be receiving bitcoin at substantially higher market prices, the extent to which they’d hold onto or sell their bitcoin remains uncertain. Though, recent wallet activities associated with the entity have raised fears of sell-offs, potentially prompting some investors to sell preemptively.
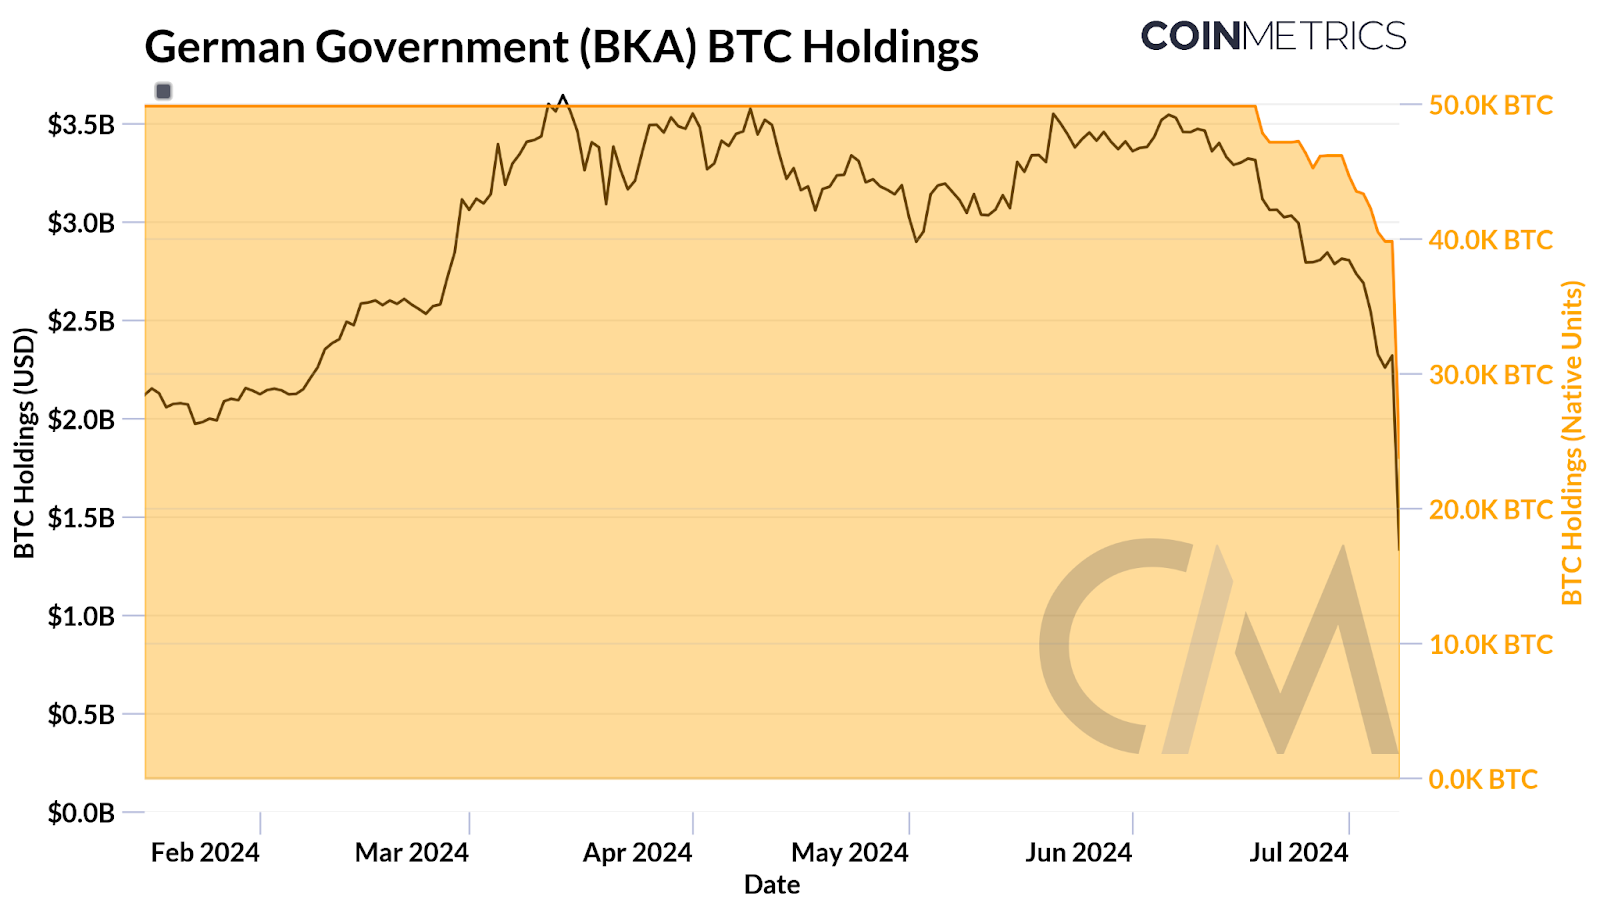
Adding to this, the German Federal Criminal Police Office (BKA) seized 50,000 BTC from the operators of Movie2k.to, an online platform that provided access to copyrighted movies until 2013. As of July 8th, wallets associated with this entity still hold about 27.4K BTC. Recent movements of funds between intermediary addresses and to exchanges, including Coinbase, Bitstamp, and Kraken, have prompted speculation about the entity's selling strategy and its impact on the market. Consequently, these developments have triggered liquidations, unwinding roughly $8B in open interest across bitcoin futures contracts. While these events may exert short-term pressure on BTC’s price, their one-off nature suggests the impact could be transitory.
Ethereum ETFs Imminent & ETH’s Inflationary Pressures
A pivotal development for Ethereum in Q2 came in the form of an unexpected approval of Ether spot ETFs. Prior to this, the timeline for an Ether ETF was thought to extend well beyond the anticipated summer deadline, primarily due to regulatory uncertainty surrounding ETH's security status. However, these concerns were quelled as the SEC moved to approve 19b-4s for 8 issuers in May, providing clarity around ETH’s commodity status. The market reaction was swift, buoying ETH and other ecosystem related tokens higher alongside a rapid compression in Grayscale Ethereum Trust (ETHE) discount to net asset value.
With Ether ETFs expected to launch soon, attention has now shifted to the magnitude of inflows these vehicles could attract for an asset like Ether relative to bitcoin. Without delving into the market size for Ethereum ETFs, understanding Ether’s supply dynamics can be instructive. 33M ETH (~27% of supply) is staked, while 13.7M ETH (~11.5% of supply) is held in smart contracts and bridges, representing ~39% of ETH supply that is ‘locked’. Meanwhile, supply on exchanges has trending lower to 12M ETH (~10% of supply). This constrained liquidity scenario could heighten price sensitivity in response to steady inflows from ETF-related demand.
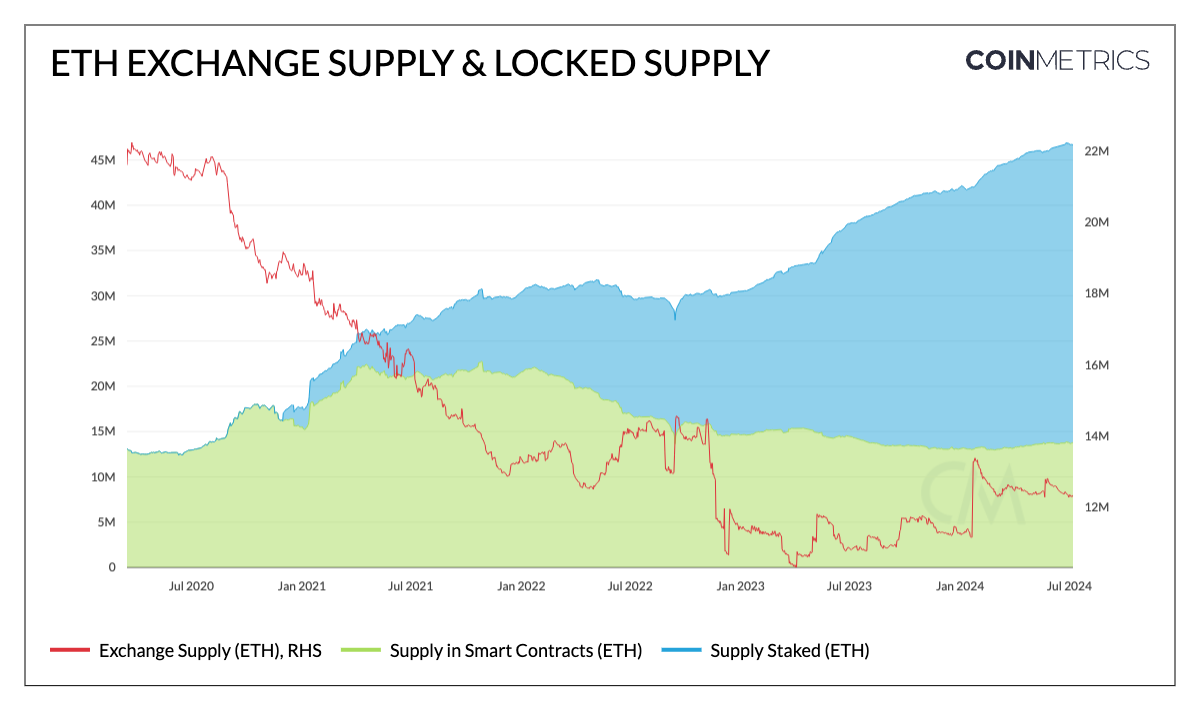
Source: Coin Metrics Network Data Pro
On the other hand, as Ethereum advances along its scalability roadmap, the adoption of blob space across Layer-2s has grown since EIP-4844 in March. With lower operational costs and fees make rollups more accessible, user activity has shifted further onto Ethereum Layer-2s at the expense of Ethereum mainnet. As a result, total fees on Ethereum L1 have reached a yearly low of 460 ETH ($1.4M) post EIP-4844, reducing the rate of supply burn, consequently turning ETH supply slightly net inflationary. This highlights the interplay between Ethereum’s scalability improvements and monetary system, necessitating increased Layer-2 usage to maintain ETH's deflationary pressure.
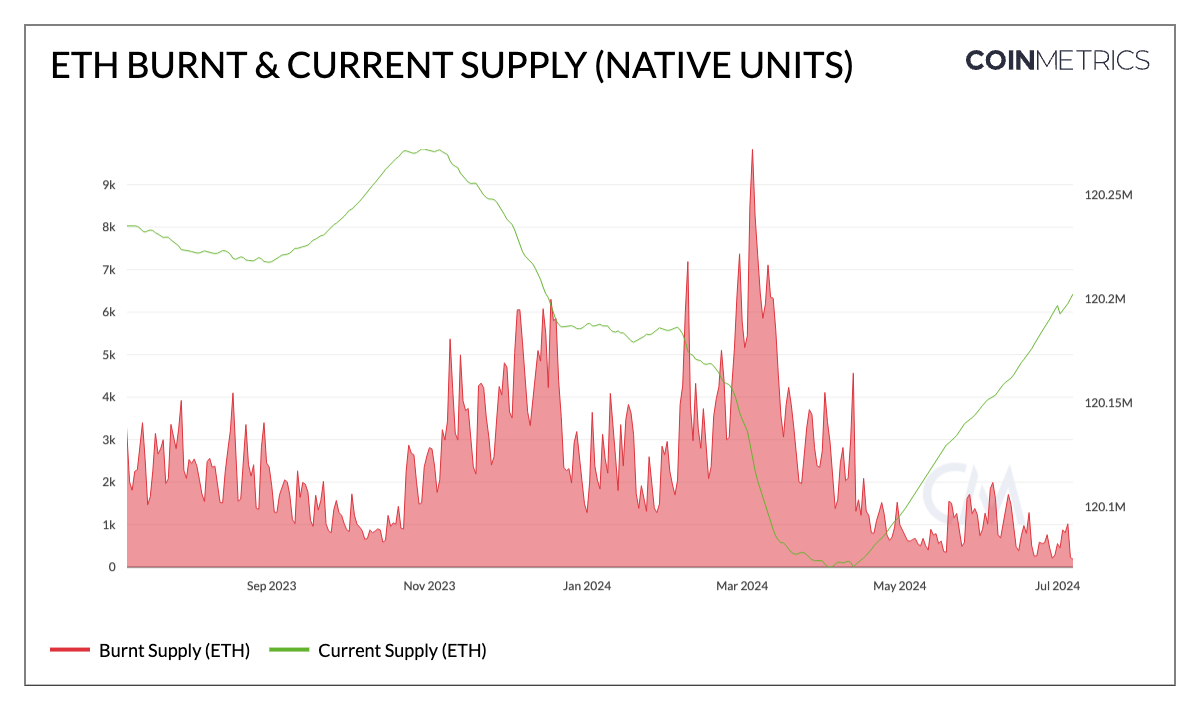
Source: Coin Metrics Network Data Pro
Outside of Ethereum, fees on Solana grew by over 150% YTD reaching levels close to that of Ethereum. While 50% off the highs seen in March, high usage on Solana has led to meaningful fee revenue thus far.
Flight to Quality: Altcoins Fall Out of Favor
The attention of market participants has also been gripped by an explosion of token launches, and their associated tokenomics. Particularly, the prevalence of tokens with low float (publicly available supply) relative to FDV (fully diluted valuation), and large supply unlocks. Check out our report ‘Floating on Thin Air’, where we explore this topic in greater detail. As the barriers to launching tokens and creating new chains are lowered, with projects like pump.fun fueling the rise of meme coins and others like Conduit making it easy to deploy rollups, a plethora of L1s, L2s, meme coins and infrastructure tokens have emerged.
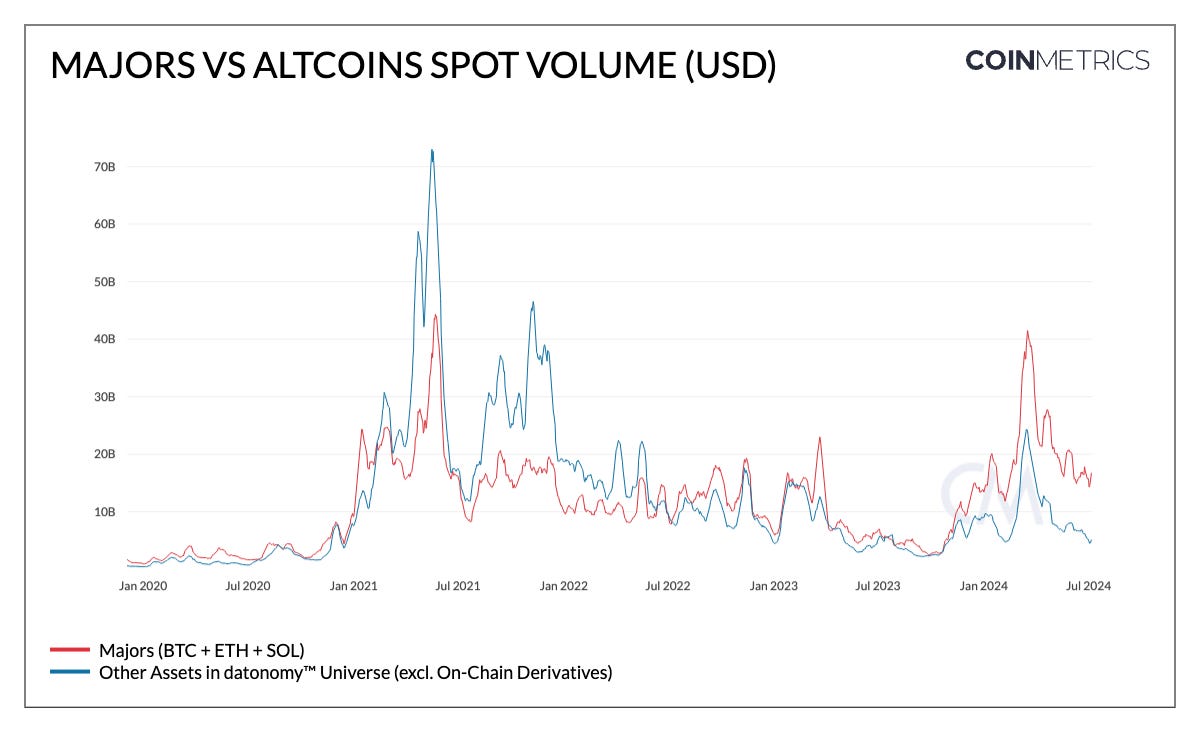
Source: Coin Metrics datonomy™, Formula Builder
As a result, the ‘altcoin’ sector has bloated, creating an oversupply of tokens. Arguably, this has led to heightened market awareness around new token launches, initial valuations and distribution, making blue-chip assets with established demand more attractive.
The 14-day moving average of trusted spot trading volume for majors (including BTC, ETH & SOL) and altcoins (other assets in the datonomy universe) reflects this dynamic convincingly. In the 2021 bull market, altcoin volumes comfortably exceeded that of majors, a trend that has reversed this time around. While majors hit a similar level of trading volume to the peak in 2021 (~$42B), altcoins have seen 3x lower volumes. The divergence between the two baskets has also increased of late, with spot volume of majors $11B higher.
Stablecoins Gain Regulatory Momentum
The stablecoin sector has displayed sustained growth, building on rising liquidity from Q4 2023. The aggregate supply of stablecoins increased by 3.8% in Q2, totalling $159B, with $60B hosted from Ethereum L1 and $30B on Tron. On a monthly basis, the (adjusted) USD transfer volume across stablecoins reached a record-high of $1.2T in May, primarily driven by Dai on Ethereum ($345B) and Tether on Tron ($388B).
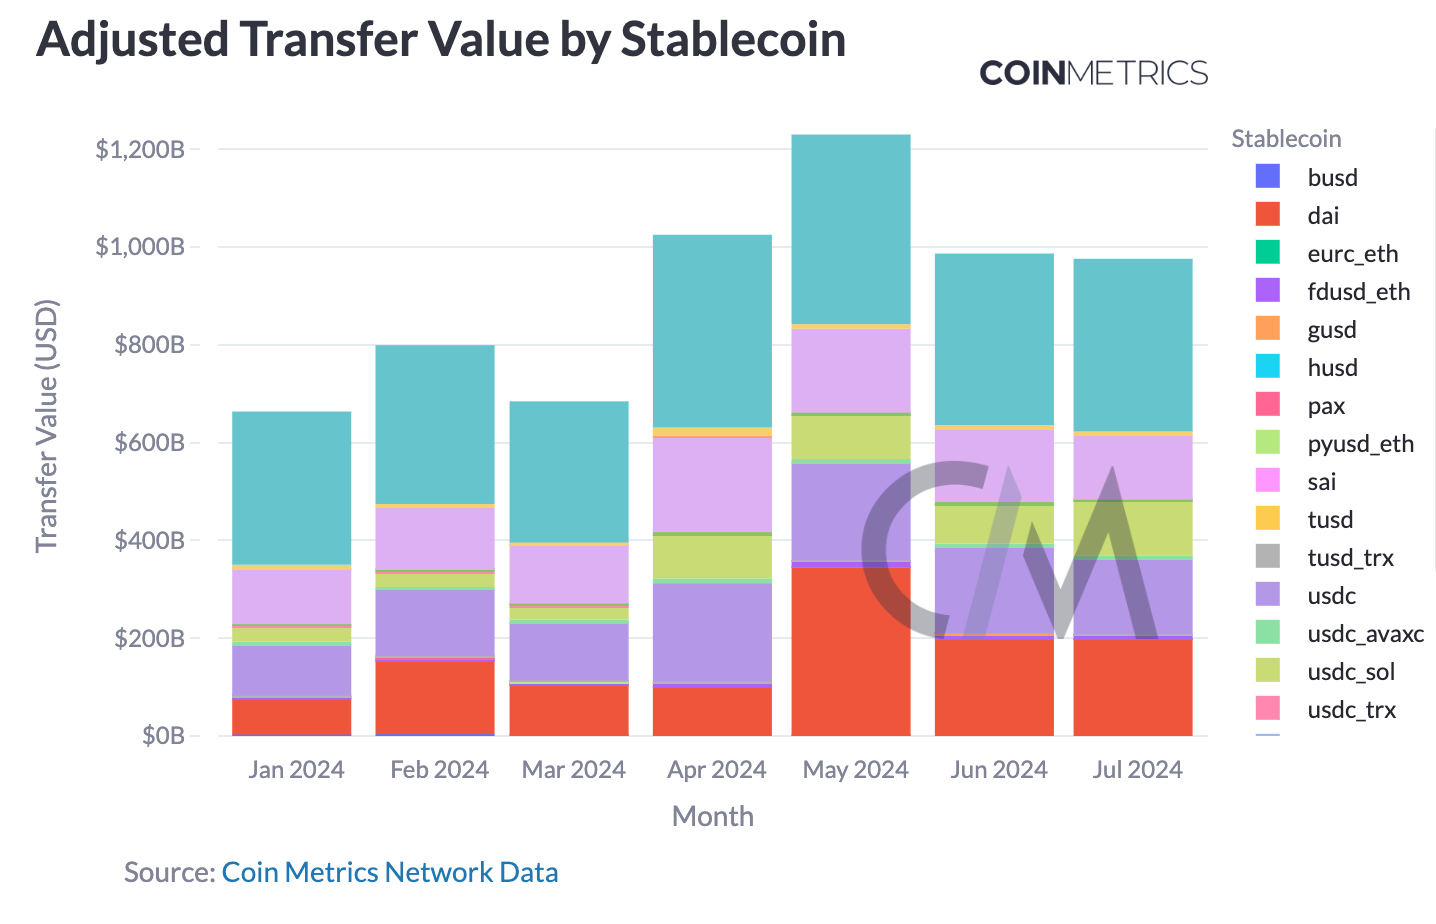
Source: Coin Metrics Stablecoin Dashboard, Network Data Pro
This growth coincides with significant regulatory developments, particularly the implementation of the Markets in Crypto-Assets (MiCA) regulation in the EU. Circle, issuer of USDC and EURC, became the first global stablecoin issuer to comply with MiCA, obtaining authorization as an electronic money institution. These are expected to foster a more secure and transparent stablecoin market, with implications extending beyond the EU—potentially influencing global regulatory standards. As a result, stablecoin issuers that adapt to these new requirements are likely to consolidate market share and capture growth opportunities in a different jurisdiction.
Conclusion
Q2 2024 presented a complex landscape for digital assets, marked by significant regulatory developments, technical milestones, and shifting market dynamics. The approval of Ether spot ETFs and progress in stablecoin regulation signal growing institutional acceptance and regulatory clarity. However, challenges persist, including Bitcoin's post-halving adjustments and potential sell pressure from Mt. Gox distributions.
Looking ahead, key areas to watch include the launch and adoption of Ether ETFs, the impact of Layer-2 scaling solutions on Ethereum’s sustainability, and the ongoing regulatory developments in major markets. These factors, along with broader macroeconomic trends, will be crucial in determining the digital asset market's direction for the remainder of 2024 and beyond.
Coin Metrics Updates
This quarter’s updates from the Coin Metrics team:
Follow Coin Metrics’ State of the Market newsletter which contextualizes the week’s crypto market movements with concise commentary, rich visuals, and timely data.
Subscribe and Past Issues
As always, if you have any feedback or requests please let us know here.
Coin Metrics’ State of the Network, is an unbiased, weekly view of the crypto market informed by our own network (on-chain) and market data.
If you'd like to get State of the Network in your inbox, please subscribe here. You can see previous issues of State of the Network here.


