As the market awaits the launch of an exchange-traded fund (ETF) tracking the spot price of Ethereum (ETH), speculation is growing that it will signal the start of altcoin season.
This period is typically characterized by a surge in the value of alternative cryptocurrencies relative to Bitcoin .
There are only a few coins that surpass Bitcoin.
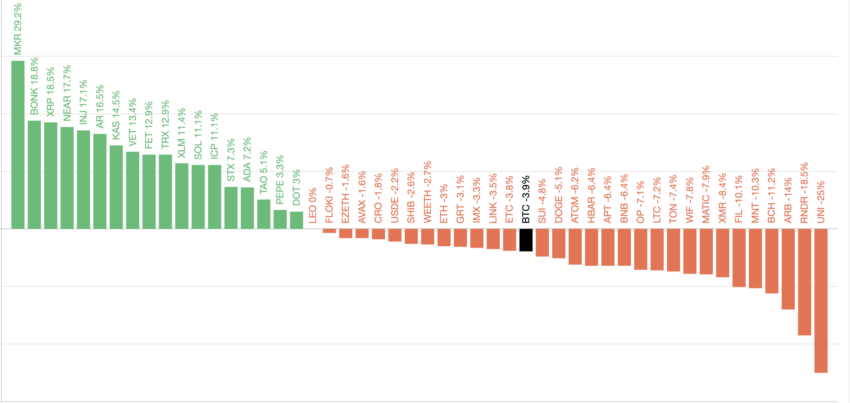
Altcoin season begins when more than 75% of the top 50 altcoins outperform Bitcoin for three months.
Over the past 90 days, only 18 of these assets have outperformed Bitcoin, suggesting we are in the early stages of this season.

The top three assets that have outperformed Bitcoin over the past three months include decentralized finance (DeFi) token MakerDAO (MKR), meme coin Bonk (BONK), and Ripple (XRP).
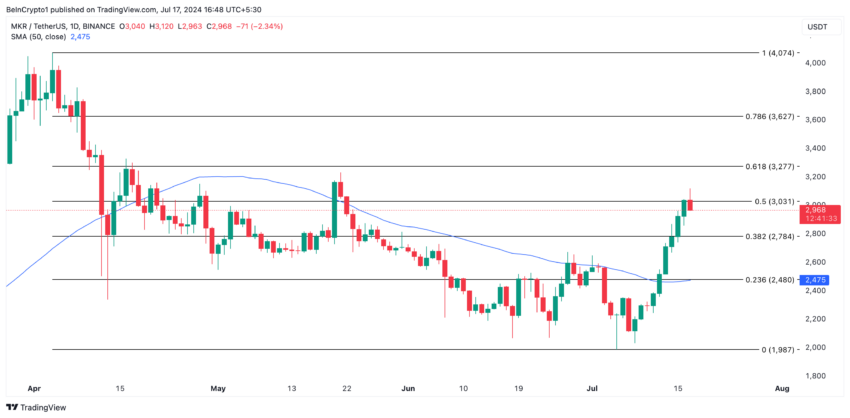
MakerDAO has surpassed the 50-day SMA and is poised for a further rise.
Maker (MKR) price has risen significantly over the past week. Trading at $3,024 at press time, the price of this altcoin has risen 33% over the past seven days.
During this period, the token surpassed its 50-day small moving average (SMA), which measures the average price over the past 50 trading days.
When the price of an asset rises above this key moving average, it indicates that momentum is turning positive. This is often considered a bullish signal by traders and investors. This confirms that asset prices are on an upward trend and may continue to rise.

If MKR maintains this trend, the price will rise to $3,277.
Bonk Bulls take the lead
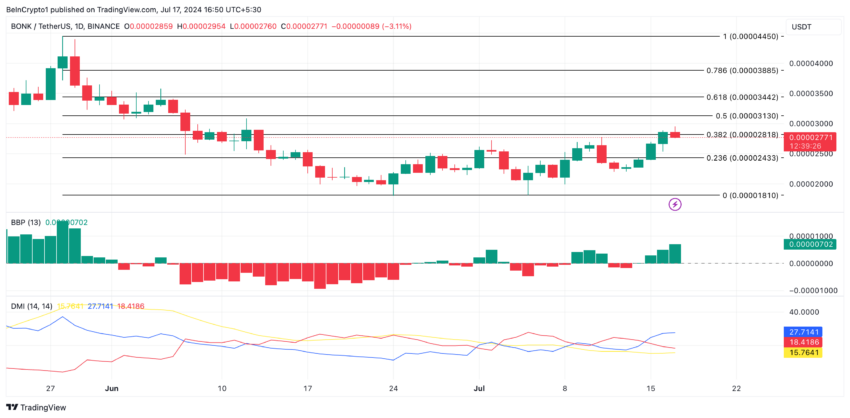
Over the past 90 days, the price of BONK has increased by 19%. It rose more than 20% last month alone. As of this writing, the altcoin is trading at a monthly high of $0.00002836.
The readings of the Elder-Ray Index evaluated on the daily chart show that the bullish bias towards meme coins remains significant. At press time, the indicator's value was 0.0000069, above the zero line. After July 15th, only positive values were returned.
Additionally, the setting of Bonk's Directional Movement Index (DMI) lends credence to the above position. At press time, the token's Positive Directional Indicator (+DI) (blue) is above its Negative Directional Indicator (-DI) .
An asset's DMI evaluates price strength and direction. When DI is above -DI, it is a sign that the asset price is trending upward rather than downward. Traders view this as a bullish signal, meaning that buying forces are stronger than selling forces.

If BONK's buying trend continues, the price may rise to $0.000031.
Ripple (XRP) hits highest level in months
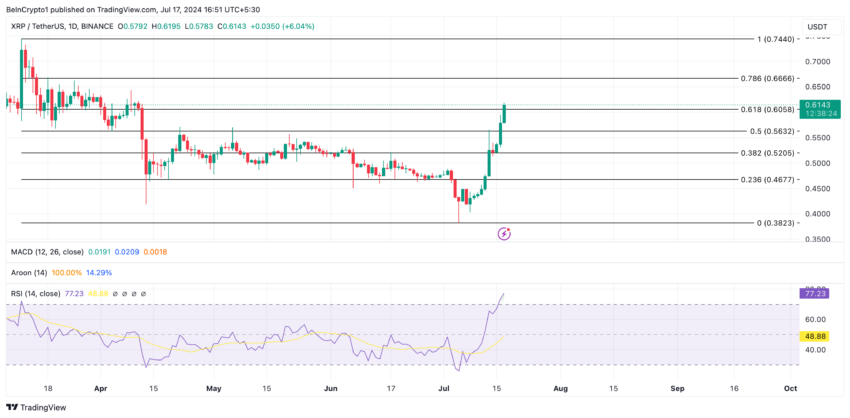
Over the past seven days, the price of Ripple (XRP) has risen 38%, hitting a multi-month high. Ripple is currently trading at $0.61, a price level last observed on April 12th.
However, altcoins run the risk of losing some of these gains. Looking at the relative strength index (RSI), Ripple is overbought and looks set to fall. The value of the indicator is 77.21.
The RSI of an asset measures overbought and oversold market conditions. It ranges from 0 to 100, with a reading above 70 indicating the asset is overbought and about to fall, while a reading below 30 indicates the asset is oversold and could bounce.
If the price of Ripple rebounds, it could fall below $0.60 and trade at $0.56.

However, if the upward trend continues, it could trade at $0.66.


