

After more than a decade of lengthy legal proceedings, the recovered bitcoins from the highly publicized collapse of the Mt. Gox exchange will finally be distributed to creditors. Psychologically, this marks the end of a major market suspense that has plagued the industry since 2013.
executive Summary
After a long time, Mt. Gox creditors have finally started receiving the Bitcoin recovered from the infamous hack. So far, 59,000 BTC have been distributed to creditors through Kraken and Bitstamp exchanges out of a total of 142,000 BTC recovered.
The proportion of Bitcoin held by new investors is gradually decreasing and is far below the level at the market peak. This trend shows that investor behavior tends to be holding.
The distribution pressure on the LTH (long-term holder) group is small and gradually easing. Currently, long-term investors hold about 45% of network wealth, which is still high compared to the peak of the macroeconomic cycle.
Mt.Gox distribution is in place
After more than a decade of legal wrangling, the long-awaited distribution of Bitcoin to creditors following the collapse of the Mt. Gox exchange is now underway. This is a historic milestone for the Bitcoin industry, especially for those patient and determined creditors who, after a difficult and arduous struggle, chose to receive compensation in BTC rather than fiat currency.
From a psychological perspective, this step symbolizes the end of the major market uncertainty faced by the industry since 2013.
The total amount of recovered currency has exceeded 141,686 BTC, of which nearly 59,000 BTC has been redistributed to creditors, and another 79,600 BTC will be distributed soon.
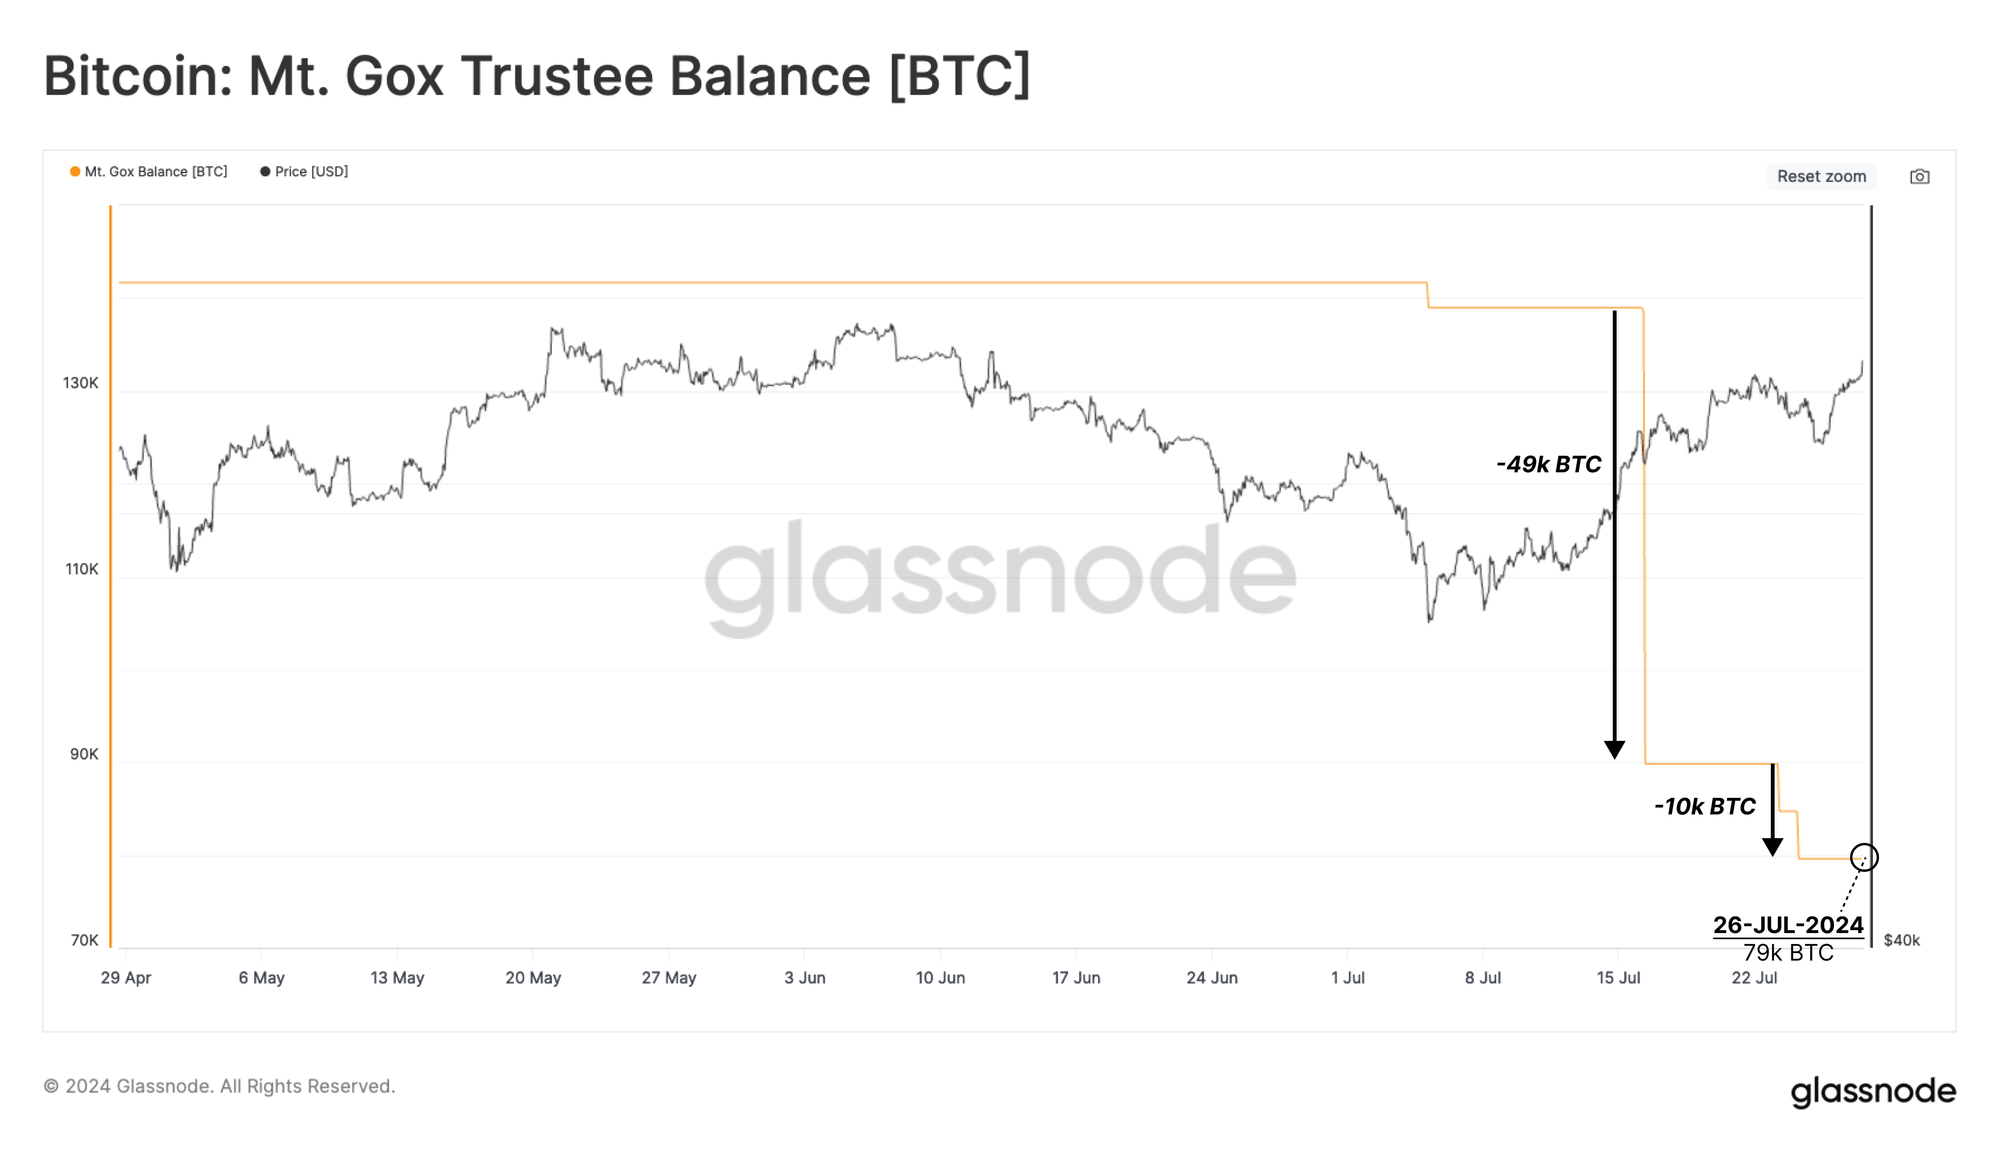
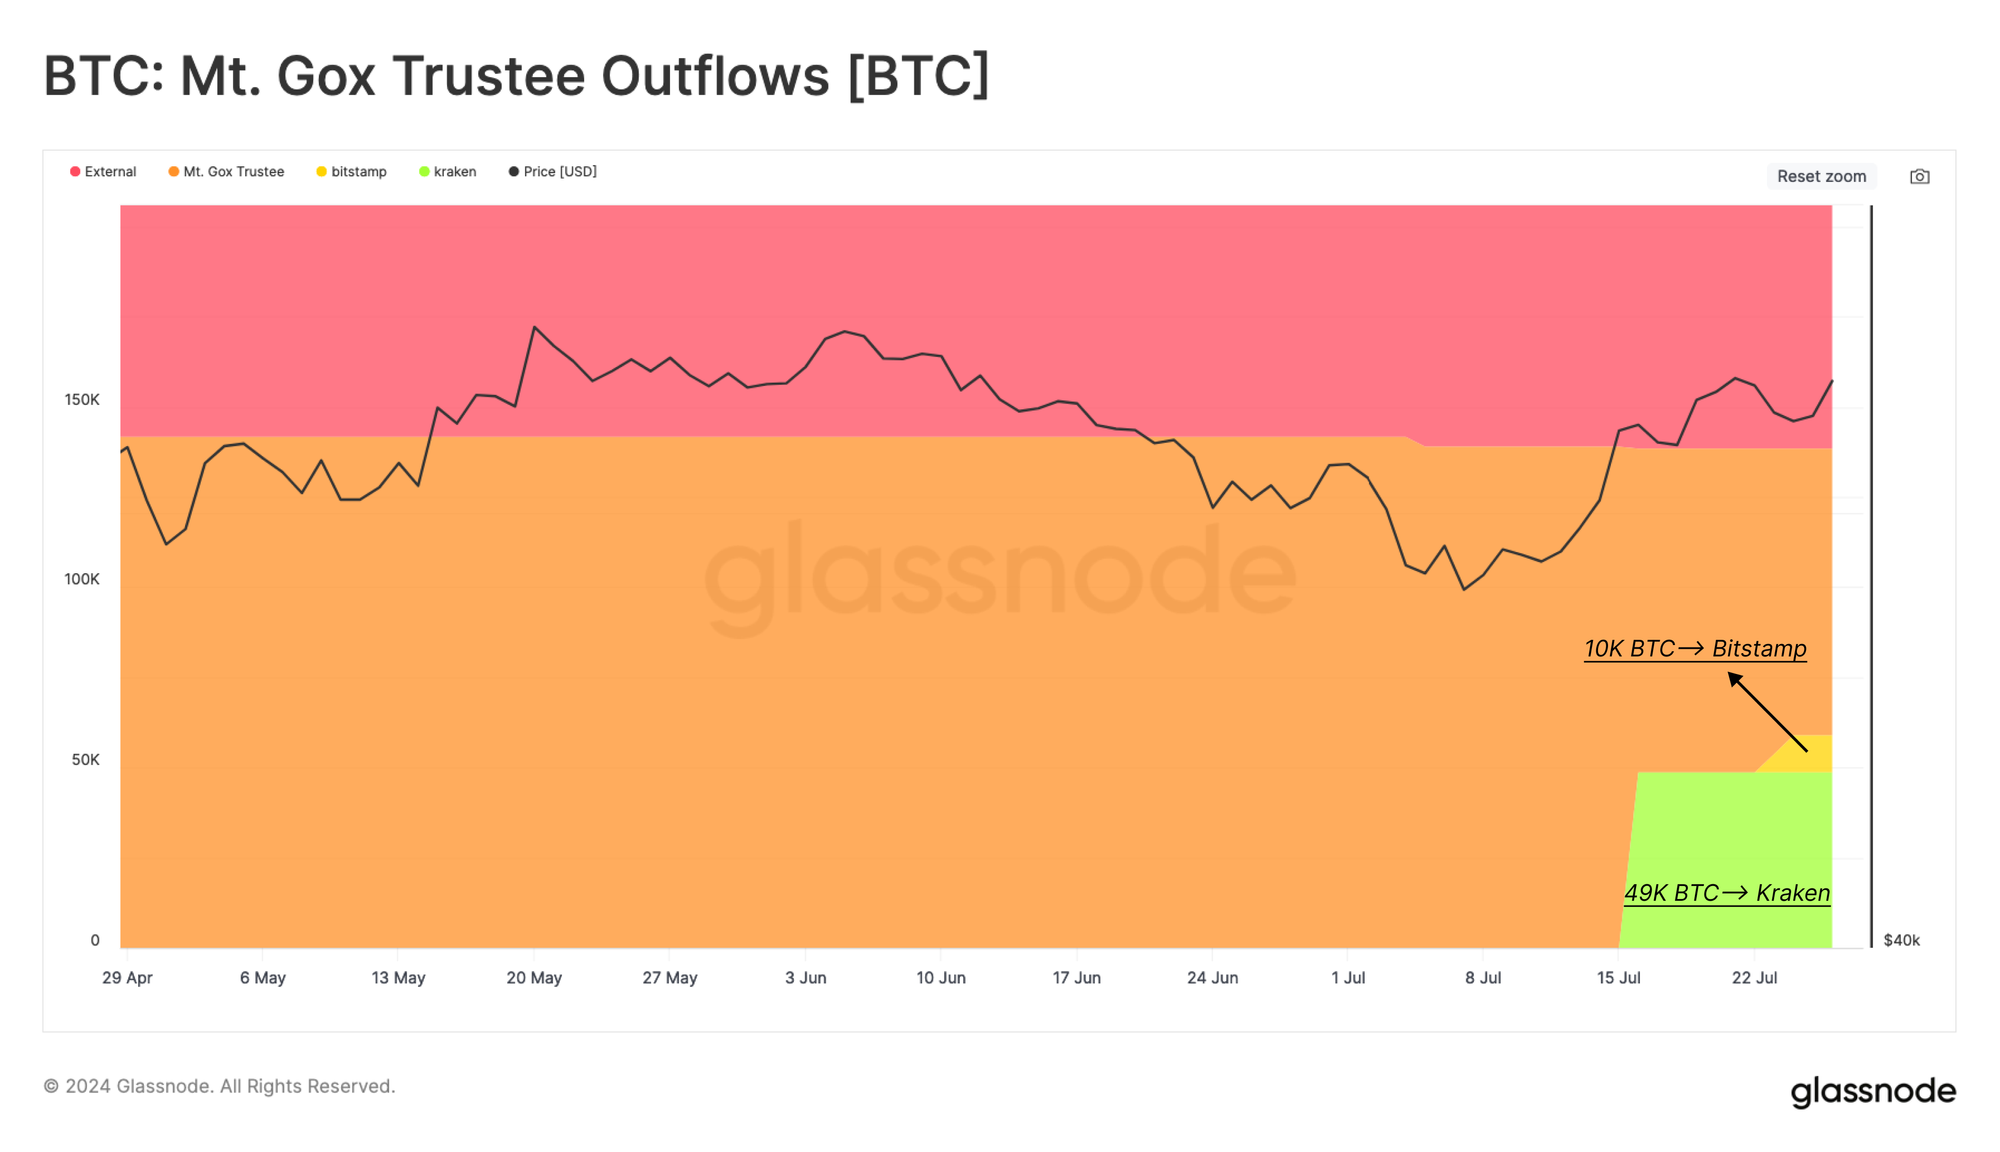
Kraken and Bitstamp were selected as the exchanges responsible for redistributing creditors’ funds. Kraken has received 49,000 BTC, while Bitstamp has received the first 10,000 BTC.
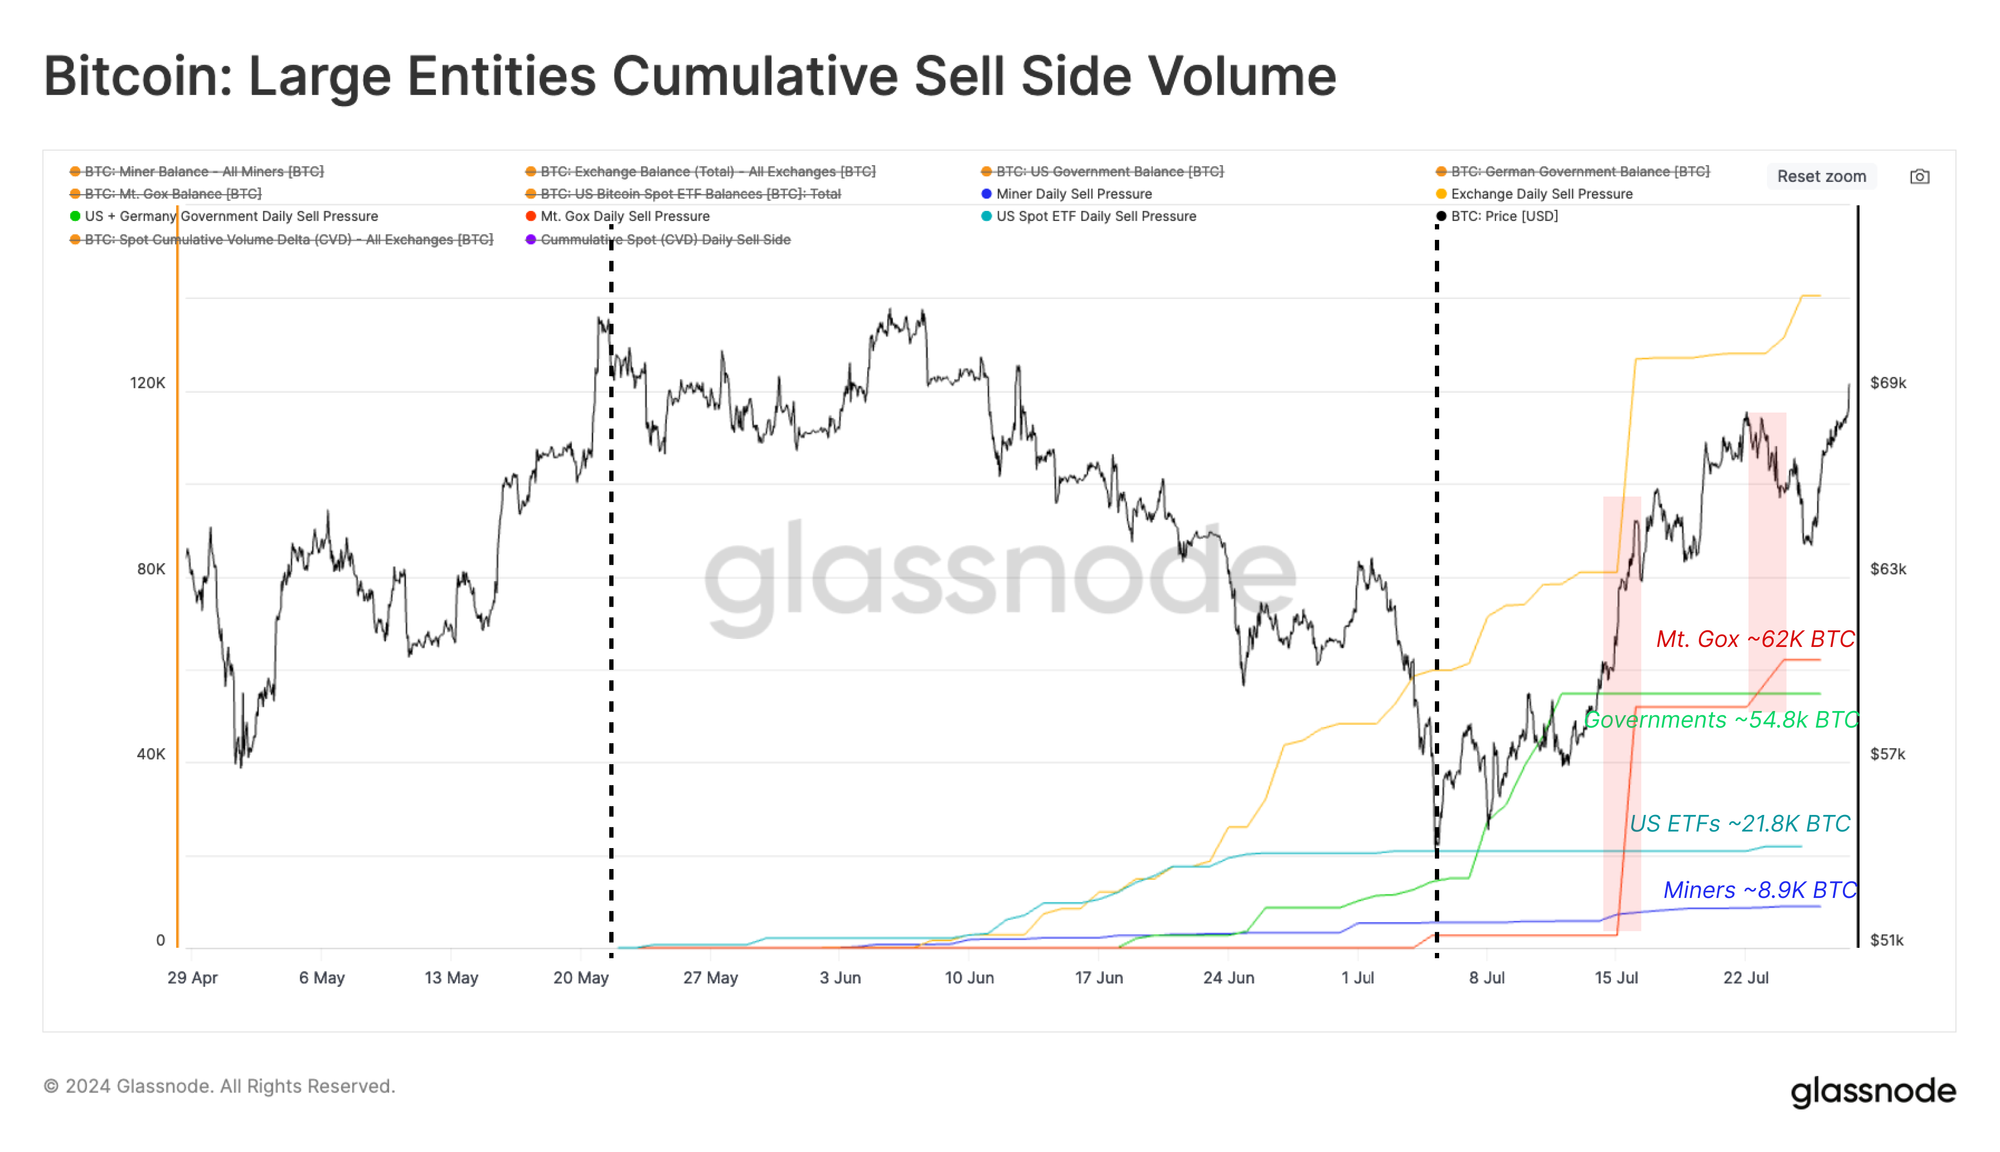
Comparing Mt. Gox's asset allocations to those of large entities over the past two months, it is clear that these allocations have eclipsed ETF inflows, miner issuance, and German government selling.
However, it is worth noting that creditors have a long history of recovering funds, which may be indicative of their future behavior patterns:
- Creditors chose to accept Bitcoin instead of legal tender, which is new under Japanese bankruptcy law.
- Multiple entities fought for creditors’ claims during the decade-long legal process.
- Given the time span since the collapse of Mt. Gox, many creditors who have not sold their claims may still be active in the Bitcoin space.
Therefore, the possibility that some of these decentralized currencies are actually sold on the market is relatively small, but this situation is somewhat speculative and the actual situation is difficult to evaluate individually.
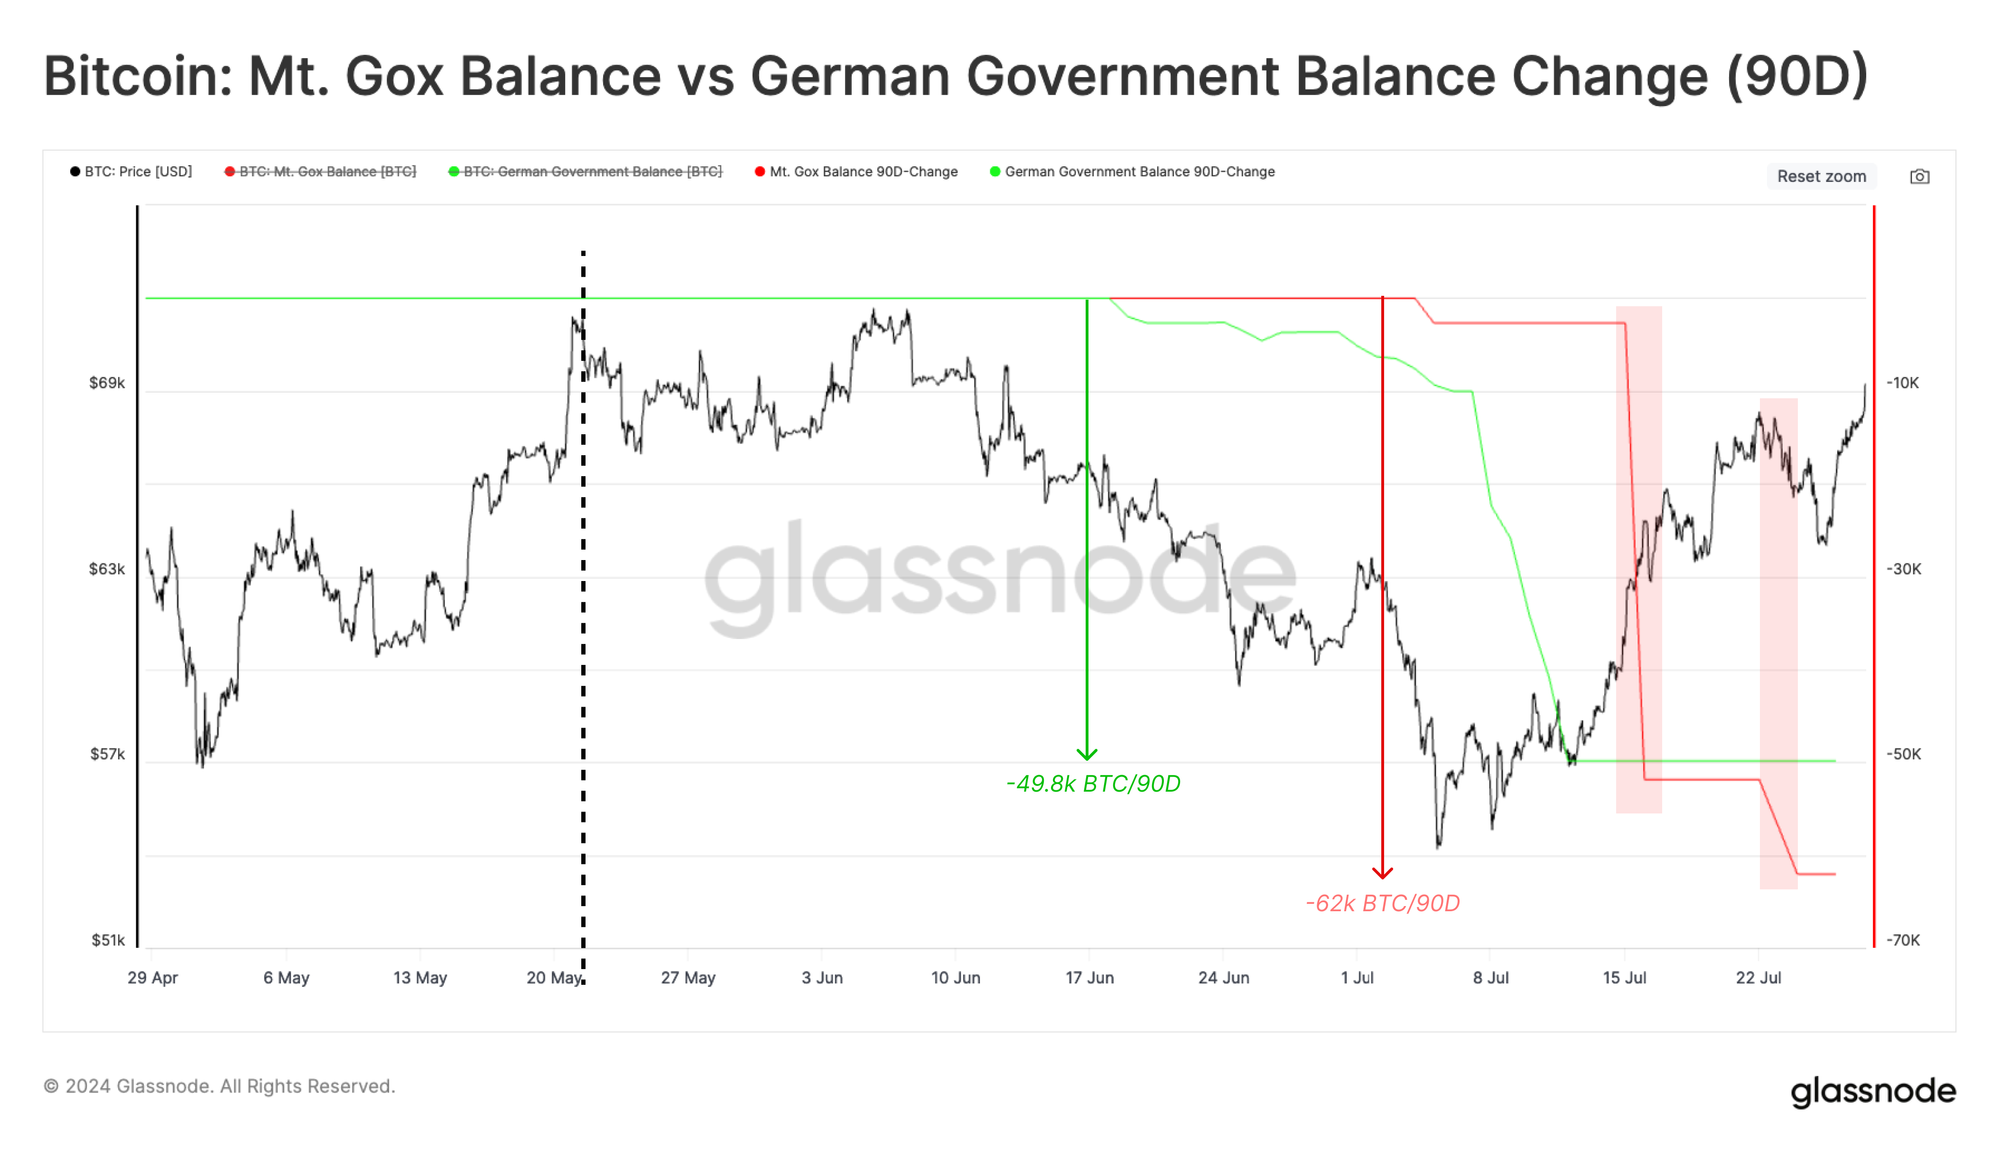
At the end of June, the German government’s massive selling exceeded 48,000 BTC in a month, despite this, the market absorbed this supply and managed to rebound from $53,000 to over $68,000 shortly after.
During the Mt. Gox release, the price of Bitcoin has been fluctuating between $68,000 and $66,000, which could suggest weaker-than-expected market performance or relatively resilient demand conditions.
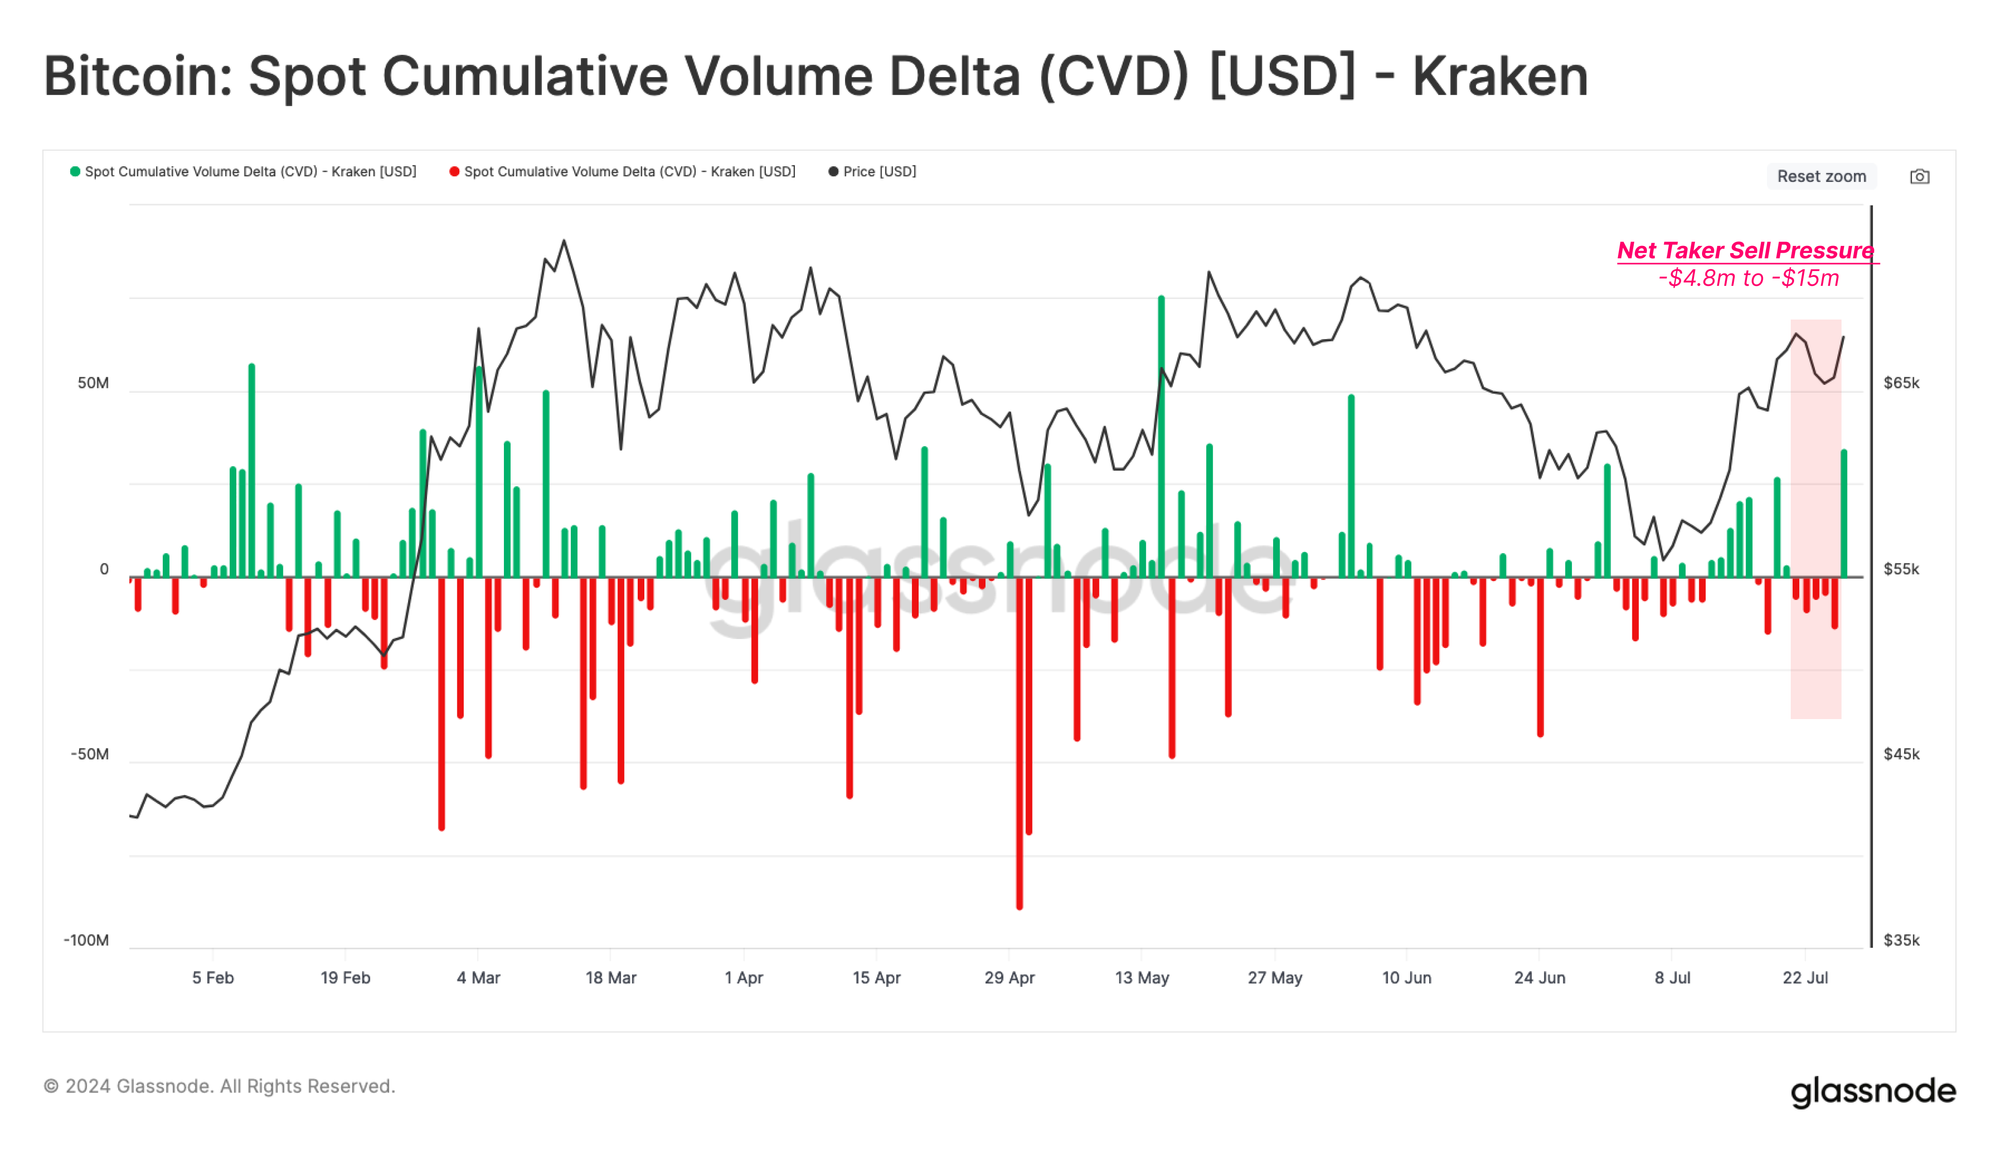
Considering that both Kraken and Bitstamp are destination exchanges for redistributed tokens, we further add color to this view through the spot cumulative volume delta (CVD) metric.
The CVD metric measures the net difference between spot buy and sell volumes (market orders only) on centralized exchanges.
Analyzing Kraken’s associated CVD metric, we can see that sell-side pressure has risen slightly as the allocation proceeded, but this remains within typical daily ranges.
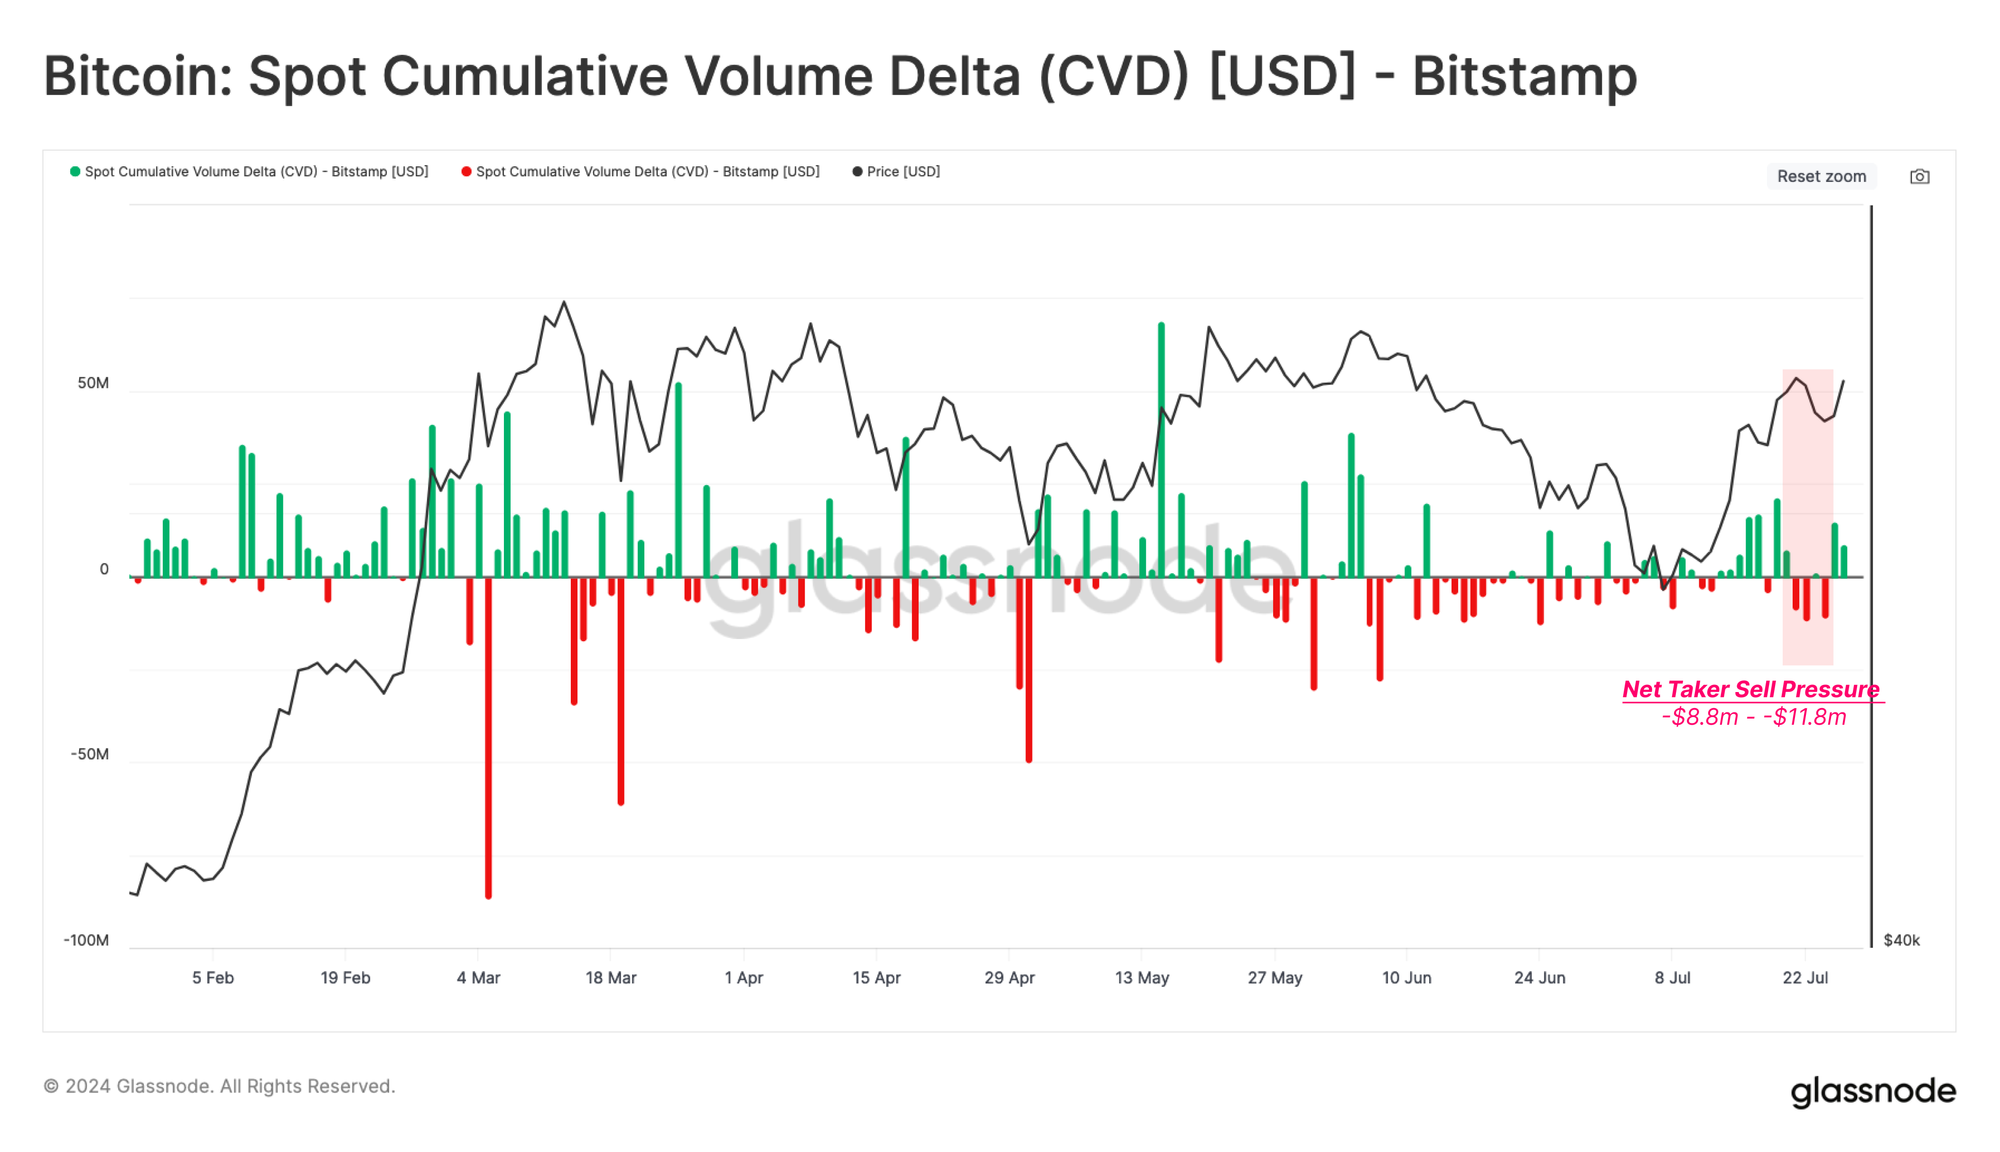
On Bitstamp, the situation is similar, with a slightly stronger seller-led bias.
This further supports the view that bondholders may be more inclined to have a long-term holder mentality. If this is true, given the significant price increase since 2013, bondholders’ profit motive is extremely strong, which is undoubtedly a phenomenon worth paying attention to.
Hold on
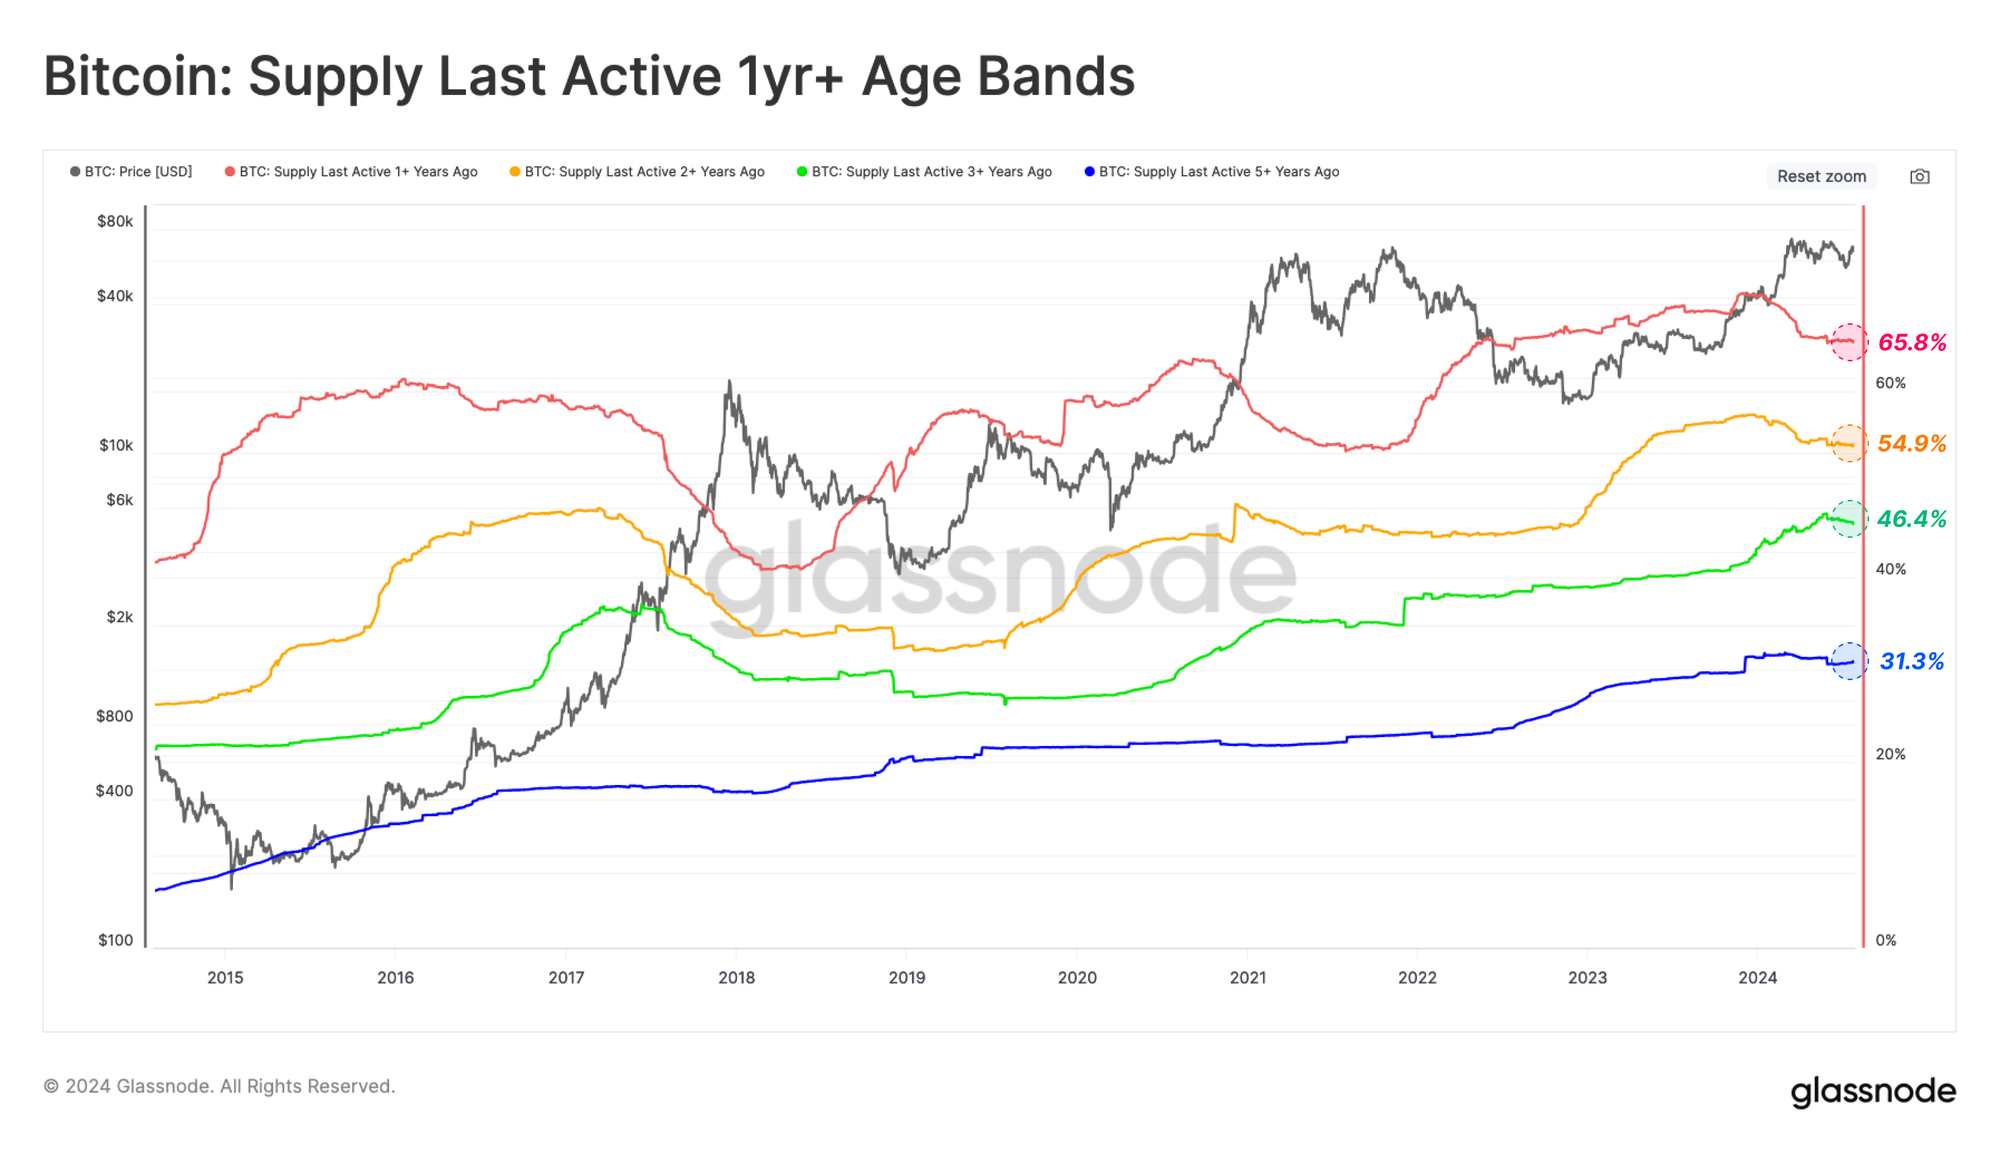
In a Bitcoin bull run, higher prices naturally attract selling pressure as higher prices incentivize long-term holders to realize profits on some of their holdings. We can clearly see this phenomenon by observing the significant decline in the recent 1+ year and 2+ year supply indicators in March and April.
This situation describes how long-term investors met new market demand by selling and using tokens before the Bitcoin price reached its all-time high (ATH) of $73,000. The recent slowdown in the decline of these indicators indicates that the investment strategy of sticking to long-term holding is gradually recovering.
- The proportion of supply that has been recently active for more than a year is 65.8%.
- The proportion of supply that was most recently active for more than two years is 54.9%.
- The proportion of supply that was most recently active for more than three years is 46.4%.
- The proportion of supply that was most recently active for more than five years is 31.3%.
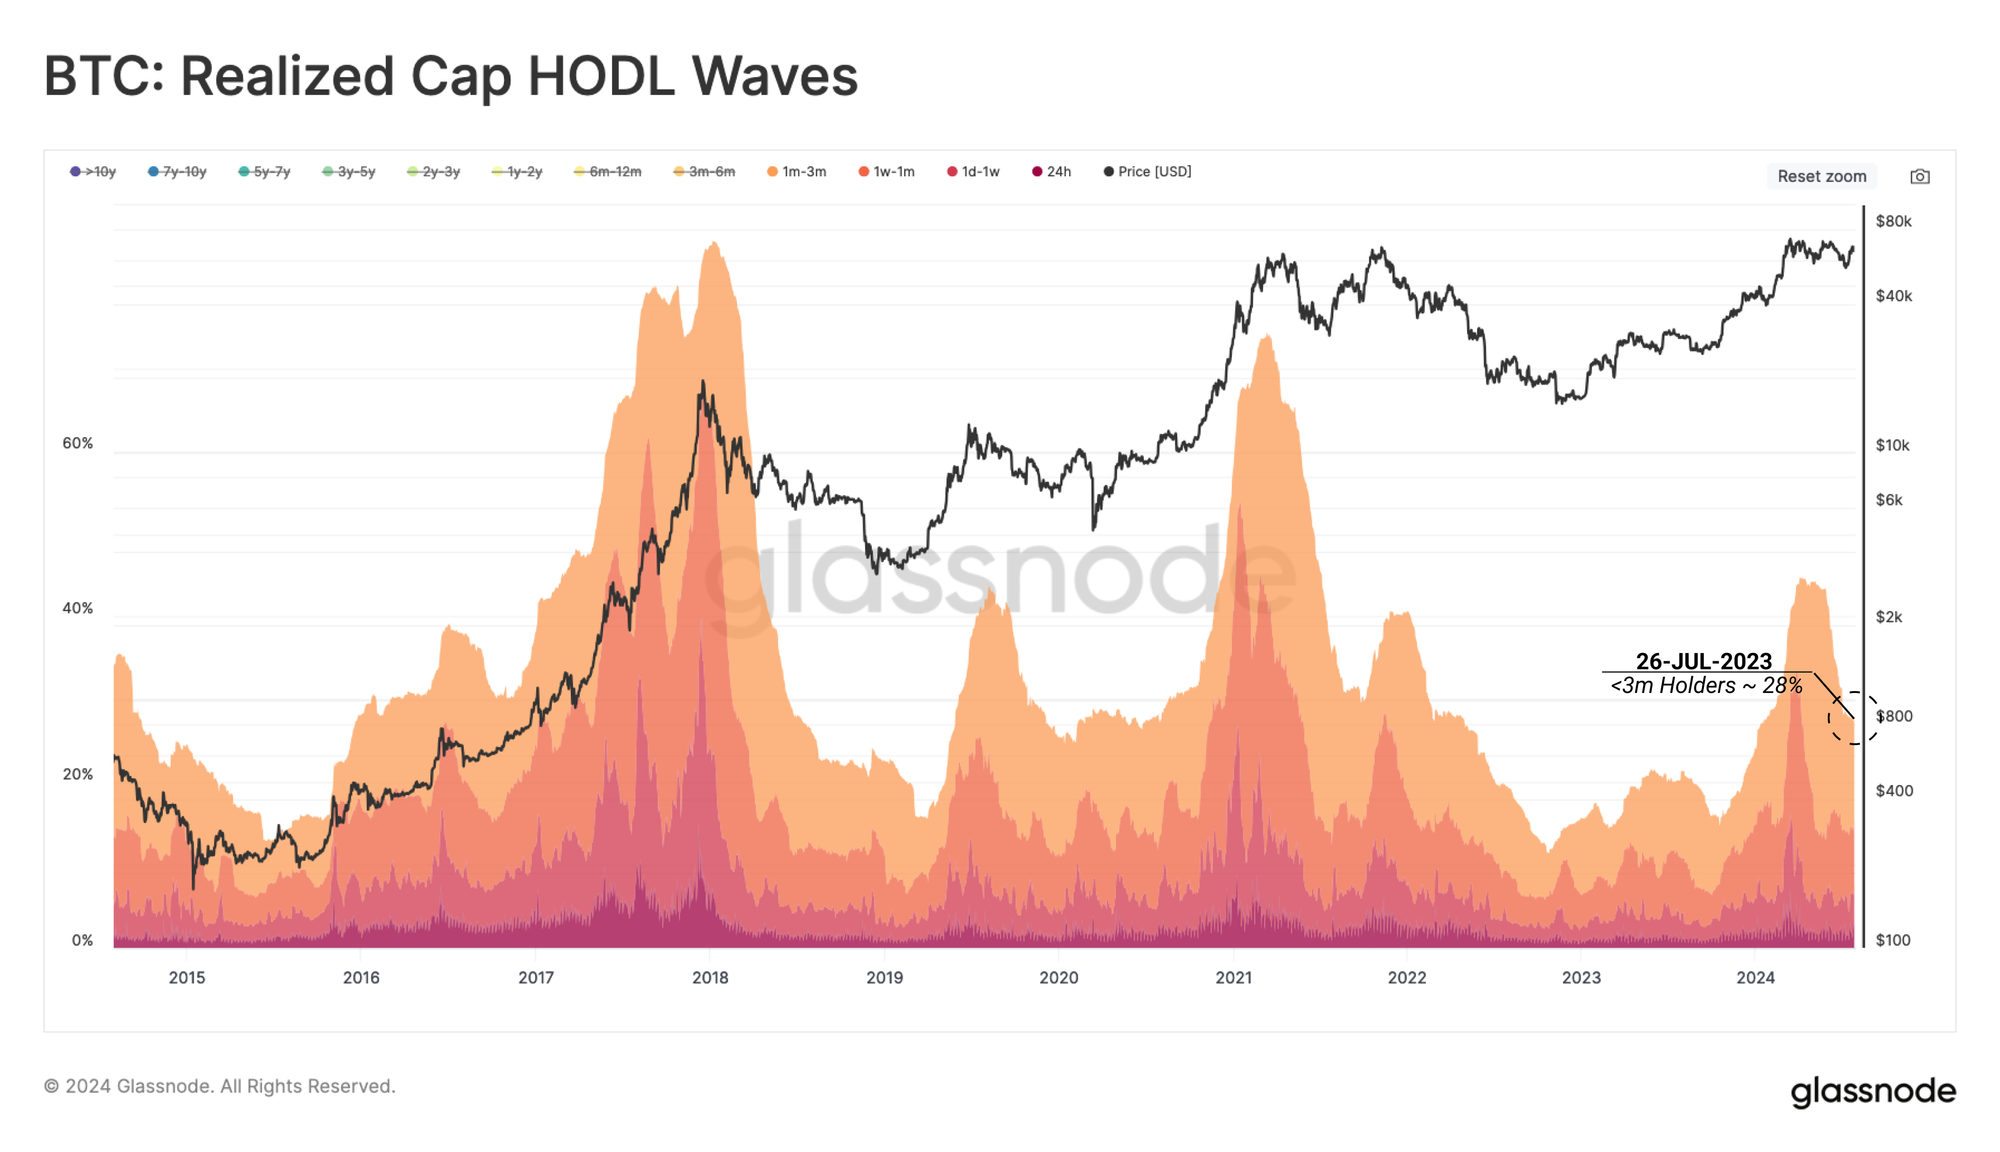
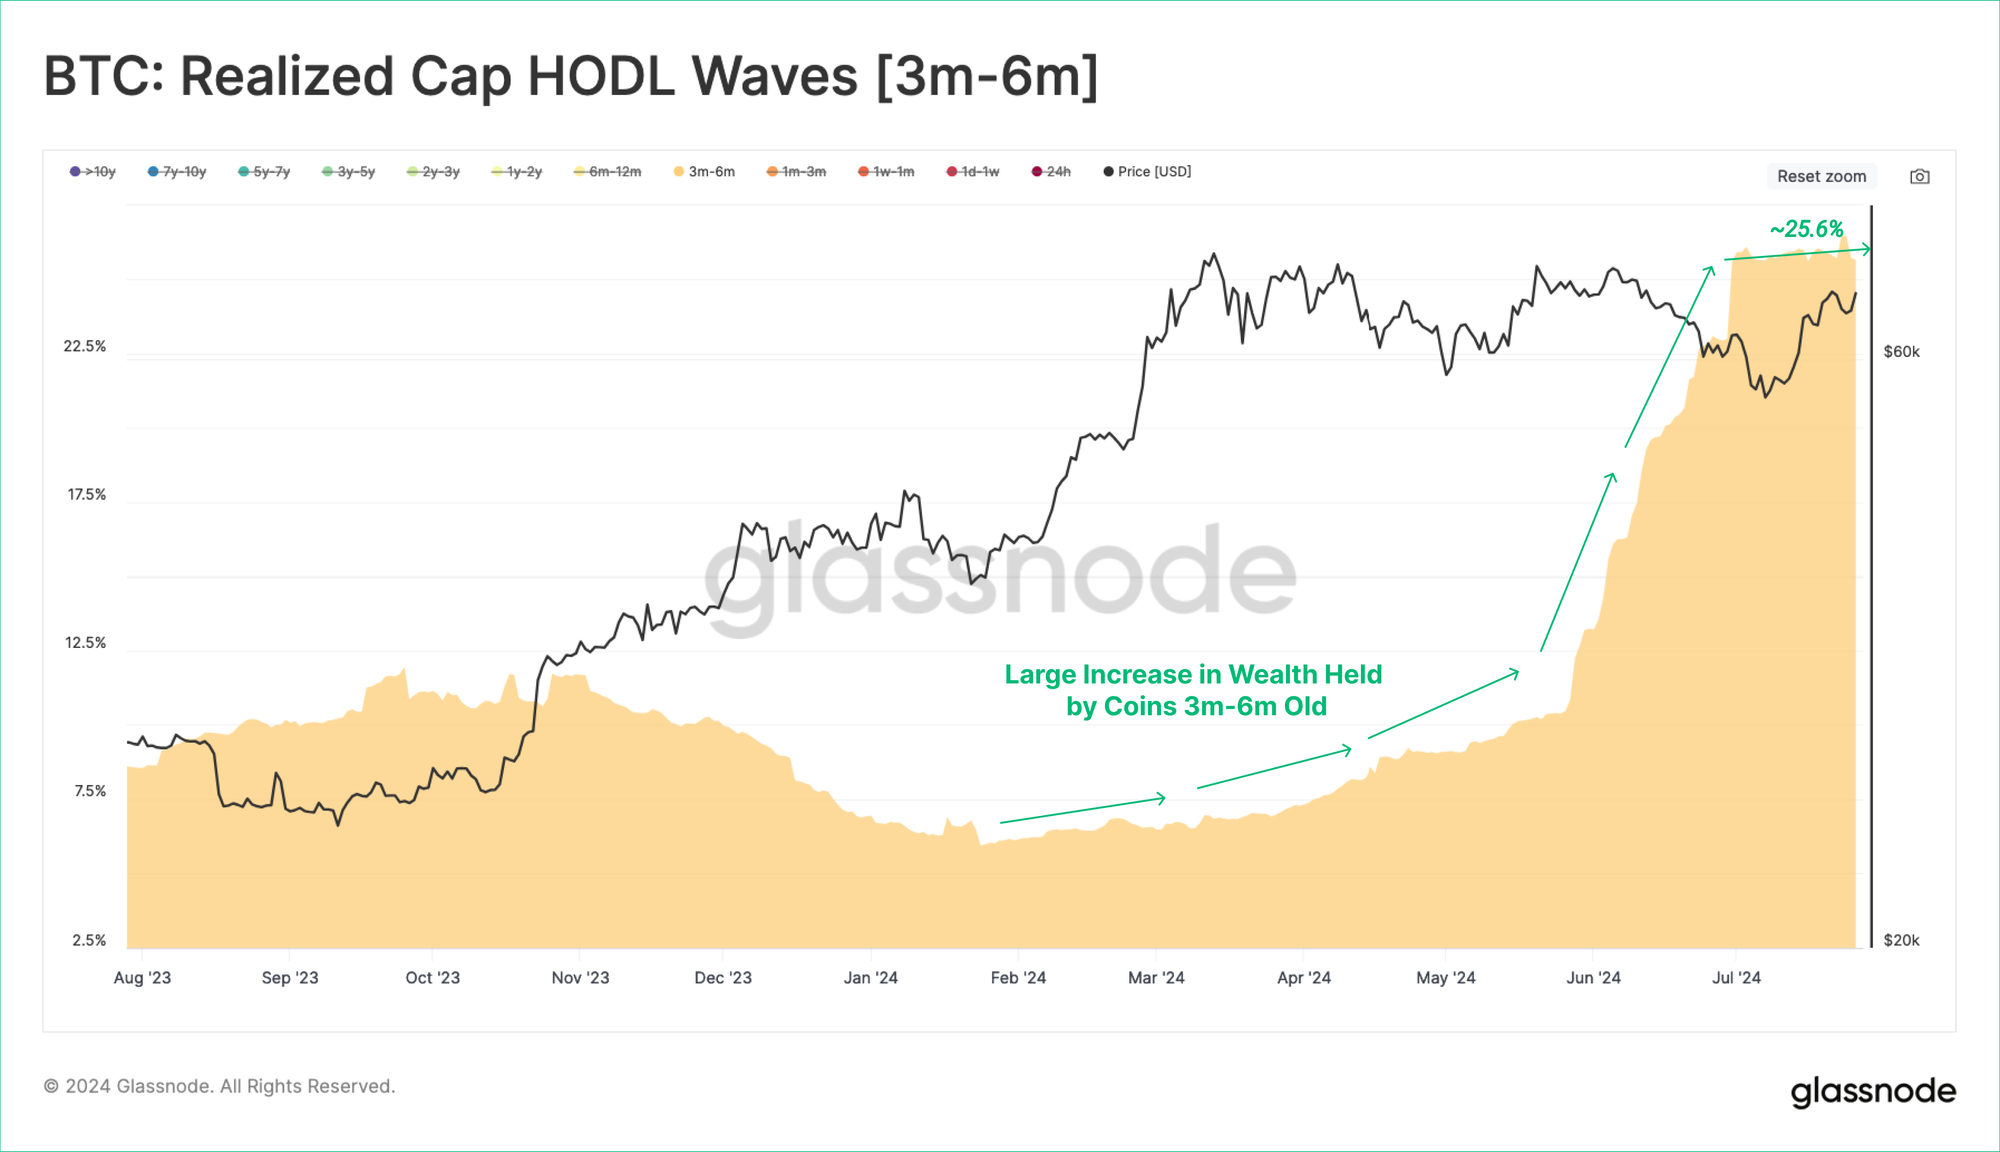
The HODL Wave metric of realized market cap helps us distinguish the USD wealth locked in tokens held over the past three months. This metric allows us to assess the wave of demand from new investor inflows.
The climax of a bull market usually marks the saturation of wealth held by new buyers, which also indicates that long-term holders begin to withdraw their funds in large numbers.
The share of wealth held by new investors is now falling and well below levels seen at macro market peaks. The change highlights a general shift in investor behavior toward long-term holding, even as new market demand has generally slowed since Bitcoin hit an all-time high of $73,000.
If we examine the group that has held tokens for 3-6 months, we see a relatively significant increase in their network wealth, again suggesting that investors who were active at the beginning of the year generally chose to hold their tokens in anticipation of a more mature holding phase.
It follows that long-term holding may be the dominant strategy among short-term holders.
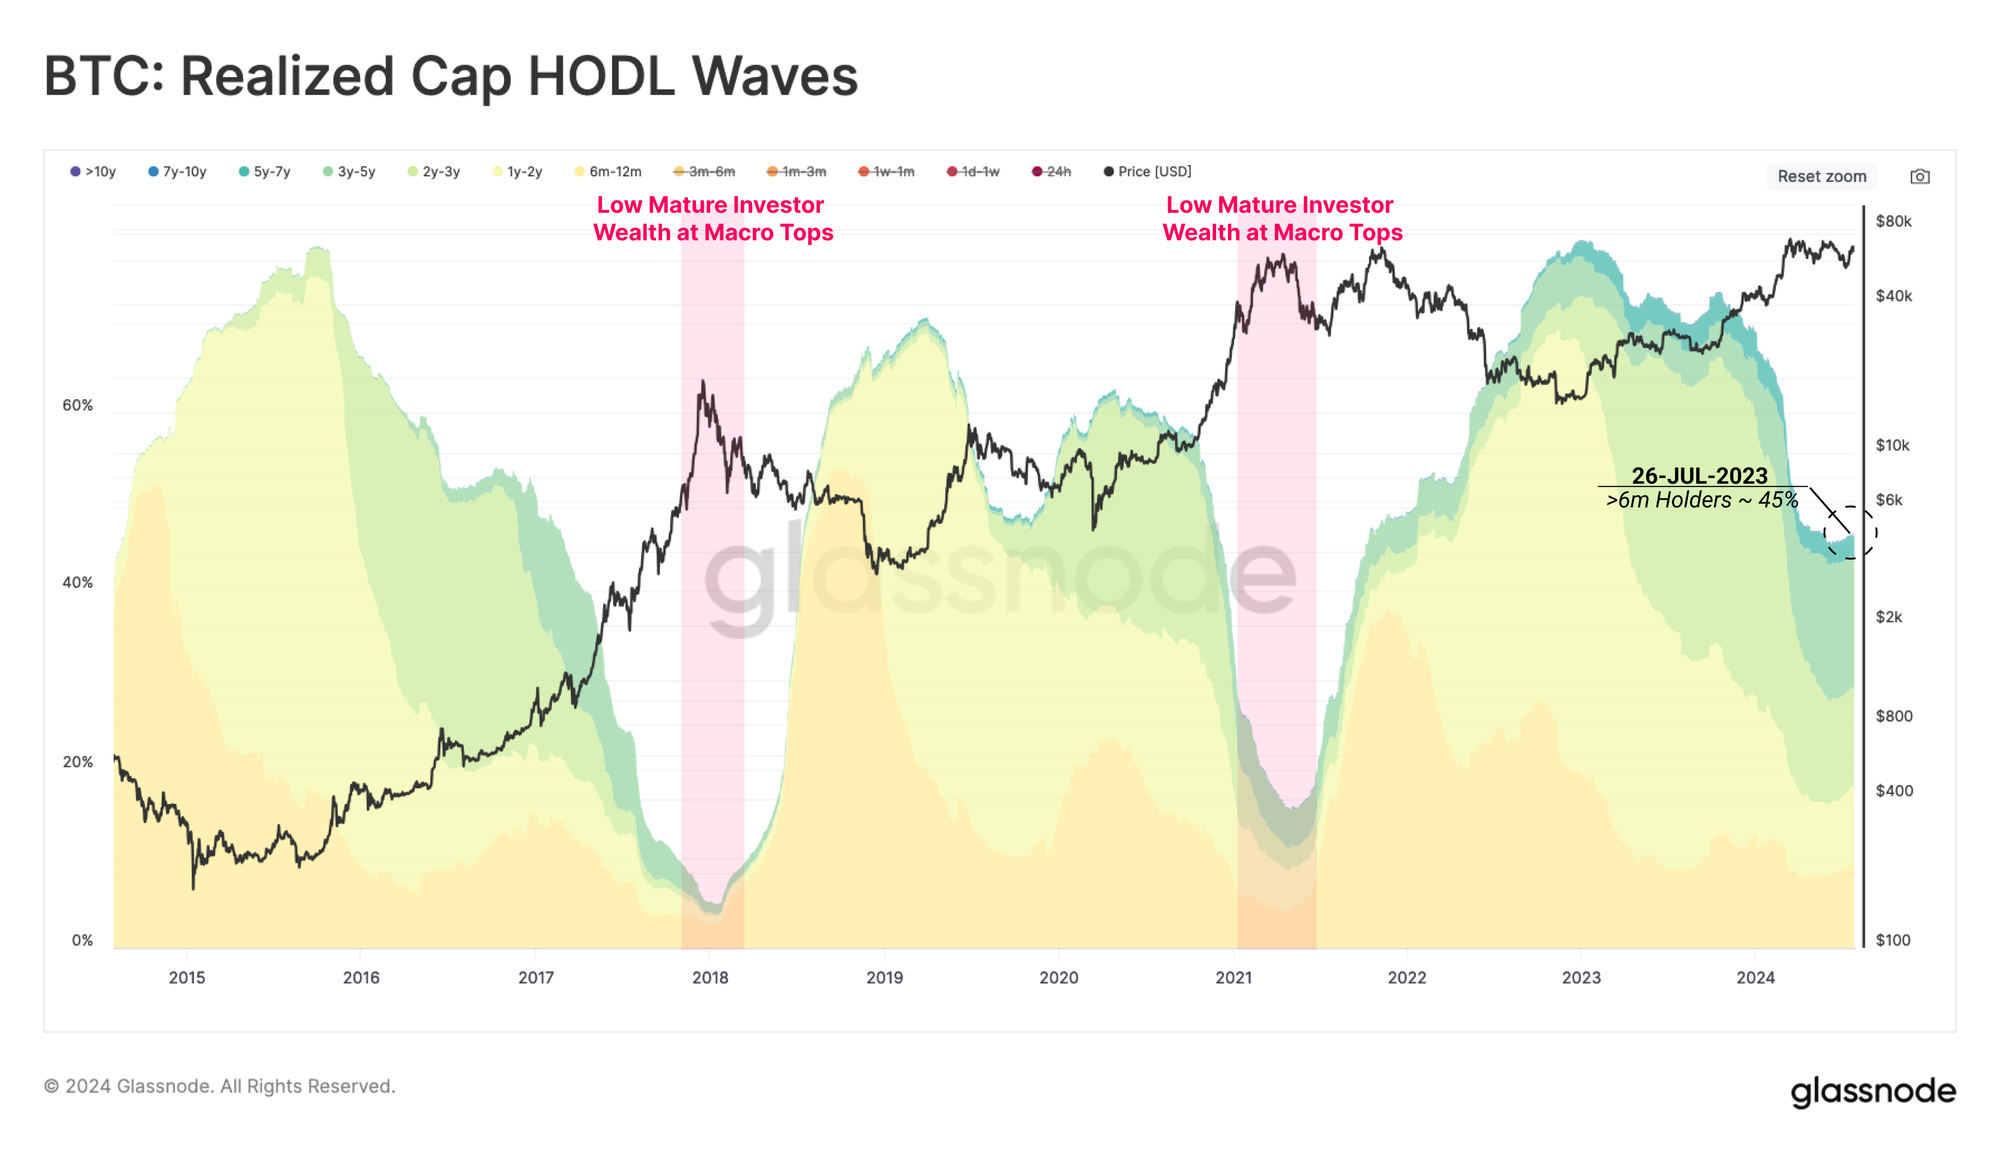
Looking at long-term holders, we can examine the behavior of investors in the supply they acquired six months ago.
Currently, long-term investors hold 45% of network wealth, which is higher than when the macro cycle was near its peak. This emphasizes that long-term holders are holding tokens in HODL mode, which can be seen as patiently waiting for higher prices to turn to market strength.
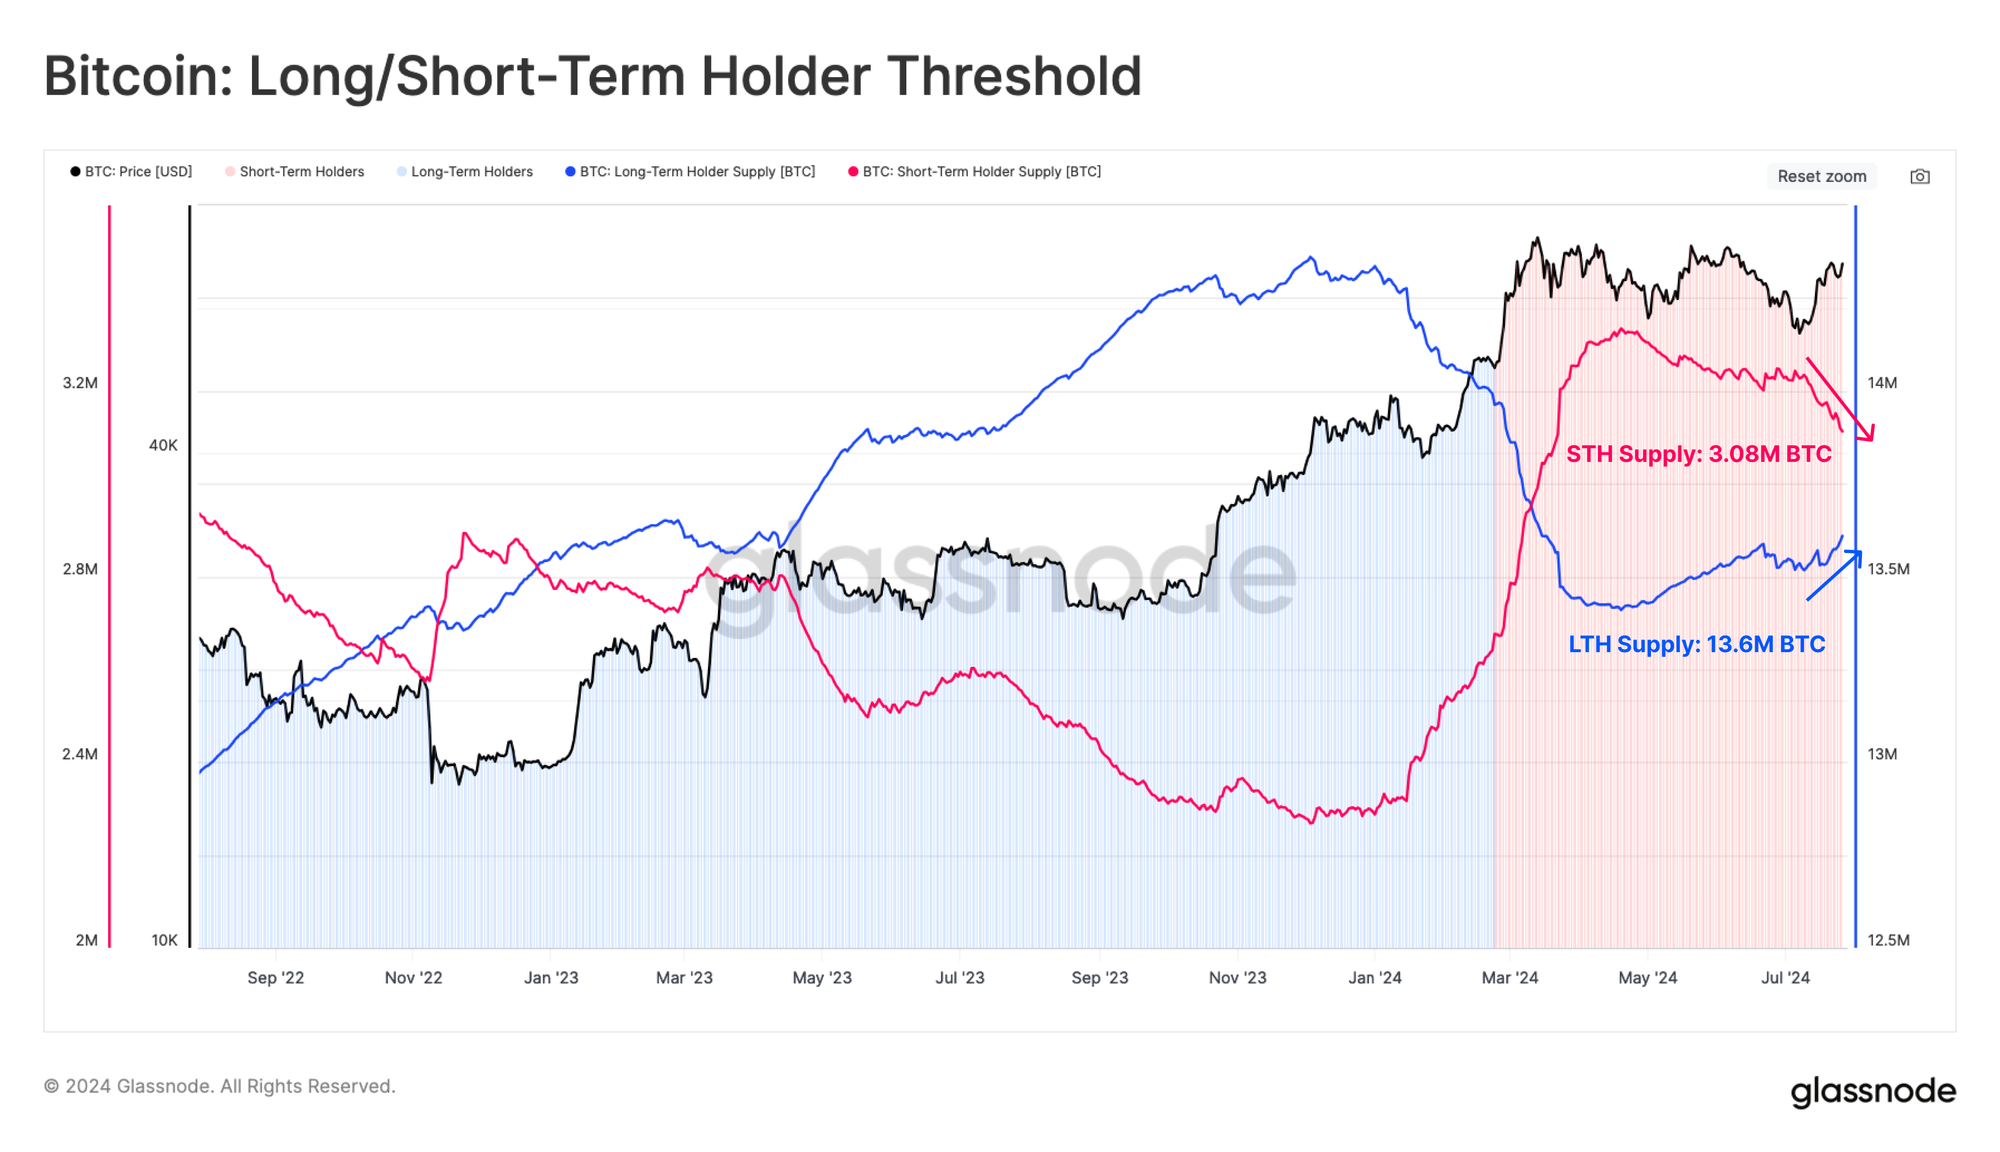
Comparing the total holdings of long-term and short-term holders, we find that a new bifurcation is forming in the market. The supply of long-term holders is increasing, while the supply of short-term holders is decreasing.
The chart below shows the approximate age boundary between LTH and STH for tokens purchased before/after late February 2024, when the price was around $51,000. It is likely that many tokens purchased at the peak of the ETF hype will soon begin to transition to LTH status, and this divergence may accelerate.
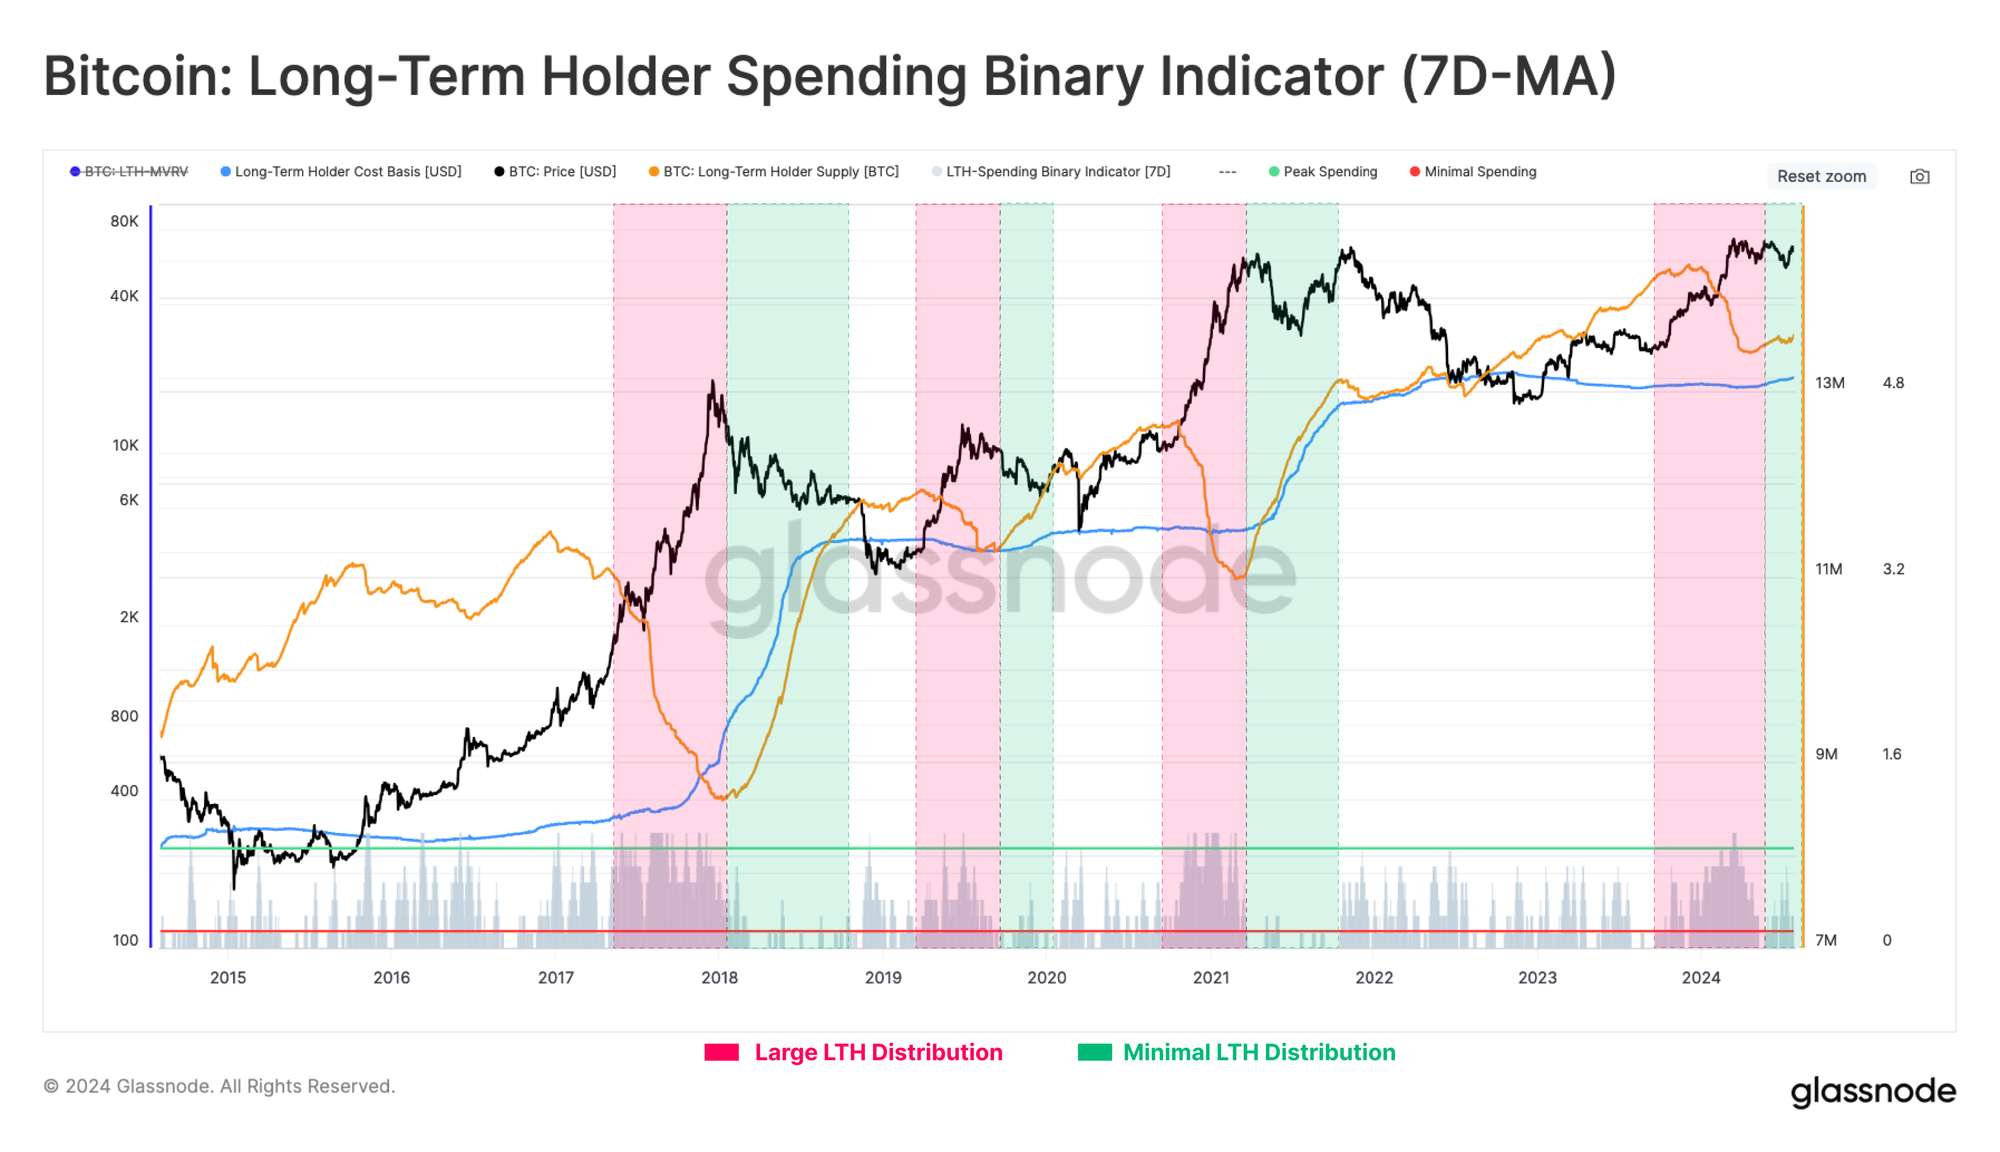
Finally, we can describe and visualize the intensity of HODLer allocation pressure through the binary spending metric of long-term holders (LTH).
Distribution pressure on the LTH cohort remains relatively small and is declining. This further confirms our general view that Bitcoin supply is still dominated by long-term, high-conviction investors. HODLing remains the preferred strategy for the time being.
Summary and Conclusion
Finally, the much-anticipated Mt.Gox distribution has begun, a major victory for creditors who insisted on being repaid in BTC rather than fiat currency. However, given the massive price increase over the past decade, it is foreseeable that the recipients will face some sell-side pressure.
Nonetheless, the identity of the creditors appears to be more skewed toward HODLers or long-term investors, which could mitigate the extent of seller pressure in the coming weeks.
Meanwhile, the balance sheets of long-term holders continue to grow, and the percentage of network wealth they hold remains high compared to previous macro peak events. This suggests that sophisticated investors are still choosing to hold their tokens while waiting for higher prices, and the main market mechanism has shifted to HODLing.


