
Toncoin [TON] maintained its bearish trajectory and declined below the $6 level, with technical indicators showing that strong selling pressure is prevalent. Fibonacci retracement levels could aid the bullish case.
VX:ZLH1156
The $5.8 and $5.36 levels are under heavy scrutiny
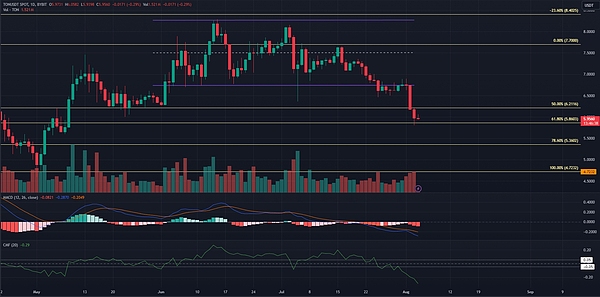
The daily market structure remains bearish. There is a sizeable fair value gap around $6.5. A bounce from this area to chase the liquidation level may be blocked.
Throughout July, the MACD has been trending down and the CMF has fallen to a 4-month low. This shows that TON has been experiencing extreme selling pressure and sustained bearish momentum since its rejection at $7.7.
The 78.6% retracement level of $5.36 could be reached next week. Swing traders hope that by then the downtrend will fade and the market will offer buying opportunities.
Should traders wait for the price to drop further, or buy TON now?
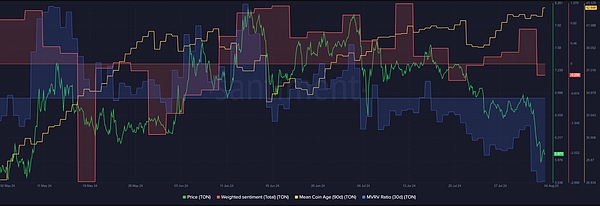
Despite the price drop over the past month, the average coin age has been trending upwards. This is a sign of accumulation across the network.
Meanwhile, the MVRV ratio has fallen to its lowest level since early May. Short-term holders are losing money and the token may be undervalued.
Weighted social sentiment has remained positive until recently, which has boosted confidence. This gives traders a good reason to rely on support at $5.86, or the 61.8% retracement, but buying at this level could be risky.
Pepe [PEPE] was unable to hold the fair value gap as a support zone. It fell directly below the gap and again dropped to a local low of $0.000008. This was the level from which the meme coin rebounded after the early July drop.
Hopefully, the same can happen again. However, a closer look at the liquidation heatmap and position distribution clues suggest that bears will remain dominant for a while.
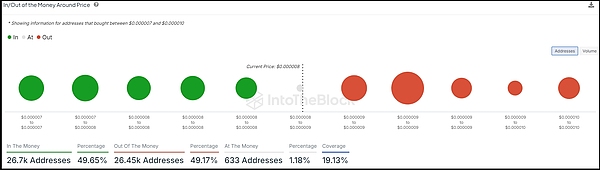
The $0.000008 level remains a solid support
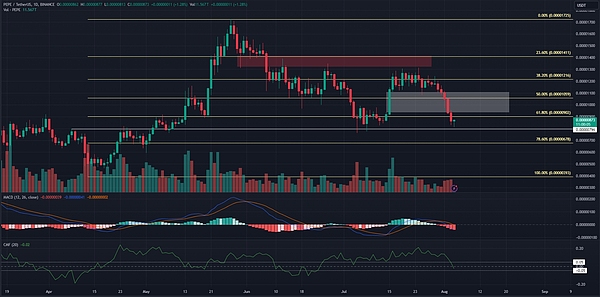
The reasonable value gap (white) left by PEPE during the rally to $0.000013 did little to stop the bearish pressure. The $0.00008 and $0.0000678 levels are the next support levels, with the latter based on the 78.6% retracement of the May rally.
The MACD has fallen below its neutral zero line, but the CMF is just -0.02. Overall, the daily timeframe price chart outlines a bearish bias, but a range could also form between $0.000008 and $0.000013.
The spread around the price also highlights the area around $0.000008 as support.
Reasons why prices could fall further
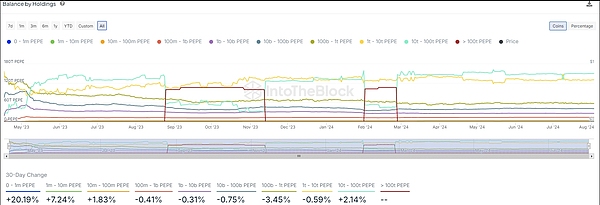
Judging from the 30-day changes in the holding balances of various PEPE holding wallets, whale have been dispersing their holdings, and only a few holders with less than 10 million have increased their holdings of PEPE in the past month.
The rest are selling their tokens, and only the 10 trillion and above group has been accumulating. This highlights the selling pressure over the past 30 days and warns of more losses to come.
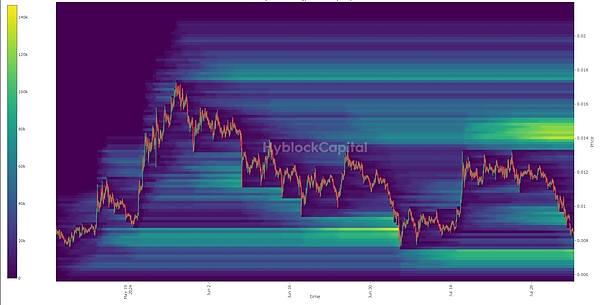
The 3-month liquidation heat map gives a similar warning. Liquidity pools between $0.000009 and $0.00000945 are not enough to reverse the downward trend.
The next zone to watch is $0.00000677-$0.0000074. This coincides with the Fibonacci level of $0.00000678, reinforcing the bearish outlook.
The article ends here. Follow the official account: Web3 Tuanzi for more good articles.
If you want to know more about the crypto and get first-hand cutting-edge information, please feel free to consult me. We have the most professional communication community, publishing market analysis and high-quality potential currency recommendations every day. There is no threshold to join the group, and everyone is welcome to communicate together!
Welcome to join the exchange group →→ VX: ZLH1156


