
Ethereum (ETH) is showing signs of potential decline. Ethereum is currently trading at $2,625, down 3.6% in the past 24 hours. It is difficult to break through the $2,750 resistance level. It is currently consolidating around $2,620 and is still at risk of further decline. And from the perspective of technical analysis and on-chain data, Ethereum is facing more and more bearish signals.
Impact of recent market trends
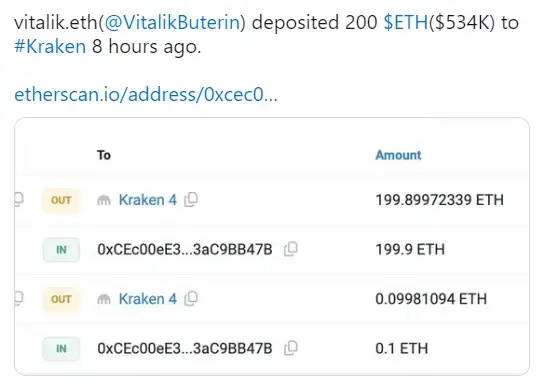
Lookonchain data shows that ETH founder Vitalik Buterin has deposited $534,000 worth of ETH to the Kraken exchange, which may increase selling pressure and lead to a bearish outlook for Ethereum in the coming days. This move may increase selling pressure and further exacerbate the negative outlook for Ethereum in the short term.
Jump Trading, a major player in cryptocurrency trading, has resumed selling large amounts of ETH. On Wednesday, it unloaded more than 17,000 ETH, worth about $46.44 million. The sale is the latest in a series of ETH sales that Jump Trading has conducted since July, during which time Ethereum’s value has fallen significantly.
Jump Trading’s continued selling of ETH has raised concerns about a possible sell-off in the market. While these sell-offs initially had little impact on the price of Ethereum, they have led to Ethereum’s recent drop to the $2,620 range. The ongoing investigation of Jump Trading by the U.S. Commodity Futures Trading Commission (CFTC) could also affect market sentiment, adding to uncertainty.
Adding to market uncertainty, more than $1 billion worth of Tether’s stablecoin USDT was withdrawn from cryptocurrency exchanges, the largest single-day withdrawal since May. Such large-scale withdrawals suggest that investors may be moving funds to safer storage options, possibly in anticipation of expected market volatility.
Resistance levels and technical indicators
The price of Ethereum (ETH) is about to fall as it approaches its critical resistance level of around $2,843. If Ethereum fails to break through this resistance level, it may face a sharp decline, hitting the weekly support level of $2,118. Meanwhile, as of the time of writing, it is trading at $2,625, down 3.6% in the past 24 hours. On-chain data further supports the bearish outlook, which is highlighted by the positive growth of Ethereum exchange flow balance and the decline in development activity.
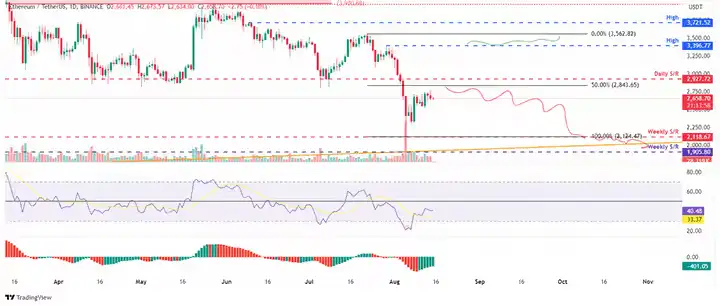
Technical indicators are also showing a bearish trend. On the daily chart, the Relative Strength Index (RSI) and the Awesome Oscillator (AO) are below the neutral levels of 50 and 0, respectively, indicating an impending bearish trend.
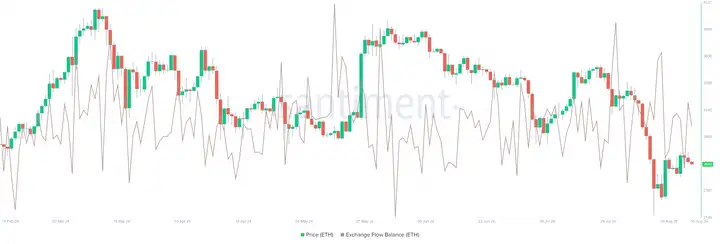
Santiment's ETH trade flow balance shows the net flow of tokens in and out of exchange wallets. A positive value means that more Ethereum tokens are entering exchanges than leaving them, indicating investor selling pressure. Conversely, a negative value means that more ETH is leaving exchanges than entering them, indicating less selling pressure from investors. In the case of Ethereum, the trade flow balance (a measure of the net flow of ETH in and out of exchanges) has recently seen a significant increase from Tuesday to Wednesday. The balance soared from -62,018 to 20,707, reflecting increased selling activity from investors.
Development Activity and Market Sentiment
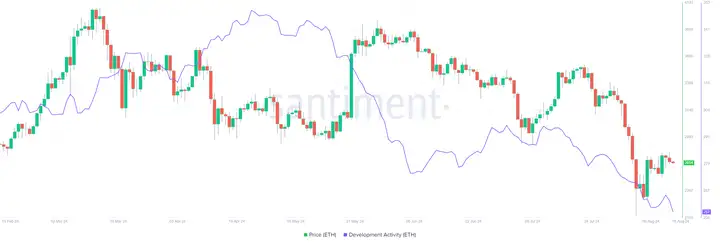
On-chain data shows that Ethereum development activity is declining, suggesting a bearish bias.
Decline in Ethereum development activity. The metric, which measures project development events on GitHub, has been declining, from 265 on Wednesday to 257 on Thursday. This continued decline indicates a steady decline in Ethereum development activity and suggests a bearish price outlook, which could further negatively impact investor sentiment.
Despite the bearish signals from technical analysis and on-chain data, if Ethereum price manages to close above the July 29 high of $3,396, it will set a higher high on the daily chart, potentially resulting in a 5% rally to retest the July 22 high of $3,562. A daily candle close above $3,396 would invalidate the bearish thesis.
In simple terms
As Ethereum price approaches its key resistance level of around $2,843, its price seems to be about to fall. ETH founder Vitalik Buterin deposited $534,000 worth of ETH into the Kraken exchange, exacerbating market volatility and selling pressure. At the same time, on-chain data shows that Ethereum development activity is declining and Ethereum's transaction flow balance has seen a positive surge, suggesting a bearish trend in prices. The increase in selling pressure and market volatility support the short-term bearish outlook. ETH is expected to consolidate and accumulate for a period of time to cope with market volatility. In the long run, when the market recovers, as ETH price tests and breaks through key resistance levels, it is expected to reverse the decline. If the subsequent daily candle chart closes above $3,396, the bearish argument will be invalidated.