At present, the biggest downward trend in this cycle has not yet been fully digested by the market, so investors in the digital asset market are still waiting and watching. But under the surface of the recession, the decision to hold coins for a long time and continue to increase holdings seems to be returning significantly.
summary
After several months of heavy distribution pressure, Bitcoin holders' behavior began to shift towards long-term holding and continued accumulation.
Activity in the spot market suggests that there has been a clear shift towards net sellers recently and this trend is continuing.
Compared with the situation in past cycles when the price of Bitcoin broke through its historical peak, the proportion of assets in the entire network currently held by long-term holders is relatively large.
Overall, on-chain metrics suggest that the community of Bitcoin holders remains confident.
Investors return to holding
Even as the market begins to slowly recover from last week’s sell-off, digital asset investors remain generally hesitant. Even so, when analyzing investor reactions to these turbulent market conditions, we can still see a trend of holding firm beginning to gain momentum among the investor community.
Since Bitcoin hit its all-time high in March, the market has experienced a period of broad supply distribution, with wallets of all sizes participating. But in the past few weeks, this trend has begun to reverse, which is particularly evident among large wallets associated with ETFs. We have noticed that these large wallets appear to be resuming accumulation.
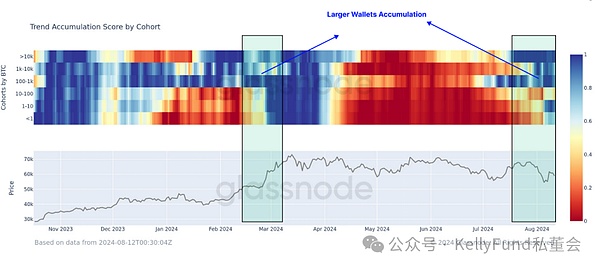
Figure 1: Bitcoin asset accumulation by different investor groups
The Accumulation Trend Score (ATS) indicator evaluates the weighted change of the entire market. Currently, it shows that the dominant behavior in the market is turning into a firm hold on Bitcoin and continued accumulation.
This shift has caused ATS to reach a new high of 1.0 recently, indicating that investors have continued to increase their holdings of Bitcoin over the past month.
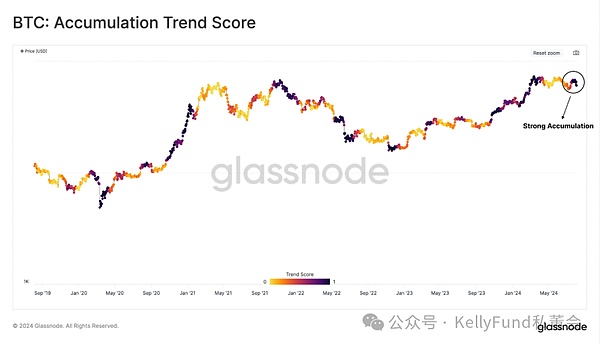
Figure 2: Bitcoin accumulation trend score
This trend is particularly evident among long-term holders - they sold in large quantities before the price of the currency hit an all-time high, but as the market cooled, their investment strategy shifted back to long-term holding. In the past three months, a total of 374,000 bitcoins have been put into a dormant state.
From this, we can infer that holding has become a more mainstream trading strategy for investors than continuing to sell.
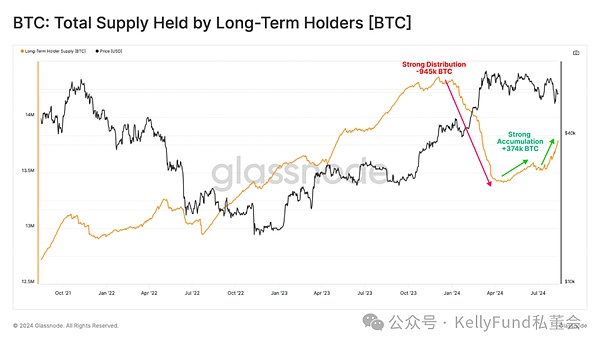
Figure 3: Coin supply held by long-term holders
We can evaluate the 7-day change in long-term holders’ supply as a tool to assess the rate of change in their total balance.
From this we can see that the influence from long-term holders is significant, which is a typical feature of the macro market peak. Since the price of the currency broke through the historical peak in March, the market has encountered greater distribution pressure on less than 1.7% of trading days. Recently, this indicator has returned to positive territory, indicating that long-term holders have begun to firmly continue to hold Bitcoin again.
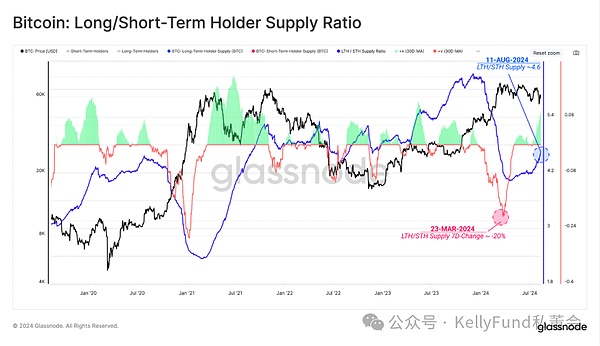
Figure 4: Supply ratio of long/short term holders
The active investor cost basis metric refers to the average transaction price of active Bitcoin in the market, and the spot price has been above this metric since April to July this year.
The cost basis of active investors is a broad indicator of investor bullishness or bearishness. Currently, the market has successfully found support near this level, which shows that the market still has potential, and investors also generally have positive expectations for the market direction in the short to medium term.
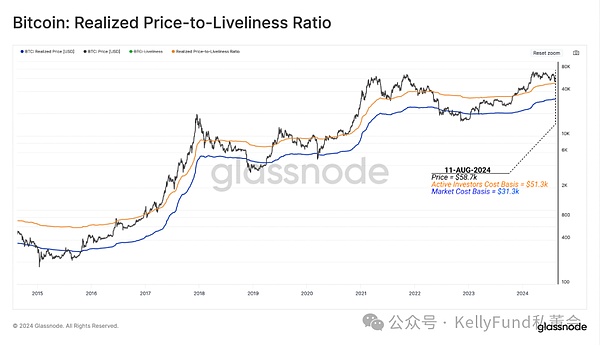
Figure 5: Found Price-Market Activity Ratio
Assessing spot market price bias
When the market is in a technical downtrend, we can use the CVD indicator to assess whether the current buying/selling pressure in the spot market is balanced.
This indicator can also be used to assess the market trend in the mid-cycle and determine whether the price is currently in a tailwind or headwind state. Since the recent highs in Bitcoin prices, we have seen that the market has been on the net selling side.
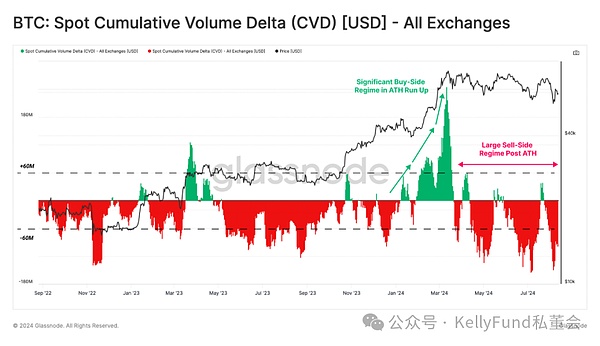
Figure 6: Full trading platform CVD
A positive CVD value indicates that the market is on the net buying side, while a negative value indicates that it is on the net selling side.
When we analyze the annual median spot CVD, we can see that over the past two years this metric has fluctuated between -$22 million and -$50 million, indicating a clear market bias toward net sellers.
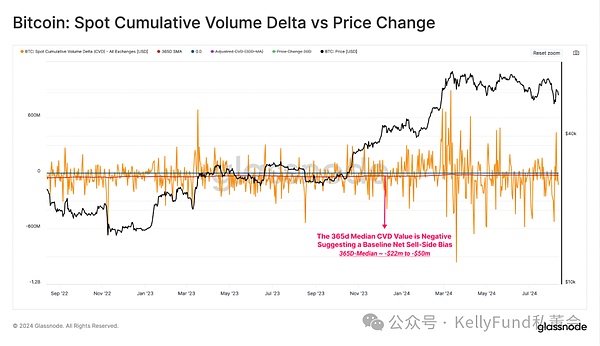
Figure 7: CVD vs Price Change
If we consider this long-standing median as a baseline for CVD equilibrium, we can generate an adjusted metric that corrects for the statistical bias that this prolonged seller’s market may have caused.
If we compare the adjusted spot CVD (30-day simple moving average) with the monthly price change percentage, we will find that the two indicators can confirm each other to a certain extent.
From this perspective, the recent failure of Bitcoin price to break through the $70,000 range can be partially attributed to weak spot demand (adjusted CVD value is negative). We believe that when the adjusted CVD indicator turns positive , it will be the real signal of spot market demand recovery.
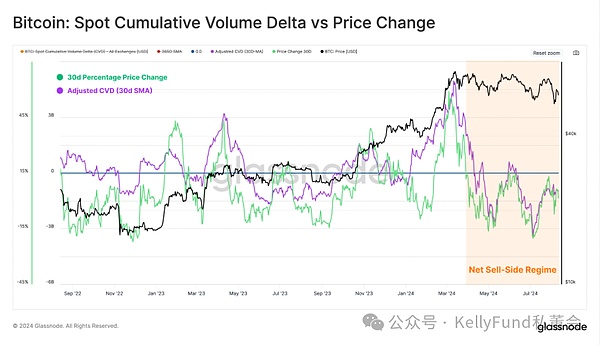
Figure 8: Adjusted CVD (30-day SMA) vs. Price Change
Tracking market cycles
As price action has been largely sideways in recent months, the pressure on long-term holders to allocate has slowed significantly, causing the percentage of network assets they hold to stagnate before recently starting to grow again.
Although they exerted tremendous selling pressure on the market after Bitcoin prices hit new highs, long-term investors are still holding assets at historically high levels compared to previous all-time highs.
This suggests that if the price of Bitcoin appreciates in the future, long-term holders may continue to sell Bitcoin to seek profit. But at the same time, since the price trend has been weak recently and even fell overall, they tend to continue to hold Bitcoin in their hands and wait for appreciation.
Both observations suggest that the community of long-term holders is more resilient and patient in the face of headwinds, despite less than ideal market conditions.
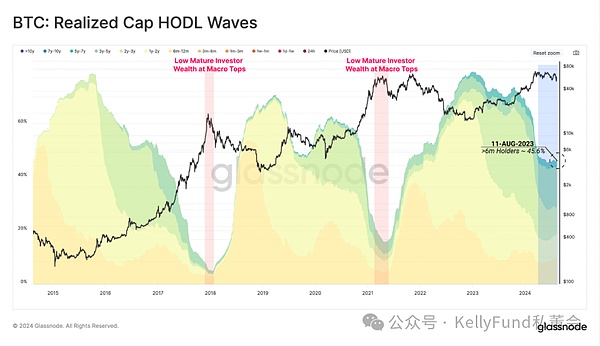
Figure 9: Long-term static band
Finally, we can see that the long-term holders’ sell-side risk ratio also supports our assertion. We use this metric to measure the absolute sum of realized profits and losses locked in by investors, relative to the size of the asset (only the realized market value is calculated). We can think of it in the following framework:
High values for this indicator indicate that when investors sold their bitcoins, they made a lot of money or a lot of money relative to their cost basis. This situation indicates that the market is in urgent need of re-balancing, which usually occurs after a sharp price movement.
A low value for this indicator means that investors are neither making a profit nor a loss on their coins. This usually means that the "profit and loss potential" within the current price range has been exhausted, which means that the current market is basically stagnant.
Compared to the previous times when prices broke through all-time highs, the seller risk ratio of long-term holders is still at a lower level at present. This means that the profit margin obtained by their group is relatively small compared with previous market cycles. In other words, they are still waiting for prices to rise before taking action and making a lot of money.
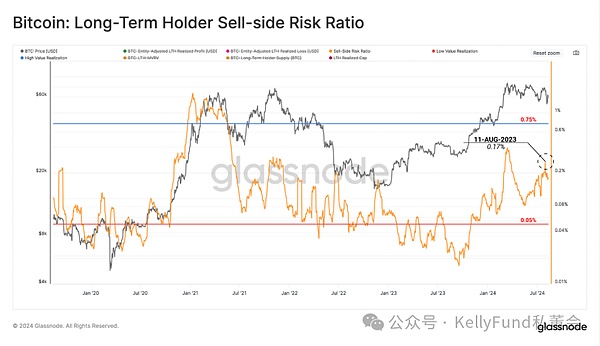
Figure 10: Sell-side risk ratio for long-term holders
Summarize
Despite the volatile and challenging market environment, long-term holders’ confidence remains steadfast and they continue to seize opportunities to increase their Bitcoin holdings.
Compared to the previous cycle highs, they hold a higher percentage of Bitcoin, which shows that they are waiting for higher prices with amazing patience. In addition, they did not panic sell Bitcoin when the price dropped sharply during the cycle, which fully shows that they are still optimistic and firm in their belief in the future of Bitcoin.


