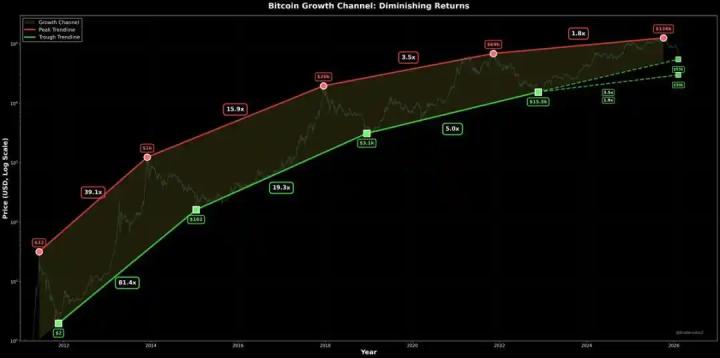
Bitcoin's performance has been relatively weak recently, falling more than 20% since it hit an all-time high of $73,000 in March this year. However, most investors have not been discouraged and have continued to hold Bitcoin firmly. Since most investors entered the market at high points, more than 80% of short-term Bitcoin holders are currently at a loss. Once a panic sell-off breaks out in the market, short-term holders may cut their losses and the price of Bitcoin may fall further.
Several key issues to watch out for this week include the July Federal Open Market Committee (FOMC) meeting minutes to be released on Wednesday. The meeting may provide more signals on whether the Fed will cut interest rates in September. If the minutes are dovish, it will strengthen the expectation of a September rate cut. At 10 p.m. on Friday (23rd), Powell will attend the Jackson Hole Global Central Bank Annual Meeting and deliver a keynote speech on the economic outlook. This happens to be a critical moment before the U.S. Federal Reserve cuts interest rates, so the monetary policy information he releases is of great concern.
Around 8 pm on Sunday, Bitcoin once broke through the $60,000 mark and reached a high of $60,250, but then selling pressure emerged and it fluctuated around $59,000 for several hours. It began to fall rapidly after 7 am this morning, falling to a low of $57,800. As of the time of writing, the price was $58,900, and almost all the gains over the weekend were lost. At present, if it fails to hold last week's low of $56,200, it may fall further to $54,100.
Bitcoin four-hour chart

First of all, according to the Bollinger Band indicator in the Bitcoin 4H level chart, the price of Bitcoin is running between the middle and lower tracks of the Bollinger Band, indicating that the market is currently in a bearish trend. At the same time, the Bollinger Band opening is narrow, indicating that the market volatility is decreasing. If the price fails to effectively break through and stabilize the middle track, it may continue to fall.
Secondly, according to the KDJ indicator in the Bitcoin 4H level chart, the current KDJ three-line value is hovering in the low oversold area, and has a trend of turning upward. If the K-line value breaks through the D-line value upward to form a golden cross state, then there will be an opportunity for a rebound in the short term.
Finally, according to the MACD indicator in the Bitcoin 4H level chart, both the DIF line and the DEA line are running below the 0 axis, showing that the overall market is in a weak position. The MACD green bar chart has shortened, indicating that the short-selling force has weakened. If the DIF line can cross the DEA line upward to form a golden cross, there may be a short-term rebound. If it continues to remain below the 0 axis and continues to decline, it means that the bears are still dominant and prices will continue to fall.
Bitcoin one-hour chart

First of all, according to the Bollinger Band indicator in the Bitcoin 1H level chart, the price of Bitcoin rebounded upward from the lower track of the Bollinger Band and approached the middle track, indicating that there is buying support in the short term. The Bollinger Band opening is narrow, indicating that market volatility is reduced and it may encounter resistance near the middle track. If the price can effectively break through the middle track and continue to rise, it may continue to test the resistance near the upper track. On the contrary, if the price fails to effectively break through the middle track, it will fall again.
Secondly, according to the KDJ indicator in the Bitcoin 1H level chart, the KDJ indicator shows that the market sentiment is biased towards several levels in the short term, and the K-line value and the D-line value form a golden cross upward, indicating that there is room for further increases in the short term, but the J-line value is already in the overbought area, and we need to be alert to the risk of a short-term pullback.
Finally, according to the MACD indicator in the Bitcoin 1H level chart, the DIF line and the DEA line are running below the 0 axis, indicating that the overall market is in a weak state. The MACD histogram turns from green to red, indicating that the short-selling force has weakened. If the DIF line and the DEA line can continue to move upward and form a golden cross, a rebound will be ushered in.
Comprehensive analysis shows that Bitcoin shows a trend of consolidation on the 4-hour chart. It is currently near the middle track of the Bollinger Band, and the market direction is unclear. MACD and KDJ indicators show that there are certain rebound opportunities in the market, but overall, we still need to pay attention to whether there is obvious bullish power to push the price to break through the upper track of the Bollinger Band. Bitcoin shows signs of a short-term rebound on the 1-hour chart. The price is close to the middle track of the Bollinger Band. MACD may form a golden cross. The KDJ indicator also shows that the market may rise further in the short term.
To sum up, the following suggestions are given for reference
Bitcoin rebounds to below 58,800 and goes short, with a target of 57,600-57,200 and a defense of 59,200.
Writing time: (2024-08-19, 21:00)
(Text-Daxian Talks about Coins)


