

Although Bitcoin failed to close above the psychological level of $60,000 on the weekly chart, long-term holders (LTH) continue to adopt a bullish strategy in 2024.

Bitcoin $60,737
The price closed below the 200-day exponential moving average (EMA) for the second week in a row, but has bounced back above $60,000 in the past 24 hours. Several charts suggest that long-term holders are not deterred by the current price action. Is a bullish breakout possible after August?
Bitcoin long-term holders reach $3 billion cap
The BTC price has closed below the 200-day moving average only three times in 2024. As shown in the chart below, July 4 marked the first close below the 200-day moving average.
The Bitcoin/USD pair has regained its position above the moving average in less than ten days. This time, it took the asset less than 24 hours to get back above the indicator, confirming that bullish momentum is slowly picking up this week.
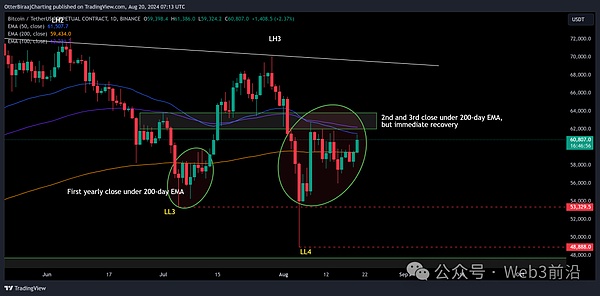
BTC/USD 1-day chart. Source: TradingView
Bitcoin investors can be divided into short-term holders (STH) and long-term holders (LTH). They have different trading strategies and time preferences.
STHs are investors or traders who engage in day trading or scalping, focusing on making quick returns in a relatively short period of time. Many of them are retail or low to medium net worth individuals or entities.
On the other hand, LTH is made up of traders who adopt a long-term buy-and-hold strategy of at least six months. Many of these entities represent high net worth individuals or large organizations, especially in the era of Bitcoin ETFs.
Recent data shows that LTH’s realized market capitalization change recorded a positive net value of $3 billion, which was previously observed in December 2023.
Bitcoin Realized Cap is the cumulative sum of all realized profits minus realized losses. In other words, the total value that has flowed into on-chain Bitcoin, minus the capital that has flowed out due to losses.
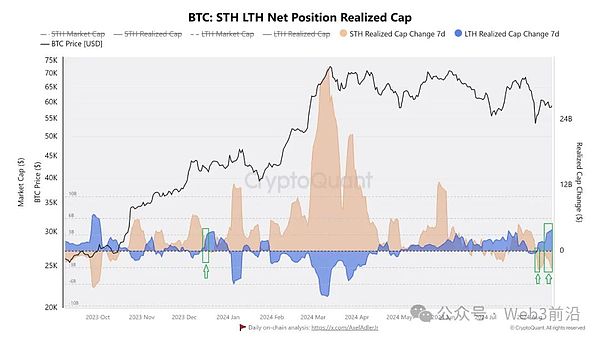
The net position of long-term Bitcoin holders has reached its upper limit. Source: Crypto Quant
Cryptocurrency analyst Amr Taha highlighted the aforementioned changes in realized market capitalization, saying:
When STH increases sales, it indicates that LTH continues to accumulate and STH is being sold at worse prices.
BTC miners’ selling pressure flattens
Bitcoin miners have been selling BTC through exchanges as net flows declined in the second quarter of 2024. However, selling pressure has leveled off over the past two weeks as miner reserves began to show signs of a reversal in the accumulation trend.
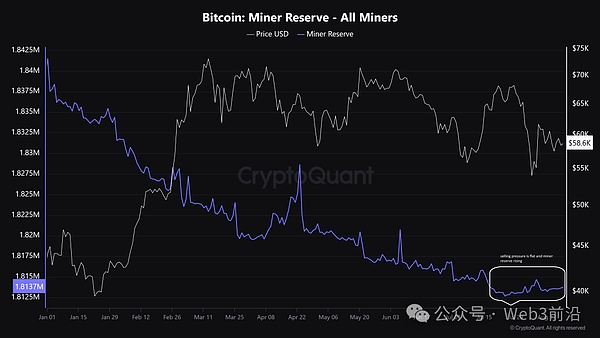
Bitcoin miner reserves. Source: Crypto Quant
The chart shows that miner selling pressure has dropped significantly in August, suggesting that BTC could stabilize in its current price range before next month.
Stablecoin supply ratios leaning bullish
One of the key reasons to be bullish on Bitcoin is that global liquidity is starting to increase, namely the global M2 money supply.
Similar to global liquidity, the Stablecoin Supply Ratio (SSR) also indicates how much liquidity there is in stablecoins that can be used to purchase Bitcoin.
The SSR is defined as the ratio of the total market capitalization of cryptocurrencies to the total market capitalization of all stablecoins. A falling ratio indicates that the supply of stablecoins is increasing while the market capitalization is lagging, meaning that more liquidity is available to purchase assets.
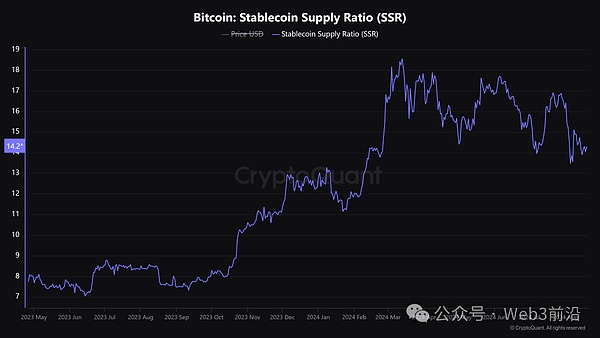
Stablecoin Supply Ratio or SSR chart. Source: CryptoQuant
Currently, the SSR ratio has dropped to the level of early February 2024, which means there is a lot of liquidity in the market that could trigger a rebound.
Julio Moreno, head of research at CryptoQuant, also pointed out the same development, highlighting that the total stablecoin market capitalization has reached an all-time high of $165 billion. He added, “This means that there is more liquidity in the cryptocurrency market.”
BTC price approaches ‘ChoCH’ level above $62K
After a disappointing weekly close, Bitcoin has seen a bullish recovery with a return of 4.50% over the past two days. Currently, Bitcoin is attempting to break out of a descending channel pattern, which could have a bullish impact.
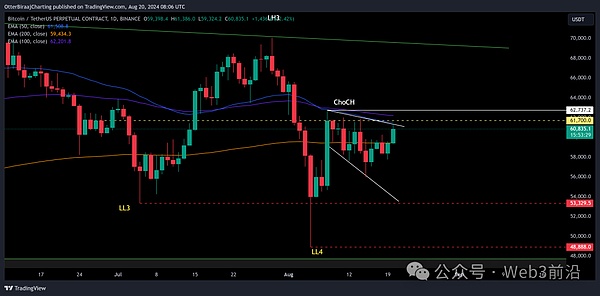
BTC/USD 1-day chart. Source: TradingView
However, Bitcoin faces stiff resistance above the pattern at $61,700. The confluence of the 50-day and 100-day moving averages is also located around this price point, which suggests that it can continue to deny a bullish breakout.
If Bitcoin can break above the collective resistance provided by the EMAs and $61,700, a bullish reversal would be confirmed when BTC breaks above $62,737 in September, which could lead to a market signal called “ChoCH” or “Change of Character” – a sign of a trend reversal.


