

Highlights of this issue :
1. Coinbase spot trend may determine the return of the bull market
2. High-yield strategy of stablecoins
01
X Viewpoint
1. Crypto Monkey (@monkeyjiang): The late stage of the crypto bull market is coming
(1) I think this should be the most brutal bull market that retail investors have ever experienced. Altcoin are bleeding profusely, and many have returned to the lowest point of the bear market. This has never happened in any previous bull market.
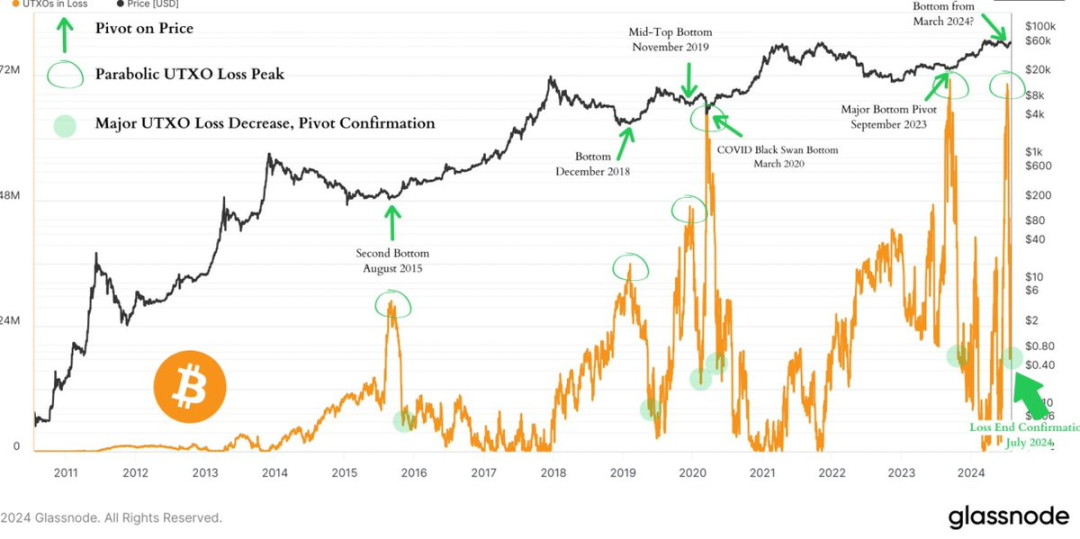
(2) The following chart shows that according to the UTXO account model, during the local lows of Bitcoin during this period, the number of losing trading accounts has been soaring, at the extreme level of the bottom of the bear market cycle, the black swan and the major bullish pivot point. Just like September 2023, consistent with the COVID black swan in 2020, look at the price trend after the green arrow, which belongs to the stage of a big market.
(3) A few days ago, Cathie Wood said that we are in the middle of the bull market and will enter the final stage. The final stage is the stage of rapid price growth. This is consistent with Monkey King’s previous view, so there is no other way but to wait.
(4) We hold Shanzhai stocks and are now numb. We are not interested in any market news, whether it is bullish or bearish. This sentiment is exactly the same as the bottom area of the big bear market.
(5) In fact, the trend of Bitcoin has been very good. It has been up from 52 and the bottom is slowly rising. The difficulty lies in the copycats, which are completely weak and follow the BTC. However, we have survived until now, and it would be unprofitable for everyone to give up.
There is a high probability that there will be a loosening of liquidity in September this year. Over the years, most of the counterfeit markets started in October. Sure enough, it has come to this step again. There are still two months left in October. Perhaps the market will start to react in mid-September. According to today’s picture content, dawn is finally coming.
It's too hard, brothers. I didn't even have such a hard time in the bear market. The magnitude and duration of the pullback are only one aspect. What's more hard is the process of re-recognizing the crypto bull market, which is the same for everyone.
It can be seen that every stage in the future will be new and unprecedented. We must be more cautious in playing the market in the future and redefine bull and bear markets.
2. Phyrex (@Phyrex_Ni): The price of ETH will be better in the future
Unfortunately, today the data on the official website and the capital statistics are again opposite. I know that many of you have seen the capital data showing that #ETH spot ETF had its second positive inflow on the previous trading day. In fact, judging from the data given by the official website, it is still a net outflow, but this time the net outflow is the lowest point in history, with only 403 ETH flowing out.
Compared with yesterday's data, there is not much change in the two funds of Grayscale. $ETHE has indeed shown signs of slowing down the selling, and has left nearly 25% of ETH so far, and has begun to enter a stable period. Mini's $ETH has also begun to absorb more ETH. This data should be the part of ETHE transferred to ETH.
BlackRock is the main reason for the reduction in net outflows. I saw the news early this morning that BlackRock also bought a large amount of ETFs when #BTC fell. The same is true for ETH. I don’t know how BlackRock educates its users. As long as the price falls, they will buy a large amount.
On the other hand, we can see that even when the price fell yesterday, the institutions of the ETH spot ETF showed no signs of leaving the market except for ETHE. We have also seen this situation with BTC, which means that some investors are still optimistic about the future trend of ETH even if they feel that the current price is not attractive, and are unwilling to leave the market in a hurry.
In simple terms, most of the investors in ETH spot ETF believe that the price of ETH will perform better in the future.
3. Crypto_Painter (@CryptoPainter_X) Pay attention to the Coinbase spot trend, which may determine the return of the bull market
Comparison of the trading volume between CB and BN perpetual, pay attention to the different performances before and after the V-reversal last night;
There are some subtle differences, here are what I noticed:
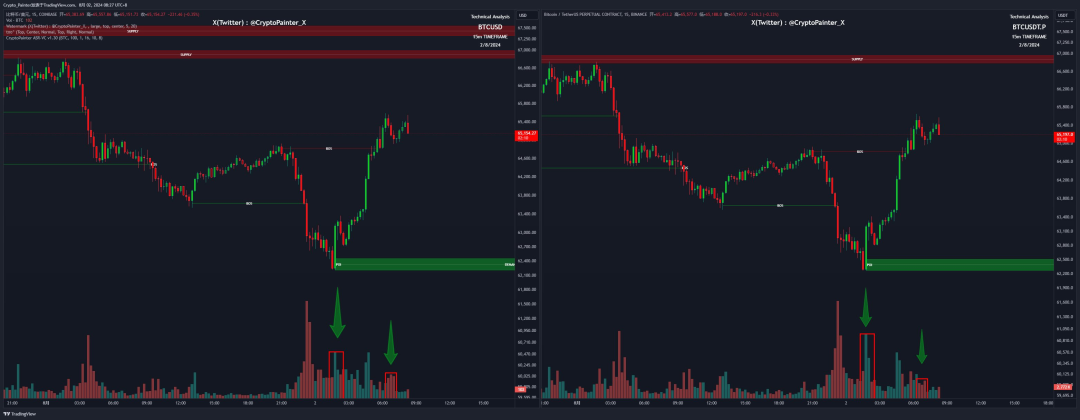
1. The bottoming out of 62,300 was pulled up by futures, which is the starting point of the entire V-reversal;
2. CB’s trading volume entered the market only after the price broke through 63,300.
3. At the beginning of the market crash, CB showed a proportional increase in volume, not in terms of total volume, but in proportion to the subsequent market conditions;
4. After the price rebounded, the short liquidity above 65,000 was completely liquidated. In the first small correction, CB once again increased its volume in excess of the proportion, while BN futures decreased its volume;
Conclusion: It seems that the spot supply of CB has been increasing slightly, but since the current market is completely dominated by futures, the price will continue to move to the high liquidity area, but the slight decline in each high point is due to the continuous small selling pressure at the spot level, which consumes the upward momentum at the futures level;
Therefore, if we want to return to the 70,000 mark, it is not enough to rely on futures buying. After all, as long as the position reaches the high end of the range, it will face spontaneous liquidation, and only spot can do it. When we see CB spot start to lead the rise, the bull market will start again. As for the moment, the spot is a bit lagging behind, which makes people feel that this is not a bull market but a bull market.
02
On-chain data
Embers: Crypto market plummets, crypto whale sell overnight
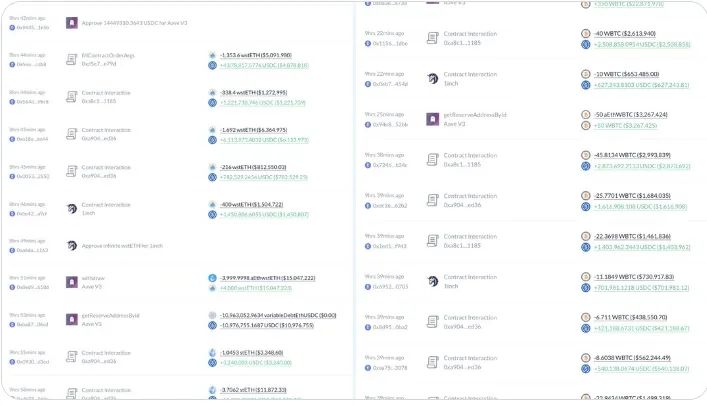
When the market fell last night, a whale sold 15,444 ETH and 193.4 WBTC on the chain in exchange for 59.98 million USDC to repay loans and clear leverage.
◎Sold 15,444 ETH in exchange for 47.84 million USDC, selling price $3,098;
◎Sold 193.4 WBTC in exchange for 12.13 million USDC, selling price $62,742.
◎Then repaid the 59.31 million USDC loan on Aave.
He now holds 16,082 ETH ($51.1M) and 550 WBTC ($35.86M) after fully unleveraging.
address:
0xb267bbd1c3b0ceafd7e240b192d56c94353b9cfc
0xa923b13270f8622b5d5960634200dc4302b7611e
03
Sector Interpretation
According to Coinmarketcap data, the top five currencies in terms of 24-hour popularity are BTC, SOL, ETH, PEPE, and NOT. According to Coingecko data, in the crypto market, the top five sectors with the highest growth are Asset Management, Base Ecosystem, Ethereum Ecosystem, PolkaFoundry Red Kite, and Events.
Focus: Risk aversion rises, BTC hits $62,000 intraday
Financial markets were sold off on Thursday, with cryptocurrencies and U.S. stocks falling sharply. The number of first-time unemployment claims in the United States rose to a one-year high, indicating that the labor market continued to cool. Data from the U.S. Department of Labor showed that the number of first-time unemployment claims was 249,000 in the week ending July 27, up from 235,000 in the previous week, the highest level since August 2023.
In addition, the U.S. manufacturing sector shrank by the most in eight months, with the ISM manufacturing PMI at 46.8 in July, down from 48.5 in June and the lowest level since November 2023. Weaker-than-expected economic data, coupled with the sell-off of chip stocks such as Nvidia, offset the market's optimism after Powell hinted at a rate cut in September yesterday. As of the close of the day, the S&P, Dow Jones and Nasdaq all closed lower, down 1.37%, 1.21% and 2.30% respectively. The U.S. 10-year Treasury yield fell 12 basis points to 3.98%, the first time the 10-year Treasury yield has fallen below 4% since February. The U.S. dollar index rose 0.38% to 104.351 points.
Prior to Thursday’s drop, analysts at Kraken noticed a bullish divergence on the Bitcoin chart, suggesting BTC could soon challenge its all-time highs.
Whether this analysis holds true in the long term remains to be seen, as Thursday’s sell-off caused Bitcoin’s price to fall back below the 50-day and 200-day EMAs (as shown in the chart above). Kraken analysts said: “BTC appears to be on track to test the previous all-time high (ATH) of $73,666. Although it briefly fell below the 200-day exponential moving average (EMA) and the low of $56,378 in early July, there was no follow-through. BTC managed to reclaim the 200-day EMA, forming a bullish divergence on the relative strength index (RSI). Since then, BTC has reclaimed the 21-day and 50-day MAs, indicating a clear bullish trend.”
Despite Thursday’s sell-off, industry analysts agree that the outlook for the cryptocurrency market is improving amid calls for Bitcoin to be designated a strategic reserve asset similar to gold.
John Haar, Managing Director of Swan Bitcoin, said: "Both gold and Bitcoin are monetary assets with limited supply. As such, they tend to react similarly to broader macroeconomic events and trends. With gold's current total market capitalization estimated at around $13 trillion and Bitcoin's current market capitalization of around $1.3 trillion (roughly 10% of gold's), Bitcoin can act as a store of value to gold with the added benefit that it is well suited for payments (also known as a medium of exchange)."
Haar said: "We believe that gold is likely to gradually appreciate in the coming years as we continue to experience an environment where fiat currencies lose value/purchasing power over time and foreign entities want to be as independent of the US dollar as possible. We believe that Bitcoin has greater price appreciation potential than gold in the coming years. We expect the market capitalization of gold and Bitcoin to be equal over the next 5-10 years."
04
Macro Analysis
CICC: The current adjustment of risk assets is not a recession trade
1. The “special features” of this round of interest rate cuts: non-recessionary interest rate cuts; interest rate cuts do not need to be large, and asset reactions will also be advanced
Comparison of historical experience without distinguishing the macro environment is not only meaningless, but also misleading. The pace of interest rate cuts is more determined by the economic cycle, rather than the other way around, otherwise it would be putting the cart before the horse. Economic recession is a sufficient but not necessary condition for interest rate cuts. The Fed can also "preventively" cut interest rates when the economy has not yet entered a recession, such as now, or in the 1995 and 2019 cycles. Admittedly, the current US economy is in a slowdown phase, which is why the Fed can and needs to cut interest rates. However, slowdown cannot be simply equated with "recession", otherwise it will lead to excessive pessimism about risky assets and excessive optimism about safe-haven assets. It is necessary to distinguish the degree of decline and whether it can be quickly resolved by monetary easing. The pressure that causes economic recession generally comes from: 1) unexpected credit event shocks; 2) the squeeze on the credit cycle by financing costs that are continuously higher than the return on investment. We have not seen either of these two points, so there is no basis or signal for a clear recession.
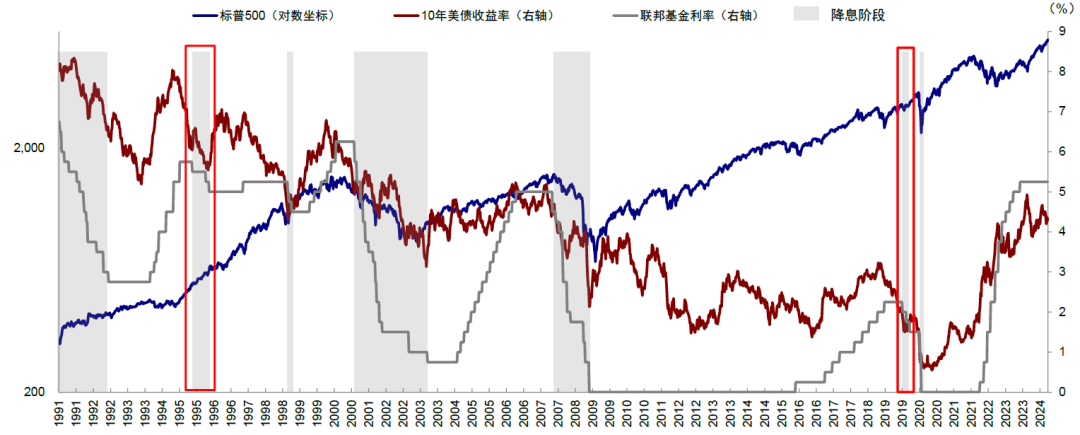
Chart: The economy is not in recession, and the rate cut is not a recession-style rate cut
Therefore, this also determines the "specialness" of this round of interest rate cut cycle. It is not a recession-style interest rate cut. It is possible to cut interest rates but it does not need to be cut a lot. Therefore, we believe that the reaction of assets will also be advanced: 1) Background: The economy has not declined. Both the second quarter GDP data and the June PCE data show the resilience of the economy. Therefore, the interest rate cut is not a recession-style interest rate cut. 2) Reason: It is precisely because the economy is still resilient that the less the market expects interest rate cuts, the greater the room for interest rate cuts. On the contrary, if the market trades in a large interest rate cut too early and relaxes financial conditions, it will easily cause an economic and inflation rebound and compress the subsequent interest rate cut space. 3) Time: The preventive interest rate cut for a soft landing requires an "excuse", that is, inflation is in a downward channel, which we estimate to be in the third quarter. 4) Number of times: The start of interest rate cuts does not mean a continuous and large interest rate cut. We estimate that about 100bp can solve the problem.
It is precisely because of the above particularity that the difference this time is mainly reflected in the rhythm, which may be faster and more advanced than previous interest rate cuts. Failure to understand this may lead to "doing the opposite" in trading. Soft landing preventive interest rate cuts mean that this switch may occur earlier than other interest rate cut cycles, which is why we emphasize that "easing is over halfway". In the comparable historical stages, such as the three 75bp interest rate cuts in 1995 and 2019, the US bond interest rate and inflation rebounded after the interest rate cuts, and the dominant assets once again turned to US stocks and commodities.
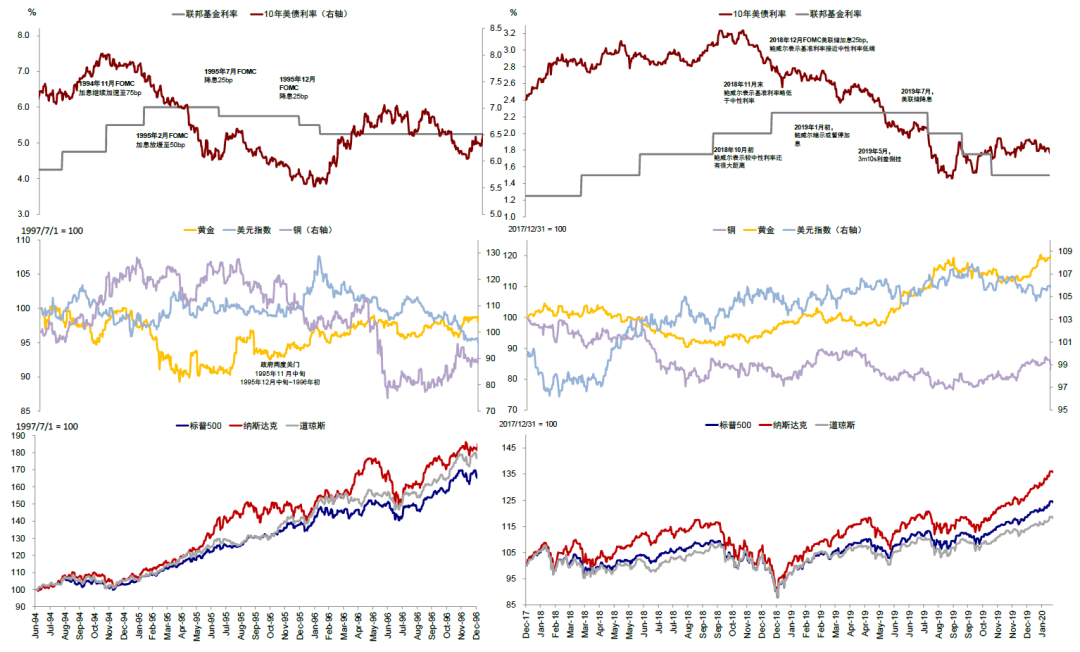
Chart: Historically comparable periods such as three 75bp rate cuts in 1995 and 2019
2. What is the market trading recently: It is not a recession trade. The decline of risky assets and the lack of rise of safe-haven assets will help start the September rate cut.
Before the rate cut, overseas assets fluctuated more, especially the overall weakening of the US stock market, and some investors were also worried about whether there was a risk of recession. We do not fully agree with the judgment that the current situation is a "recession trade", otherwise it is impossible to explain the trend of gold and US bonds, and the steepening of the interest rate curve ("Is the US stock market currently trading a recession?"). The slowdown in growth and the pullback of risky assets before the rate cut are natural phenomena. Taking 2019 as an example, it was also against the background of a soft landing of the economy. The earnings and valuations of US stocks also experienced three stages: earnings rose during the rate hike cycle, and valuations were under pressure; when the rate hike stopped, valuations were still under pressure, and earnings were also under pressure; after the rate cut began, valuations were repaired first, and earnings were still under pressure. Against the background of slowing earnings, US stocks experienced a 6.8% and 6.1% pullback before the rate cut in May 2019 and the first rate cut in July 2019, respectively.
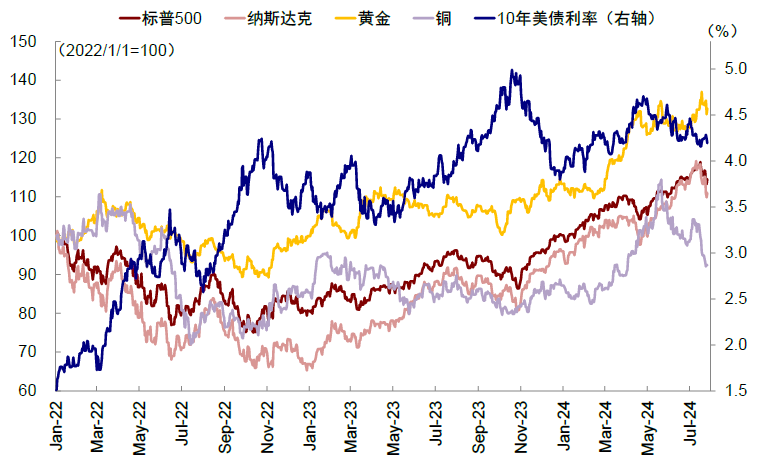
Chart: On July 24, gold, copper and US bonds fell along with US stocks, not a typical "recession trade"
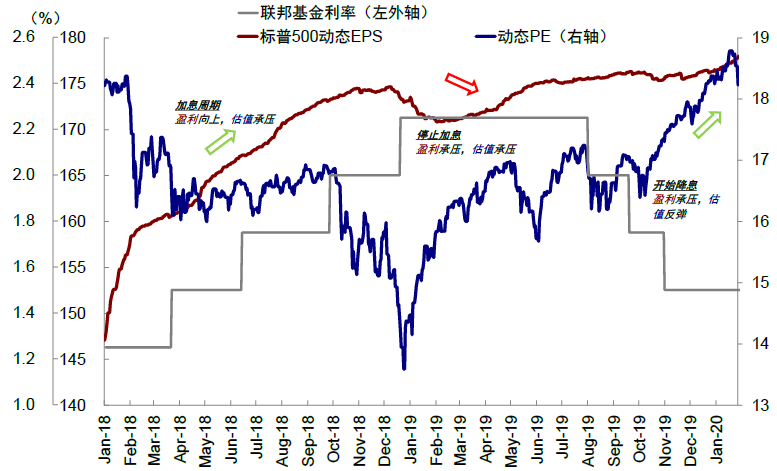
Chart: It is normal for corporate profits to be under pressure before interest rate cuts
More importantly than the short-term correction, the recent decline in risk assets and the lack of a sharp rise in safe-haven assets have led to a tightening of financial conditions and wealth effects, which is conducive to the implementation of the Fed's interest rate cut. Recent fluctuations have caused the financial conditions index to rise from a low of 98.9 on July 16 to 99.3, the highest since June 10. Tightening financial conditions help to curb demand and inflation, and volatility in risk assets also helps to curb the wealth effect, which in turn helps to facilitate the implementation of the Fed's interest rate cut in September. At the beginning of the year, it was precisely because of excessive trading in interest rate cuts that the Fed postponed interest rate cuts. As the saying goes, "the less expected a rate cut is, the more likely it is to cut."
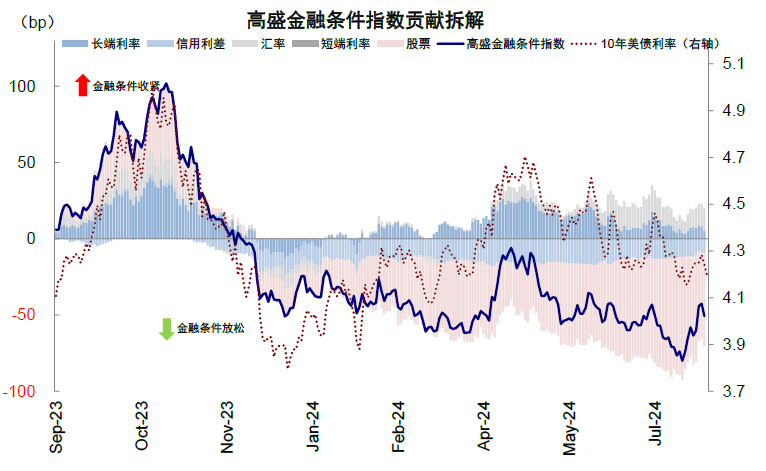
Chart: Financial conditions index rose to 99.3 from a low of 98.9 on July 16, the highest since June 10
3. How to trade interest rate cuts in the future? The easing is already halfway through; before the interest rate cut is realized, the "denominator assets" will still benefit, but they will retreat while fighting; after the realization, they will turn to the numerator benefiting assets
The characteristics of this round of interest rate cuts are that the US growth slows down but does not fall into recession, so the interest rate cut cycle and amplitude will not be large, and the fundamentals may gradually recover after a few interest rate cuts. For this reason, those denominator transactions that rely solely on interest rate cuts (such as US bonds, gold, Russell 2000 and small-cap stocks represented by Hong Kong biotech) still have room, but they cannot be over-extrapolated. When the interest rate cut is realized, it is the time for such transactions to "fight and retreat". On the contrary, risky assets that are priced more towards the numerator are prone to weakening due to the slowdown in fundamentals before the interest rate cut, but the correction also provides a better opportunity to intervene, and will also benefit from the improvement of the denominator after the interest rate cut.
05
Research Reports
@Thor Hartvigsen: Exploring high-yield strategies with stablecoins
As new tokens are launched at more modest but potentially more realistic valuations, the excitement around airdrop farming has waned. As a result, it is no longer possible to earn 40%+ annualized yields on stablecoins, for example on Pendle or various lending markets. As a personally more conservative investor, I prefer to keep part of my portfolio in stablecoins, and last week I asked on X about the best stablecoin farms on the market. I received over 150 responses, as well as contacts from multiple teams who explained the high yields that can be earned through their products.
Having looked at these different strategies over the past week, this report attempts to present where the best yields are in stablecoins (and structured stablecoin-like products).
1. JLP
JLP is not a stablecoin. In fact, it is not at all. It is a structured product similar to GMX’s GLP which was very popular in 2022/23. However, among the many strategies I looked at, JLP stood out the most and warrants a deeper analysis.
JLP is a structured product launched by Jupiter Exchange on Solana. Among other things, Jupiter offers perpetual futures trading in BTC, ETH, and SOL with up to 100x leverage, while JLP acts as liquidity and counterparty for these traders. JLP consists of a basket of assets, as shown below.
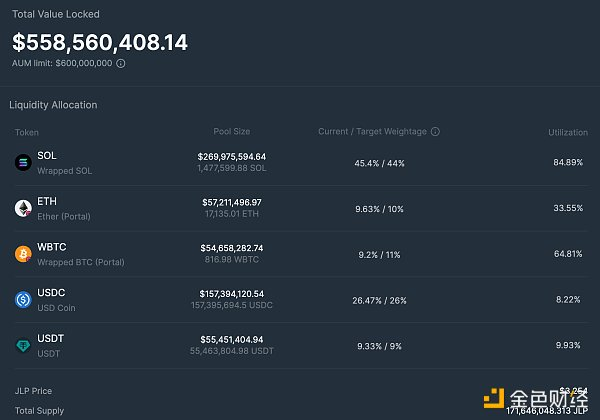
JLP Composition
For every $1 you buy in JLP, you are actually buying:
$0.454 SOL
$0.0963 ETH
$0.092 Bitcoin
$0.2647 USD
$0.0933 USD
Therefore, the price of JLP depends first on the price of the underlying assets. If BTC, SOL, and ETH appreciate, JLP will also appreciate, but to a lesser extent because it contains about 35% of stablecoins, and vice versa. More specifically, the price of JLP depends on three factors:
The price of the underlying asset (BTC, ETH, SOL, USDC and USDT)
Fees paid by traders
Trader Profit and Loss
75% of all fees a trader incurs on perpetual contracts go into the JLP vault. This is equivalent to 50% APY on current fee levels and accumulates through JLP price appreciation. Finally, JLP acts as a counterparty to Jupiter traders. If the trader is profitable, the gains are paid out of the JLP vault, and if the trader is losing, the losses are added to the vault. The chart below shows the price of JLP since the beginning of the year.
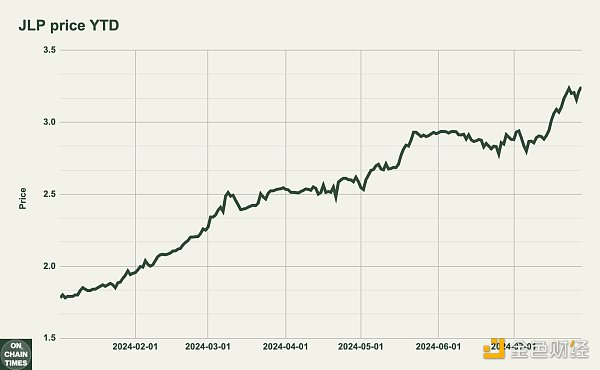
It is worth noting that JLP has risen from $1.78 to $3.25 this year alone, due to the appreciation of the underlying assets and the large fees collected by traders. This is a 61.28% increase with very small declines, similar to a chart that is almost always up. The 61.28% ROI year-to-date is equivalent to an annual return of 106.5%, far exceeding any type of stablecoin product. However, it is a bit dishonest to compare it to a stablecoin strategy because JLP only has a 35% stablecoin component. Holding JLP instead of using stablecoins for farming requires taking on more risks (e.g., traders' PnL exposure) and volatility of the underlying assets.
But how does JLP perform compared to BTC, ETH, and SOL? As shown in the chart below, JLP has outperformed BTC and ETH so far this year, but not as well as SOL.
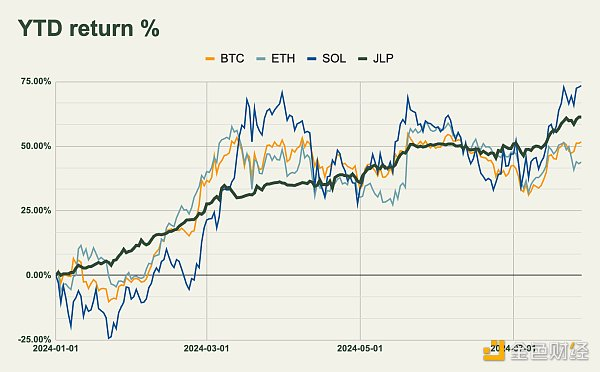
But is JLP safer than long SOL directly? To analyze further, we can compare JLP's returns to BTC, ETH, and SOL on a volatility (risk) adjusted basis.
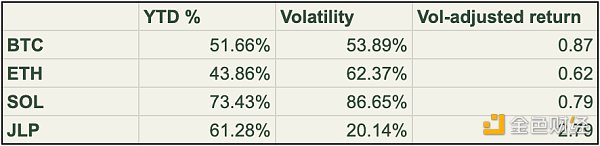
By taking the YTD price performance of these assets, subtracting the risk-free rate, and dividing by their volatility, we get a risk-adjusted return metric, the Sharpe Ratio (volatility-adjusted return). The higher this number, the better the investment. As the table shows, JLP has significantly outperformed on a volatility-adjusted basis YTD due to its much less volatile investment than just holding BTC, ETH, or SOL. Note that past performance is not indicative of future performance, but it's still interesting to see.
However, volatility-adjusted returns are not the same as risk-adjusted returns, as JLP contains risk vectors other than just volatility. When holding JLP, you are exposed to smart contract risk, and the price may also be negatively affected if traders become very profitable (partially draining JLP funds). Since there are no long-tail assets to trade on Jupiter, the risk of price manipulation is minimal, and the likelihood of an event like AVAX, when GLP was partially drained, is low.
Nonetheless, we can examine the overall performance of traders on Jupiter to try to quantify JLP counterparty risk. The chart below shows the net profit and loss of Jupiter traders over the past three months.
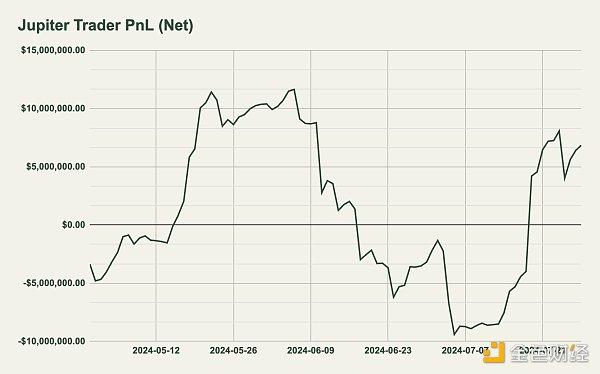
It is worth noting that the traders have been net profitable over the past three months, with cumulative gains of $6.85 million. This effectively means that $6.85 million from JLP's coffers has been paid to traders, negatively impacting their performance. Nevertheless, JLP's performance remains strong due to the high fees paid by traders at the same time.
2. Syrup
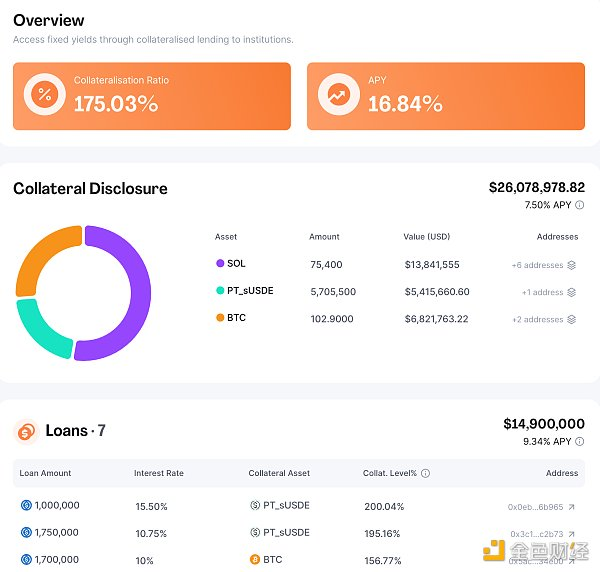
Syrup is a protocol built on top of the Maple Finance RWA lending market. On Syrup, depositors can earn TradFi yields in a transparent way by providing overcollateralized loans to institutions. USDC depositors on Syrup can earn an annualized yield of 16-20%, which is paid by institutional borrowers.
Currently, the TVL (USDC) deposited by users is $41.5 million, and these funds are loaned out to institutions. These institutions have invested $26 million in collateral (SOL, PT-sUSDe, and BTC) and have borrowed $14.9 million. The income provided to USDC lenders comes from the yield on the institutional collateral (7.5% APY) and the USDC borrowing rate (9.34% APY). All of this can be seen in the figure below.
Syrup Finance
In addition, Syrup also provides “points” to lenders, and it is rumored that it will launch a token later this year. Locking USDC can multiply the points earned, but the risk will also increase.
3. Additional benefits
PYUSD
PYUSD is a stablecoin issued by Paypal, and its supply has grown to over 600 million. Paypal is currently offering a large number of rewards to PYUSD depositors on Kamino Finance. The yield is about 20% APY.
Morpho
Morpho is a decentralized and permissionless lending market with so-called “curators” who are able to drive the market and strategy. USDC lenders on curated markets like Gauntlet and Steakhouse have seen pretty lucrative returns, especially when considering the $MORPHO rewards.
Usual
Usual recently launched its stablecoins USD0 and USD0++, which are backed by RWA. Holding USD0++ earns RWA collateral yield as well as “pills” (points). The first campaign went live recently and will last for 99 days. Like Ethena, Usual has integrated its stablecoin into various protocols, which provides multiple ways to earn extra points before the airdrop. Please
4. Conclusion
So, will stablecoin mining alone allow you to beat the market? In average market conditions, probably not (perhaps only if the market falls sharply). But earning a high yield from an idle portion of your portfolio can bring huge additional returns (while keeping in mind that these strategies are risky).
JLP is particularly interesting. While it is not a stablecoin but a structured product, it has outperformed the market while being less volatile. If SOL remains strong for the rest of the year and JLP continues to charge high fees, it may continue to perform strongly.


