

September has started off the month in standard fashion for BTC price performance — but not all Bitcoin market opinions are pessimistic about where to go next.
Bitcoin started September on a bad note as both the monthly and weekly closes sparked a drop in BTC price.
Bitcoin trading close to spot demand at $57,000 Analysis shows low interest among traders and a clear lack of bullish sentiment.
Will the market see another "Rektember"?
The “red” zone status of Bitcoin’s returns this month has been well-confirmed, but not every forecast is prepared for the worst.
The mid-$60,000 range remains attractive as a short-term BTC price target, with September also marking the deadline for the completion of Bitcoin’s post-halving “re-accumulation range.”
The macro environment is expected to remain calm this week, with unemployment data being the key topic of attention due to the lack of major US data releases.
As Bitcoin continues to fluctuate, Cointelegraph analyzes the main talking points among market participants at the beginning of the new month.
BTC price hits August low
Bitcoin underperformed in its latest monthly close and conditions remain volatile.
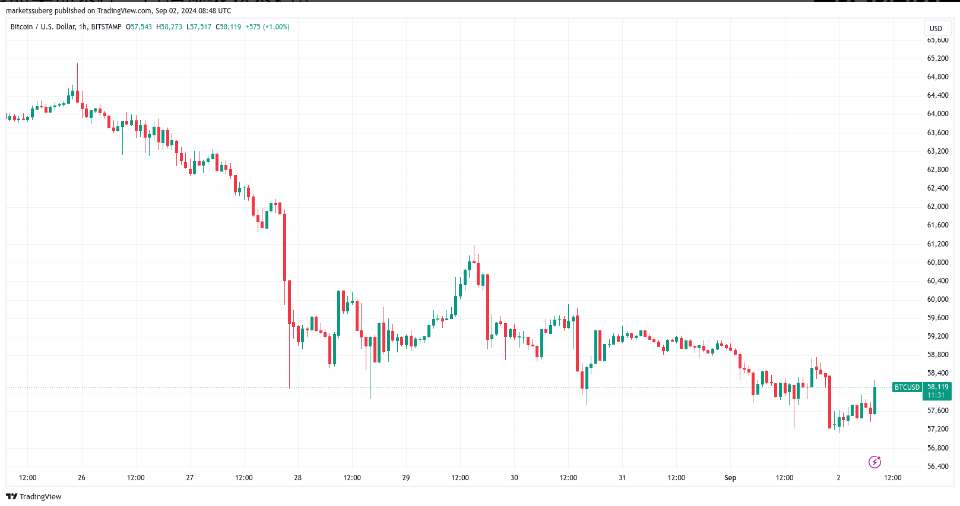
BTC/USD 1-hour chart. Source: TradingView
Data from Cointelegraph Markets Pro and TradingView showed that bulls were unable to overcome seller pressure, which popular trader Skew said was characteristic of low time frame market conditions.
“There has been a clear spot buyer around $58,000 for much of the past week, providing important context for the rally,” he wrote in his latest X analysis .
“Prices are currently in line with spot demand, but we need to see confirmation of demand from both buy-side and passive buyers.”
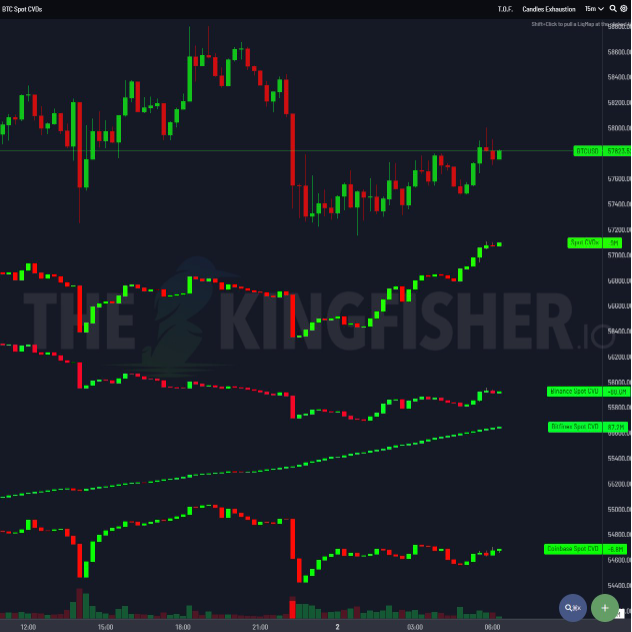 Bitcoin order book data. Source: Skew
Still, Skew stressed that the general lack of interest in derivatives markets at current prices suggests funding rates could remain “negative or low” for now.
He continued: “I do see that overall the market may be leaning towards short against the spot sales that have occurred over the past week.”
“However, since the sell-off to $58,000, there has been little growth in positioning ~ which tells me people are exiting the trade.”
Data from monitoring resource CoinGlass shows that the majority of bid support is concentrated around $56,750 as of the time of writing on Sept. 2.
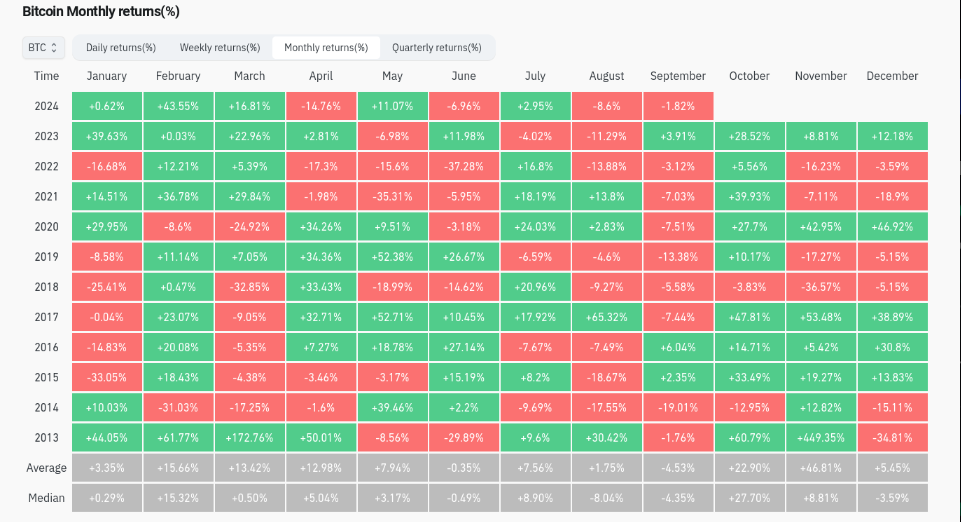 BTC/USD monthly return rate (screenshot). Source: CoinGlass
Other traders believe that there is a chance that the price will fall to local lows before bulls get relief, with estimates including $56,000 and $54,000.
“They are more likely to push to 56k and sweep Tuesday’s low before continuing higher. Remember, they may still want to scam a lot by pushing to 49k (Monday 5th Aug low),” Madara predicted .
“If the rally happens after 56k, then I would expect a rally to 60.5k first and then 65k.”
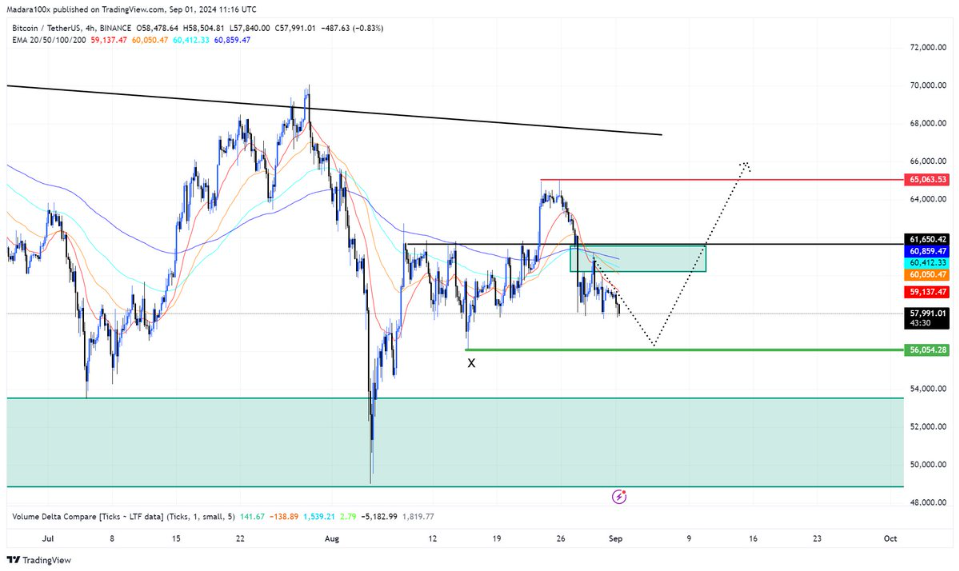 BTC/USDT 4-hour chart. Source: Madara
Trader Captain Faibik said a rally this month could even take the market to $68,000.
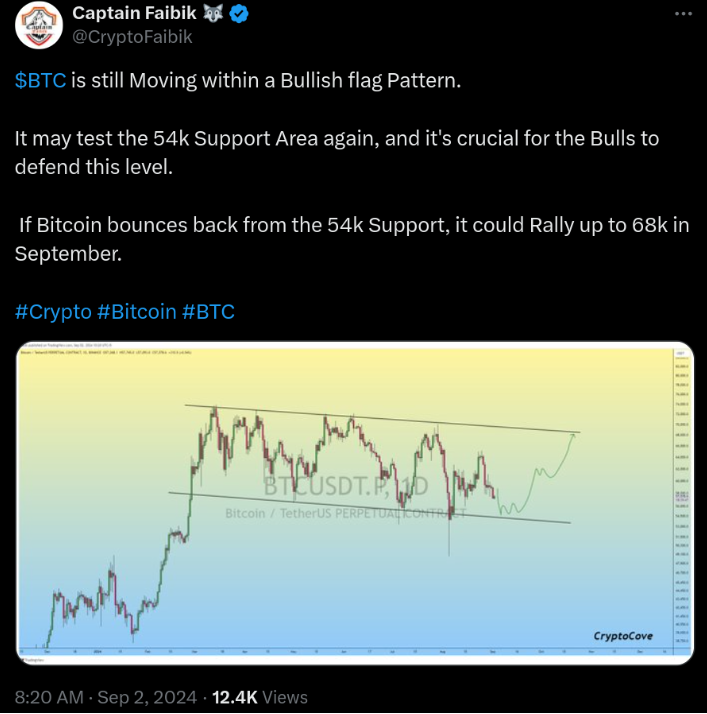 Source: Captain Faibik
Labor Day week: U.S. employment situation attracts much attention
With markets closed for the US Labor Day holiday on September 2, traders will be waiting for macro-related moves to emerge this weekend.
Macro data will be crucial for markets to finalize their expectations ahead of the Federal Reserve's interest rate meeting on September 18.
The most likely outcome from this meeting is a 0.25% rate cut, according to the latest data from CME Group’s FedWatch tool .
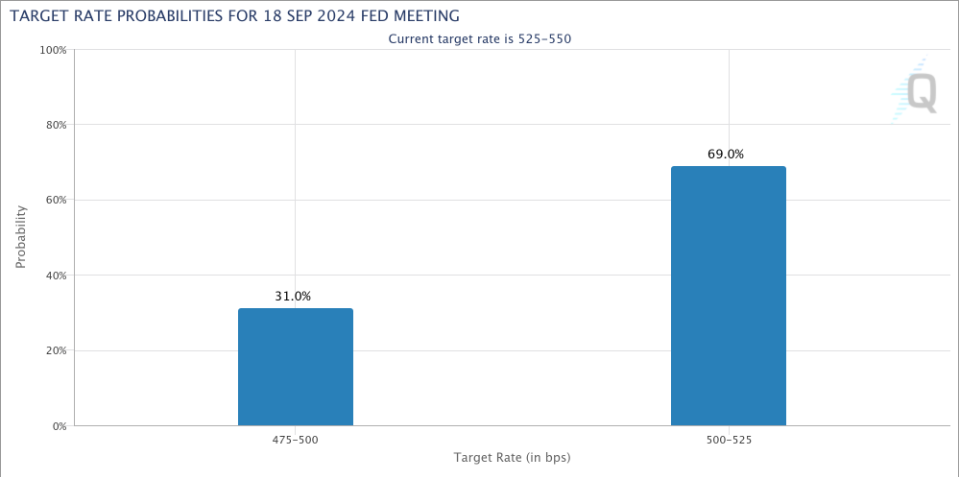 The probability of the Fed's target interest rate. Source: CME Group
This is a stark contrast to expectations a month ago, when a 0.5% rate cut was in the spotlight due to turmoil in Japan.
Meanwhile, US unemployment data will be in focus this week, with the start of the month generally looking quiet.
Trading resource The Kobeissi Letter told X’s followers: “We expect volatility to rise and trading conditions to be good, with a focus on August employment data.”
Kobeisi reveals the magnitude of the stock market's rebound since its early August lows, with the S&P 500 adding an average of $250 billion per trading day since then.
Another X post noted: "The S&P 500 achieved its average annual return in 20 trading days."
According to Cointelegraph, stocks and gold have performed much better than the cryptocurrency market in recent weeks, while Bitcoin continues to be sluggish despite a 40% rebound at one point.
Are you ready for the “Red” September?
BTC/USD ended up falling 8.6% in August, setting the stage for a dismal performance in September.
The ninth month of the year itself tends to produce losses, with an average drop of about 4.5%, according to CoinGlass.
August, by contrast, is often a “green” month and this year’s performance was a record low.
Still, it may just be a matter of time — and history may still be on the bulls’ side.
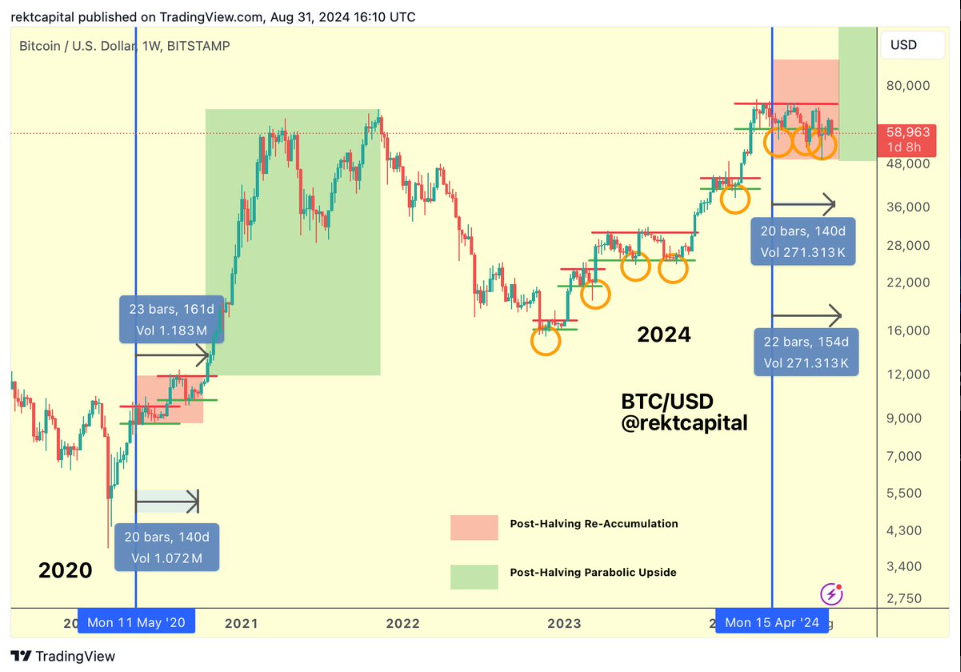
In some of his latest market commentary, prominent trader and analyst Rekt Capital said that BTC/USD is still struggling to achieve a post-halving breakout, consistent with halvings in previous years .
“History shows that Bitcoin tends to break out 150-160 days after the halving,” he explained in an Aug. 31 post .
“This means that Bitcoin will break out of its re-accumulation range in late September 2024.”
Rekt Capital acknowledges that even Bitcoin’s best September ever was only a 6% gain. However, October could change the situation, with an average monthly return of nearly 23%.
“I would not be surprised if Bitcoin consolidates further after late September and sees an October breakout,” he concluded.
"After all, October has historically been a strong month."
 BTC/USD halving comparison chart. Source: Rekt Capital
Puell Multiple Suggests Buying Opportunities
The notion that the Bitcoin bull market is in a transition phase is also supported by the classic Puell Multiple indicator.
The multiple compares the value of all bitcoin mined each day to its 365-day moving average to determine relative buying and selling areas.
As defined by CryptoQuant, Puell answered the question, “If all mined Bitcoin was immediately sold on the market, how profitable would the mining pools be compared to last year?”
Currently, the S&P 500 has reached neither a macro top nor a macro bottom, but is inching toward its green long-term "buy" zone, which is characterized by readings of 0.5 or lower.
As Cointelegraph reported, this could prevent reliable market entry at prices no lower than current spot prices.
“Analysis of trends over the past decade shows that when the index falls below the 0.6 threshold, it generally represents an ideal opportunity for dollar-cost averaging (DCA) strategies. Conversely, a break above the 0.8 level has historically been associated with bullish market action, often driving prices to new all-time highs (ATHs),” contributor Grizzly Weekend wrote in a CryptoQuant Quicktake blog post.
“Currently, the Puell Multiple Index is fluctuating between these two key levels.” Bitcoin Puell Multiple Chart (Screenshot). Source: CryptoQuant
Deep learning model favors BTC price rebound
While September is traditionally a “red” month for BTC/USD, new analysis suggests that 2024 could be an exception.
In another Quicktake post on Sept. 1, CryptoQuant used the WaveNet deep learning model to predict a “relative increase” in BTC prices.
In June, a similar experiment correctly predicted that gold prices would trade sideways below $60,000 over the next month.
For CryptoOnchain, the analysts who compiled the latest data, these are “acceptable and close to realistic forecasts.”
“For this, we used all the data from 2012 till now as features. The output of the wavenet model shows the relative probability of a rise in the price of Bitcoin in the next month,” he commented.
The accompanying resulting chart shows that price action is trending upwards, with a 50% chance of prices rising above $65,000 in September.
“A range of 0.5 indicates a 50% probability that the Bitcoin price will be within that range, while a range of 0.9 indicates a 90% probability that the Bitcoin price will be within that range,” CryptoOnchain explained.
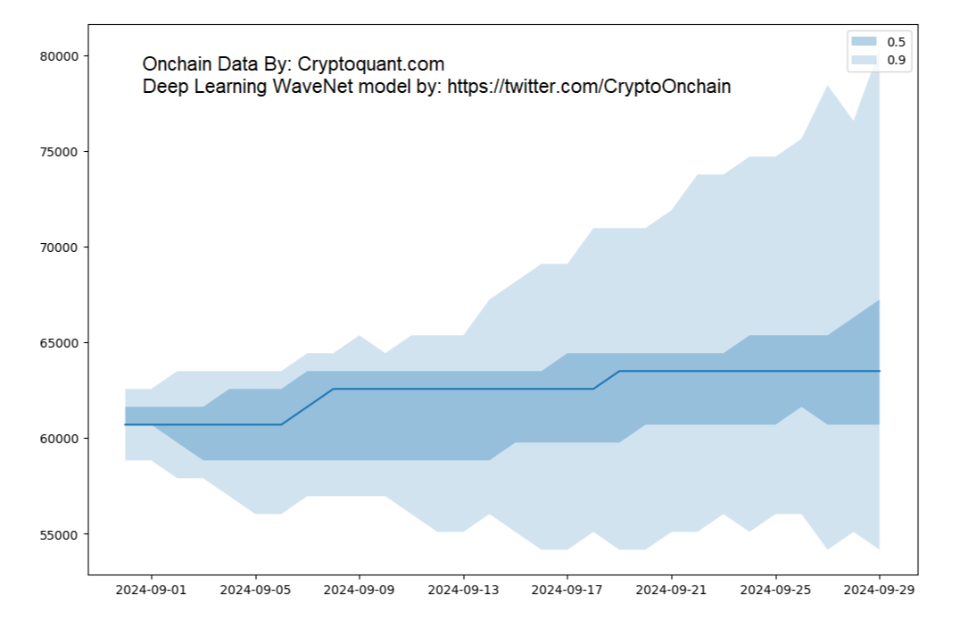
WaveNet BTC price prediction (screenshot). Source: CryptoQuant


