
Currently, Bitcoin is trading just below $59,000, with great opportunities in the coming month. September is traditionally a poor month for Bitcoin, so it remains to be seen whether the first rate cut by the Federal Reserve on September 18 will provide some upward momentum for Bitcoin prices.
September — Worst Month for Bitcoin Returns
Looking at Bitcoin’s monthly returns since 2013, September has proven to be the worst performing month, with an average return of -4.39%. The closest to the worst month is June, with an average return of -0.35%. Other months have generally shown positive returns, with November having the highest return at an average return of +46.81%.
Spot Bitcoin ETFs Have Negative Flows
Bitcoin has fallen in one area as spot Bitcoin ETFs recorded negative flows in each of the last four days of August, somewhat undermining the impact of all previous positive inflow days.
Is the Fed's rate cut good for Bitcoin?
However, the Federal Reserve FOMC meeting is imminent on September 18, and Chairman Powell is expected to start cutting interest rates by 25 basis points, and there is even a 30% chance of a 50 basis point cut.
With more liquidity in the system and the promise of further rate cuts before the end of the year, this seems like a perfect environment for Bitcoin to thrive. That being said, money markets will move funds to the reverse repurchase program (RRP), which offers a higher yield than short-term treasuries.
This could offset the expected boost from rate cuts — pulling that liquidity away from risk assets like Bitcoin.
$BTC Back Above Major Support

Looking at the price in the short-term timeframe $BTC, it can be seen that after falling out of the upward channel on Sunday, the price has returned to the bottom of the channel and is currently struggling to return to the inside of the channel and briefly touched $59,800 early Tuesday.
The downtrend line has been broken, which provides momentum for BTC to rise. Moreover, importantly, the price has moved back above the major horizontal support at $58,000.
Weekly Candle Battle
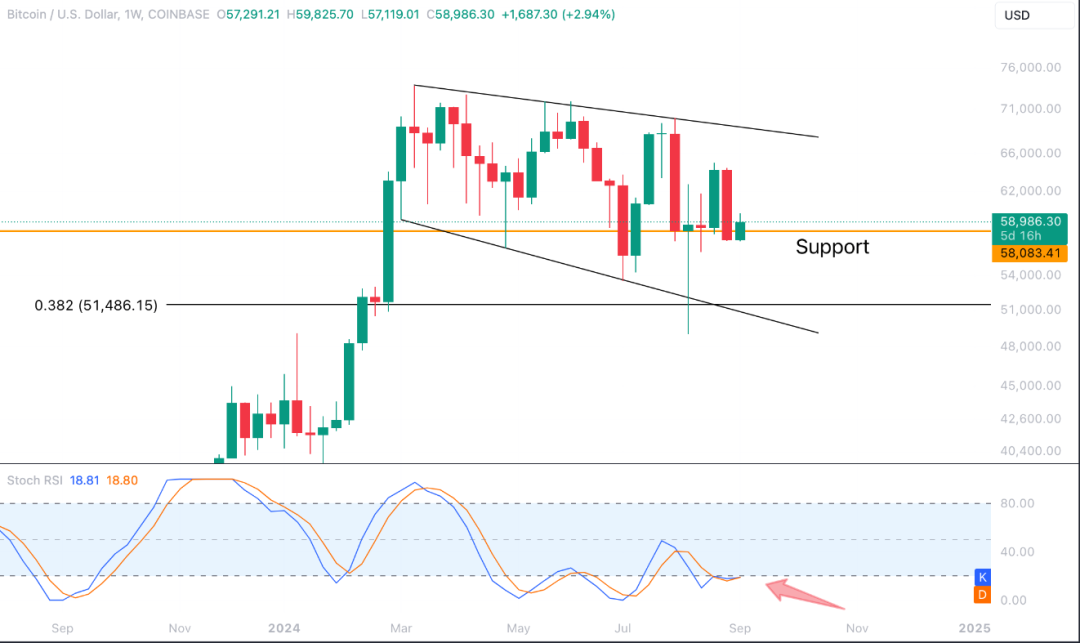
On a more macro weekly timeframe, it can be observed that $BTC price is attempting to contend with last week’s bearish candle close, where this red candle “wrapped” the previous green weekly candle. If the price breaks lower, the 0.382 Fibonacci level of $51,000 is possible.
In contrast, the huge decline in early August caused by the collapse of the Japanese carry trade was quickly digested by the market and may still provide upside momentum for prices.
At the bottom of the chart, the Stochastic RSI indicator is still battling for supremacy. If the blue (fast) indicator closes the week above the red (slow) indicator and both indicators are rising, it will provide plenty of upside price momentum.
Create a high-quality circle, mainly spot goods
Conditions: Overall position ≥ 10,000u. If you want to join, scan the QR code below!
(There is too little room for hundreds or thousands of operations. If you don’t have one, you can also send a private message. As long as you have a skill such as on-chain data, on-chain meme crawling, etc., you can also join after passing the screening)
Details are as follows:

If you have any good specific content, please add anything you think of in the group. Anyway, let’s stick together and keep each other warm!
I will do a more detailed analysis in the communication group. If you want to join my circle, please contact directly 👇🏼👇🏼👇🏼