

According to CoinMarketCap, on September 4, 2024, the world's largest cryptocurrency Bitcoin (BTC) fell below its key support level of $57,000, falling to a low of $55,670. However, the BTC price quickly recovered and returned to levels around $56,800.
Bitcoin and cryptocurrency markets fall as U.S. stocks fall
The U.S. stock market continued to fall on Tuesday, with a market value of $1.05 trillion evaporating. According to reports, the market value of the "seven major technology stocks" including Apple, Nvidia, Amazon, Meta, Microsoft, Alphabet and Tesla evaporated by more than $550 billion in the past 24 hours.
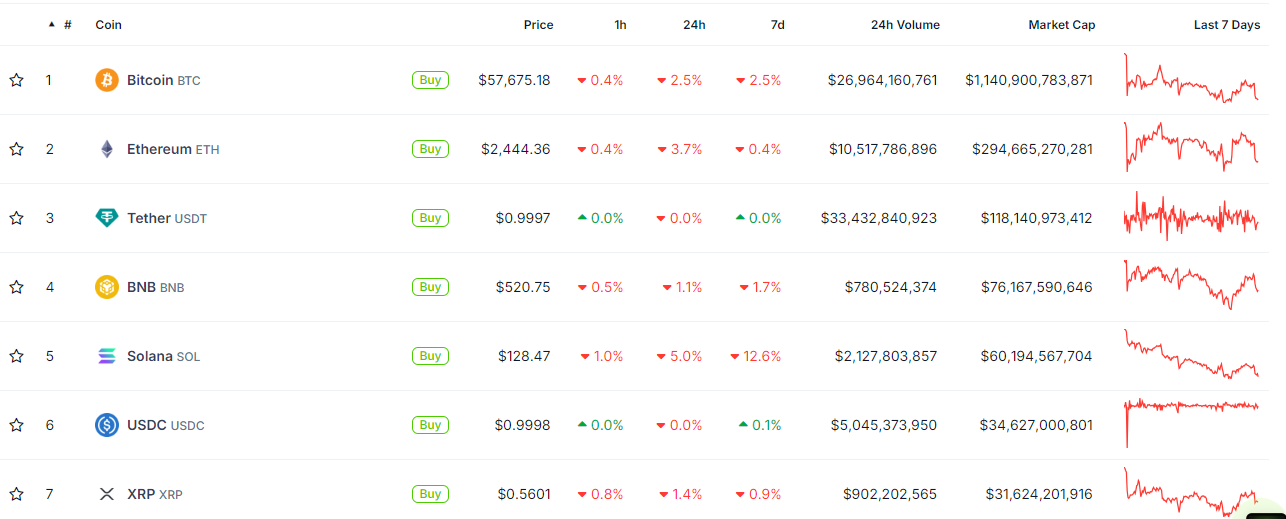
A similar trend has been seen in the cryptocurrency market, with Bitcoin and several other top 20 cryptocurrencies losing money on a daily basis. The trend highlights Bitcoin’s growing correlation with traditional stock markets. Unlike in the past, when investors often turned to Bitcoin for uncorrelated investments, the influx of traditional investors into the cryptocurrency market — especially with the launch of Bitcoin ETFs — has changed the landscape.
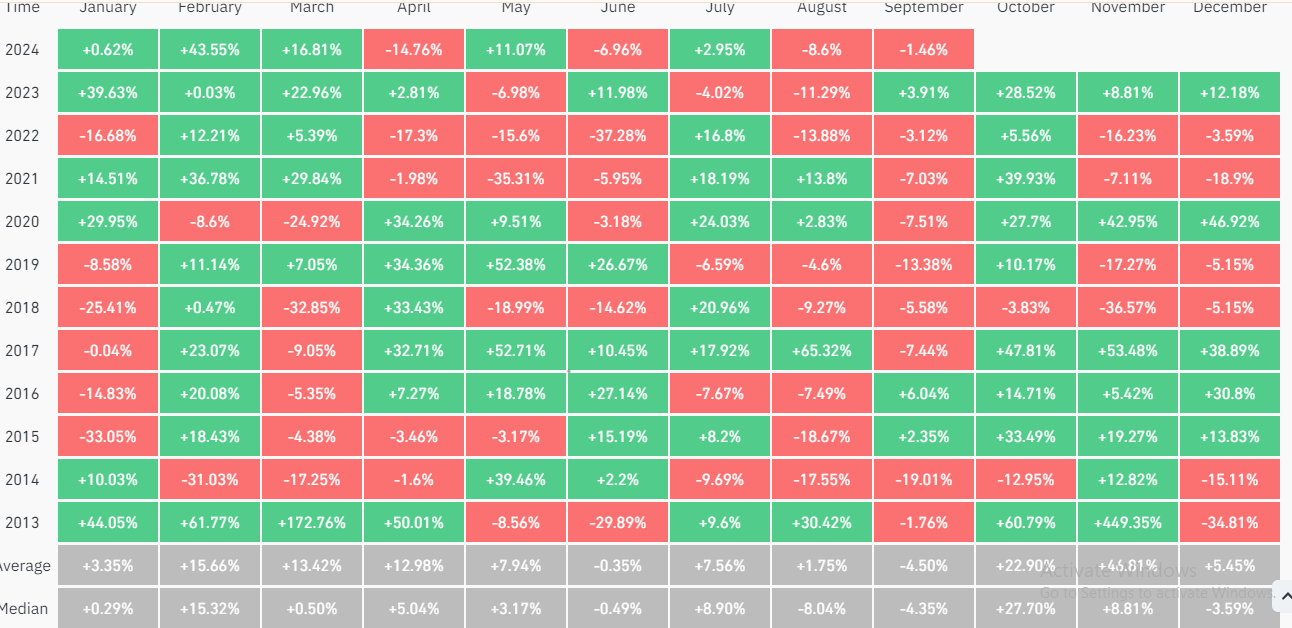
Bitcoin’s decline is also consistent with its historically weak September performance, showing that this was Bitcoin’s worst month with mean and median losses of -4.5 and -4.35 respectively — no other month recorded a lower average return.
Bitcoin Technical Analysis and Upcoming Levels
According to expert technical analysis, BTC has turned extremely bearish and a drop to the $54,000 level is highly likely. The recent price drop not only broke a critical support level but also broke a week of consolidation near the support area, which is a bearish sign.
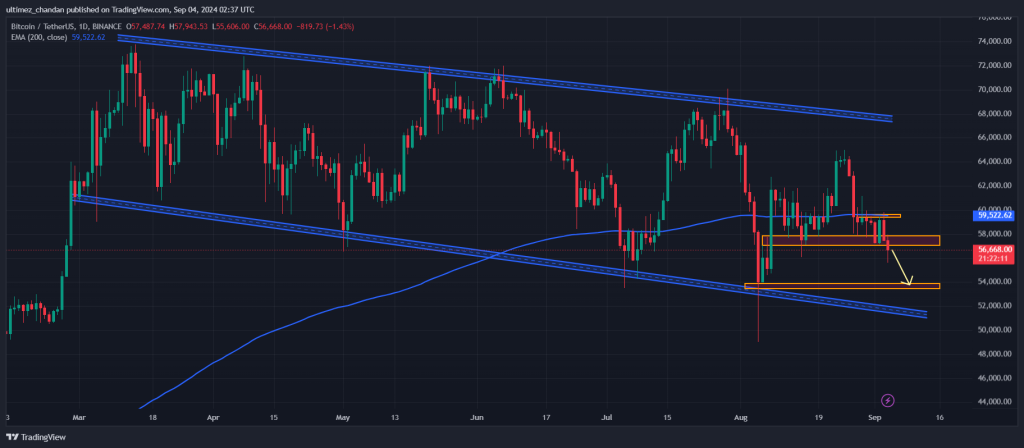
This is the first time BTC has fallen below the $56,000 level since August 8, 2024. Despite the sharp price drop and critical breakdown, technical indicators such as the relative strength index (RSI) and stochastics remain neutral, according to data from CryptoQuant.
The S&P 500 is showing the same trend, with September being the index's worst month in the past 30 years.
Despite the increase in the supply of stablecoins in the cryptocurrency market, which is a bullish trend, the recent price declines are still seen. Most of the new capital has not yet been allocated. Most of the funds allocated to stablecoins have not put buying pressure on the order book, but this "firepower" may enter the market at any time. Institutional investors may buy digital assets through TWAP orders or algorithms to reduce the impact on short-term prices.
Key clearing areas
According to the Bitcoin exchange liquidation chart, the main liquidation areas are currently located near $56,270 below and $57,130 above as day traders are overleveraged at these levels.
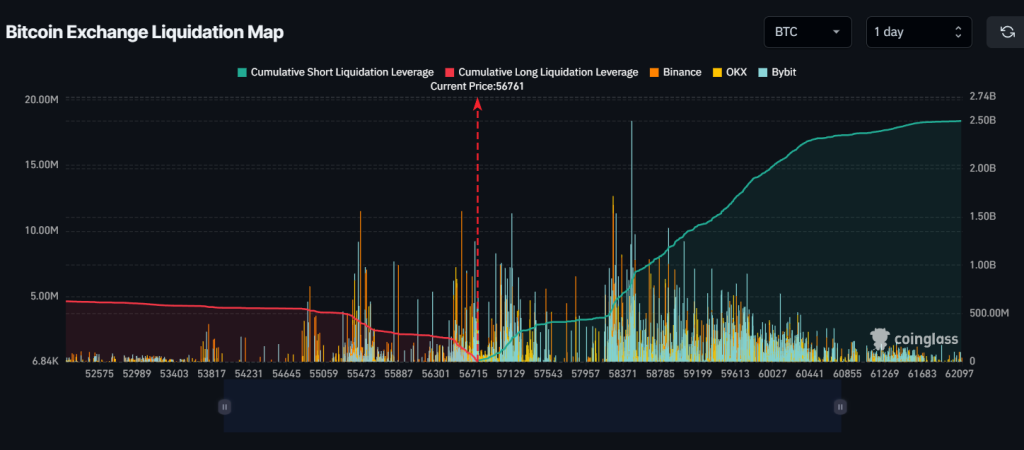
If the market sentiment remains bearish and BTC drops to the $56,270 level, long positions worth nearly $260 million will be liquidated. Conversely, if the market sentiment turns and the price rises to the $57,130 level, short positions worth about $215 million will be liquidated.
Bitcoin price takes a hit
Bitcoin price extended its decline and broke below the $57,500 support level. BTC even declined below the $57,200 support level. There was a break below a connecting bullish trend line with support at $58,900 on the hourly chart of the BTC/USD pair.
The price formed a low at $55,591 and started a rebound recently. The price broke the $56,000 and $56,200 resistance levels. The price broke the 23.6% Fibonacci retracement level of the downward move from the $59,773 high to $55,591 low.
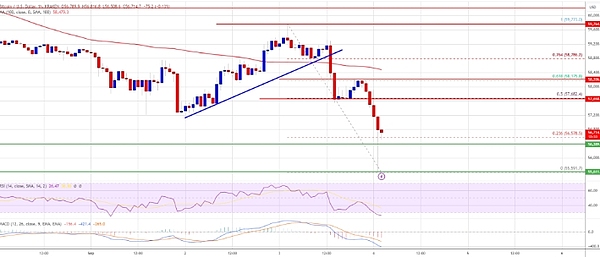
Bitcoin is currently trading below $58,000 and the 100 hourly simple moving average. On the upside, the price could face resistance near the $57,650 level or the 50% Fibonacci retracement level of the downward move from the $59,773 high to $55,591 low.
The first key resistance is near $58,000. A clear break above the $58,000 resistance level could push the price up further in the coming sessions. The next key resistance could be $58,800. A close above the $58,800 resistance level could trigger more gains. In such a case, the price could rise and test the $60,000 resistance level.


