

Get the best data-driven crypto insights and analysis every week:
An Update on Layer–1 Networks
By: Tanay Ved & Matías Andrade
Key Takeaways:
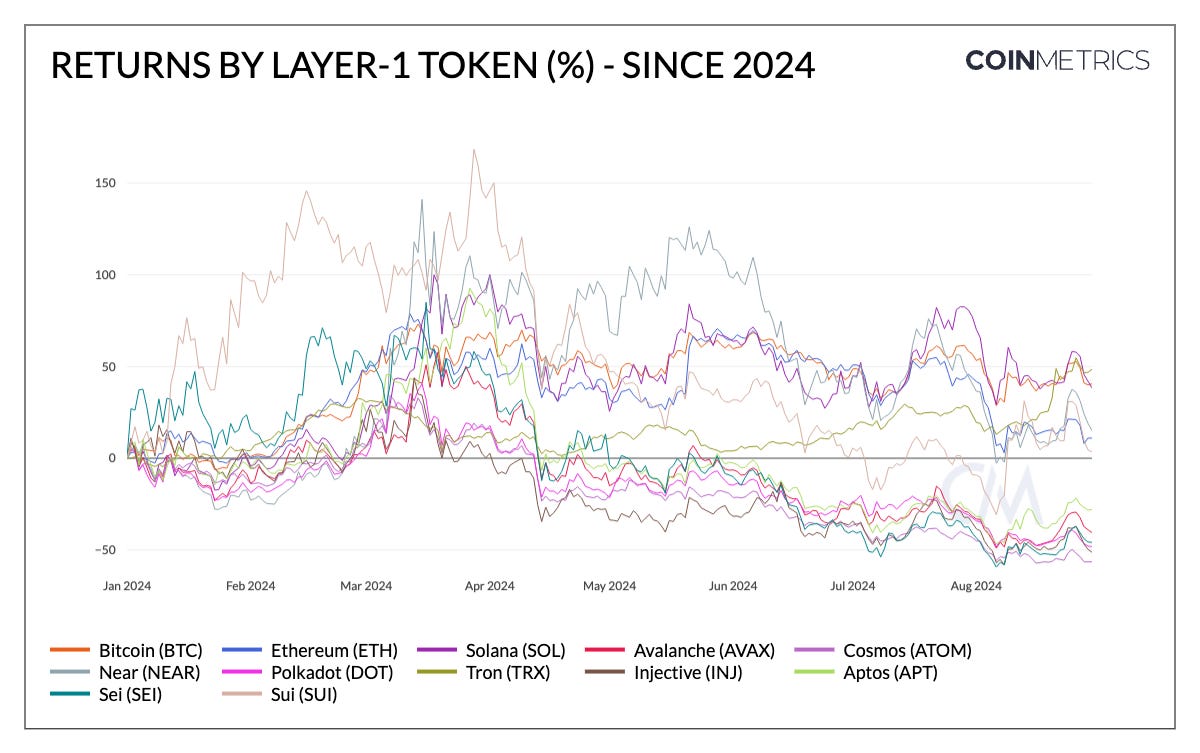
Layer–1 tokens surged early in 2024 but have since lost momentum, with YTD returns falling below 50% across most networks’ native tokens.
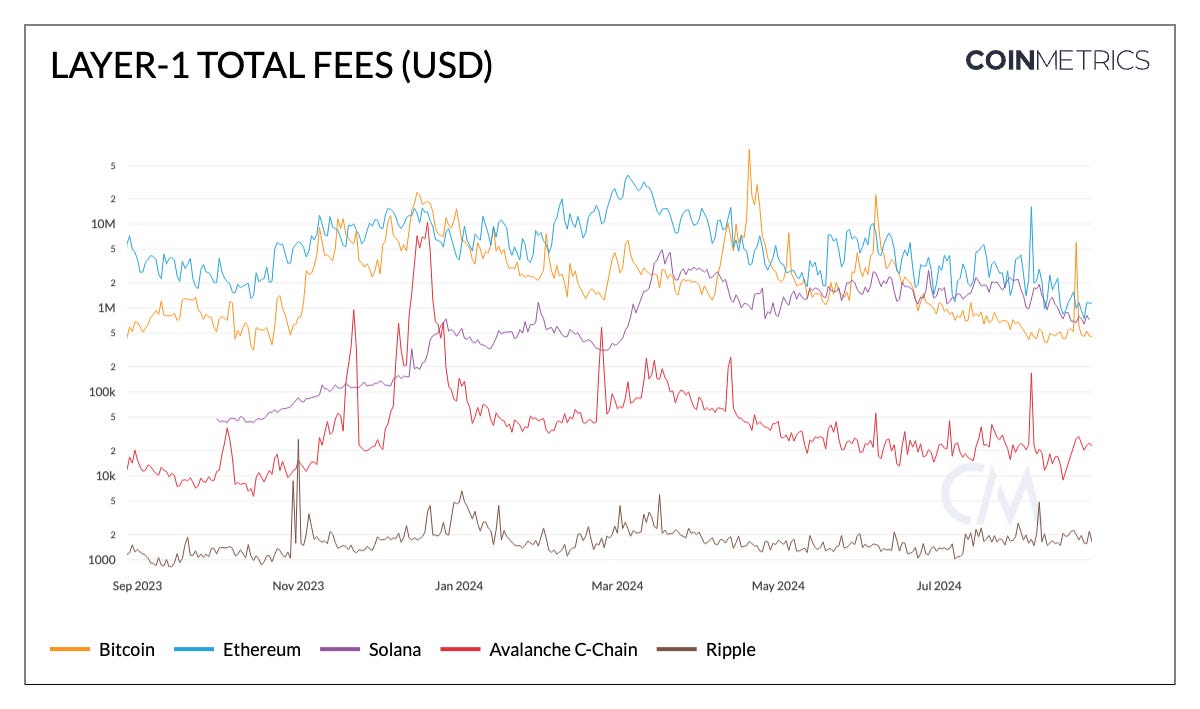
A decline in on-chain and market activity has led to reduced total fees across major Layer–1s, including Ethereum ($1.15M), Solana ($724K), and Bitcoin ($463K)
High-throughput networks like Solana demonstrate distinct transaction patterns, marked by more frequent, lower-value transactions compared to Bitcoin and Ethereum.
Introduction
The landscape of Layer–1 blockchains has evolved significantly in recent years. Networks like Bitcoin, Ethereum and Solana form the backbone of the cryptocurrency ecosystem, each offering unique approaches to scalability, security, and decentralization. As the demand for blockchain-based applications grows, L1 networks are continuously adapting to meet the challenges of increased transaction volumes, energy efficiency, and interoperability. The competition among these networks has driven rapid technological advancements, from Ethereum's transition to Proof of Stake with the Merge, to Solana's focus on high-speed transactions, and Avalanche's customizable subnet architecture.
In this week’s issue of Coin Metrics’ State of the Network, we take a dive into Layer–1 networks, comparing their performance, transaction characteristics, and fee markets.
Layer–1 Token Performance
At the onset of 2024, the Layer–1 sector—representing base layer blockchain networks—garnered significant attention. On the back of the market's resurgence alongside Solana’s rapid growth post the FTX debacle, mindshare appeared to shift onto alternative layer–1’s with their differing approaches coming to the forefront. Specifically, discussion around integrated networks like Solana compared to modular scaling approaches taken by Ethereum, alternative virtual machines and high-performance blockchains like Aptos and Sui became a prominent narrative.
Source: Coin Metrics Reference Rates
This is evident in the chart above, in which YTD returns for layer–1 tokens collectively hit their peak in March. Despite this synergic mindshare, there were several areas of dispersion among these tokens, with integrated, high-throughput networks like Solana, Sui, Sei, and Aptos leading gains alongside NEAR, which benefited from its affiliation with the AI sector. While a cohort of these tokens have entered negative territory as the market has consolidated, others like Solana, Tron, Ethereum, NEAR and SUI remain positive YTD.
Market sentiment and architectural trade-offs will likely continue to shape the perceived value of L1 native tokens, but in the long term—it's crucial to consider fundamental metrics that drive usage and value, which may stem from their nature analogous to emerging market currencies, commodity-like characteristics, or equity-like traits stemming from cash-flows.
Fee Markets In Focus
As providers of finite blockspace, Layer–1 blockchains and their validators (in PoS) or miners in (PoW), are compensated through transaction fees paid by users who want to have their transactions included in the network. While fee mechanisms can differ across L1s, they are a source of incentive for network participants and revenue for Layer–1 networks, typically paid in the network's native token (i.e., BTC, ETH, SOL).
Source: Coin Metrics Network Data Pro
As depicted in the chart above, total fees across L1s vary based on blockspace demand with market events and fee structures influencing this variability. For instance, Ethereum has historically maintained the highest total fees, averaging around $4–5M under regular market conditions, with occasional spikes during periods of high network activity. This is observable in March, when total fees reached $38M, and on August 5th, when on-chain activity surrounding the Yen carry-trade brought fees to $16M.
Relative to historical figures, total fees on Ethereum have declined, with Solana, despite featuring lower average transaction fees, has gained ground by supporting a greater frequency of lower-value transactions—albeit trending lower recently. On Bitcoin, network specific events like Bitcoin’s 4th halving, launch of Runes and most recently, the introduction of Bitcoin staking, have led to periodic spikes in transaction fees as a percentage (%) of miner revenue.
It is also important to factor in burn and issuance mechanisms adopted by L1s which directly influence supply dynamics of their native tokens—impacting holders/stakers via scarcity or staking rewards.
Ethereum - Ultrasound Money vs. Accessibility
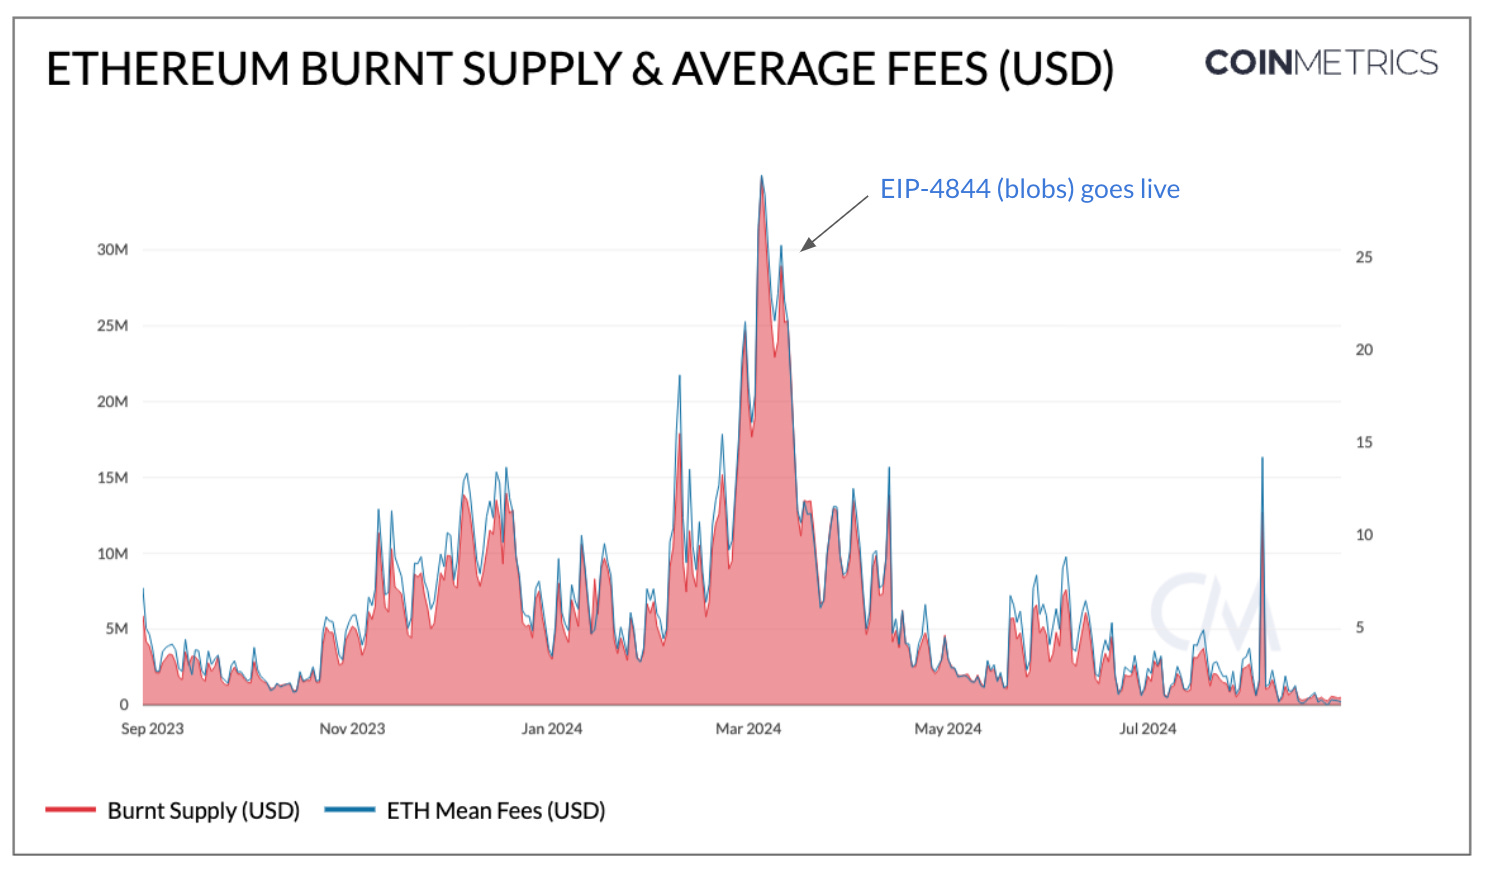
As Ethereum evolves through its rollup-centric roadmap, EIP–4844 introducing blobs has brought L2 transaction fees to fractions of a dollar, making its ecosystem of Layer–2s vastly more accessible. However, in the near-term, this has arguably come at the expense of total fees generated on mainnet (L1). Subsequently, this has hampered the rate of ETH burn, reaching as low as 80 ETH or $194K. Therein lies the dual-nature of “ultra sound money,” creating deflationary pressure for ETH, alongside making Ethereum hospitable for all while also proliferating ETH across its Layer–2s (L2).
Source: Coin Metrics Network Data Pro
Total fees on Ethereum comprise base fees (dynamic based on demand and burned from circulation), priority fees (“tip” incentivizing validators to prioritize transactions) and blob fees (paid by L2s utilizing blobs to settle transactions on L1). However, as the cost of L2 settlement has fallen substantially, blob fees contribute a negligible amount to L1 fees today, thereby impacting holders (non-stakers) via lower burn and inflationary pressure on ETH supply. Nevertheless, Ethereum is well positioned to benefit from a surge in activity due to the progression and accessibility of its L2s.
Solana - To Prioritize or Not to Prioritize
Solana’s fee mechanism is structured differently, with a fixed base fee of 5000 lamports per signature (0.000005 SOL, smallest unit of SOL). Whether minting a new memecoin or making a token transfer on a DEX, users on Solana pay the same base fee. This is unlike Ethereum, where the base fee dynamically adjusts to network demand. Priority fees, on the other hand, are an optional fee that users can pay to increase the likelihood of transaction inclusion by the lead validator, of which 50% are burned and 50% go to validators. However, estimating the optimal priority fee can be challenging due to fluctuating demand, resulting in cases where non-prioritized transactions can be priced out of being executed in a block.
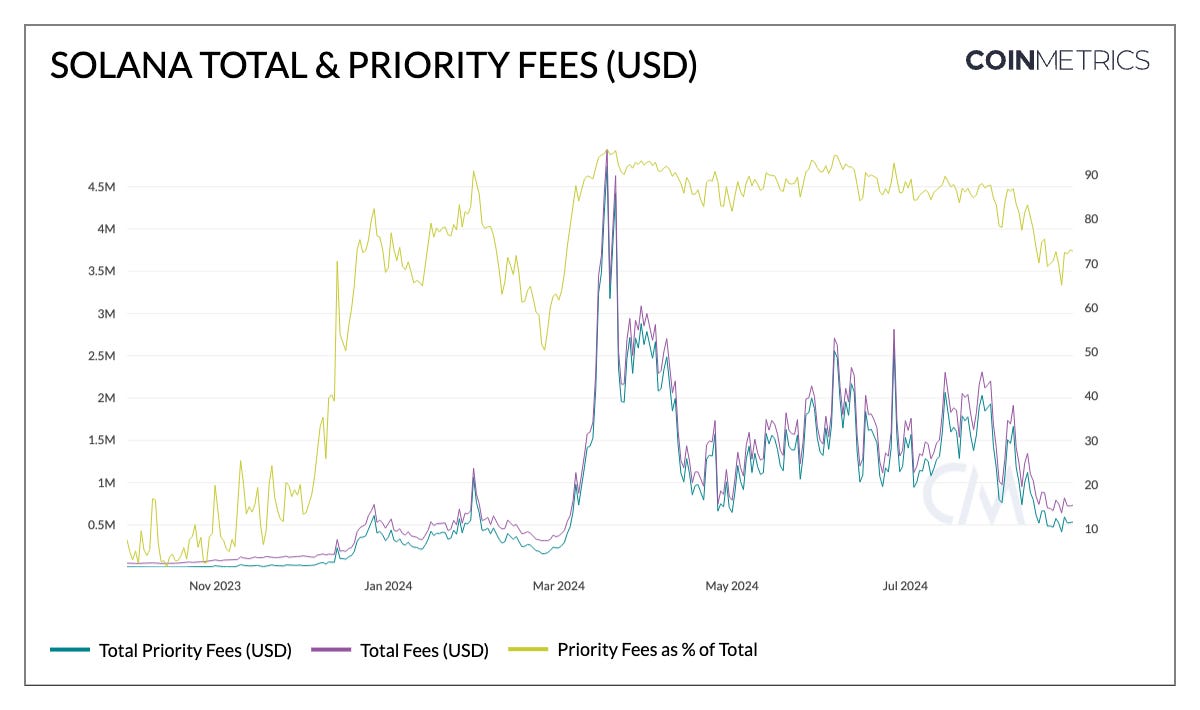
Source: Coin Metrics Network Data Pro
Driven by the overall market and memecoin surge, total fees on Solana reached a peak of $4.5M in March. At this point, priority fees represented 95% of total fees—a figure that's remained around 80% since August—representing the high demand for transaction inclusion. However, activity has significantly tapered off, with total fees now at $732K and priority fees at $533K.
Adoption and Usage Characteristics
Layer–1 blockchains can differ in their typical usage patterns with some optimized for high-volume, low-value transactions, while others excel at transactions with larger values. Therefore, it's important to holistically consider the “economic throughput” of these systems, looking beyond simple transaction count.
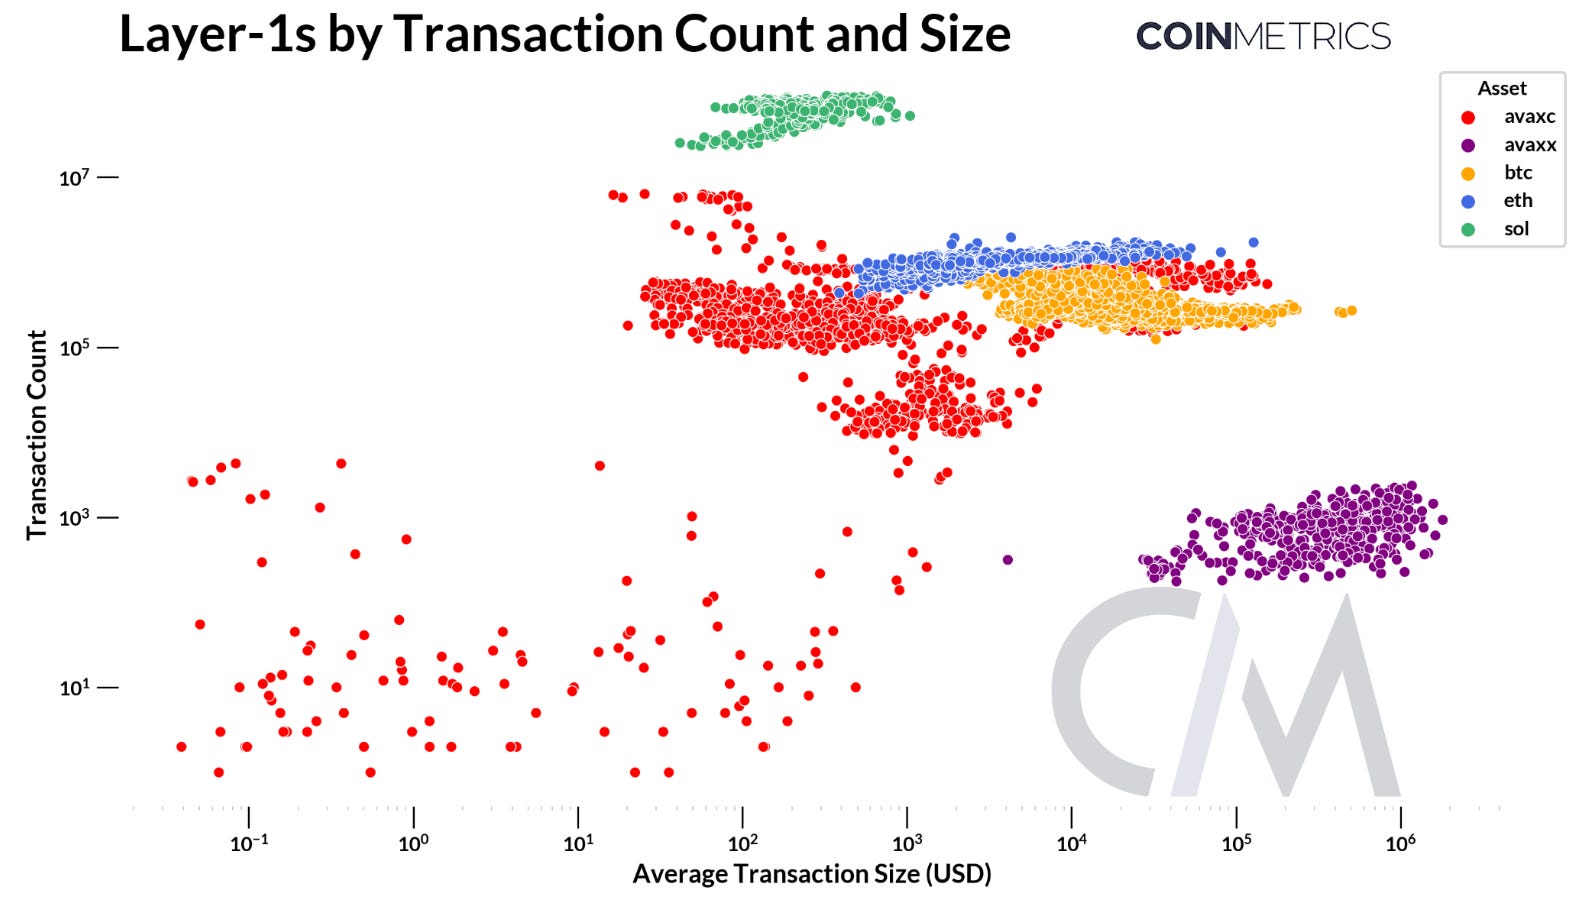
Source: Coin Metrics Network Data Pro, Nic Carter: Transaction Count is An Inferior Measure
As seen above, low-fee networks like Solana are optimized and primarily used for high-frequency, low value transactions. It’s important to note that Solana also includes validator vote transactions in a block (which have been removed from this plot to represent user-transactions). Bitcoin typically sees high-value transfers, aligning with its role as a store of value and settlement layer, while Ethereum lies between high-value transfers and more frequent, lower-value transactions, reflecting its nature as a general-purpose blockchain. Avalanche's variability suggests a flexible network capable of adapting to different use cases, stemming from its multi-chain architecture.
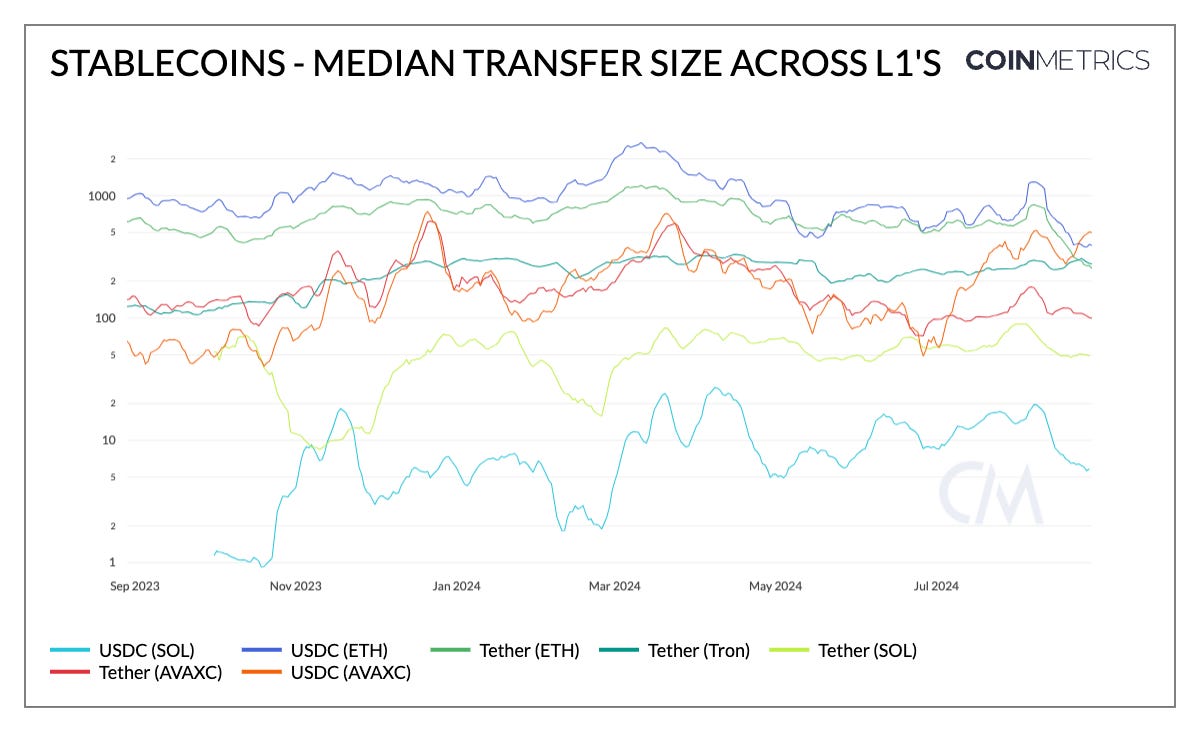
Source: Coin Metrics Network Data Pro
This trend is also reflected in the chart above, which displays the median transfer size of major stablecoins (USDC and USDT) across Layer–1’s. Both USDC and USDT on Ethereum have typically displayed a high median transfer size—albeit falling recently to $400 and $267, respectively—on the back of lower fees on Ethereum mainnet. Tether on Tron has maintained a typical size of $270, whereas Solana has the lowest stablecoin transfer-values ($7 for USDC) and ($50 for USDT).
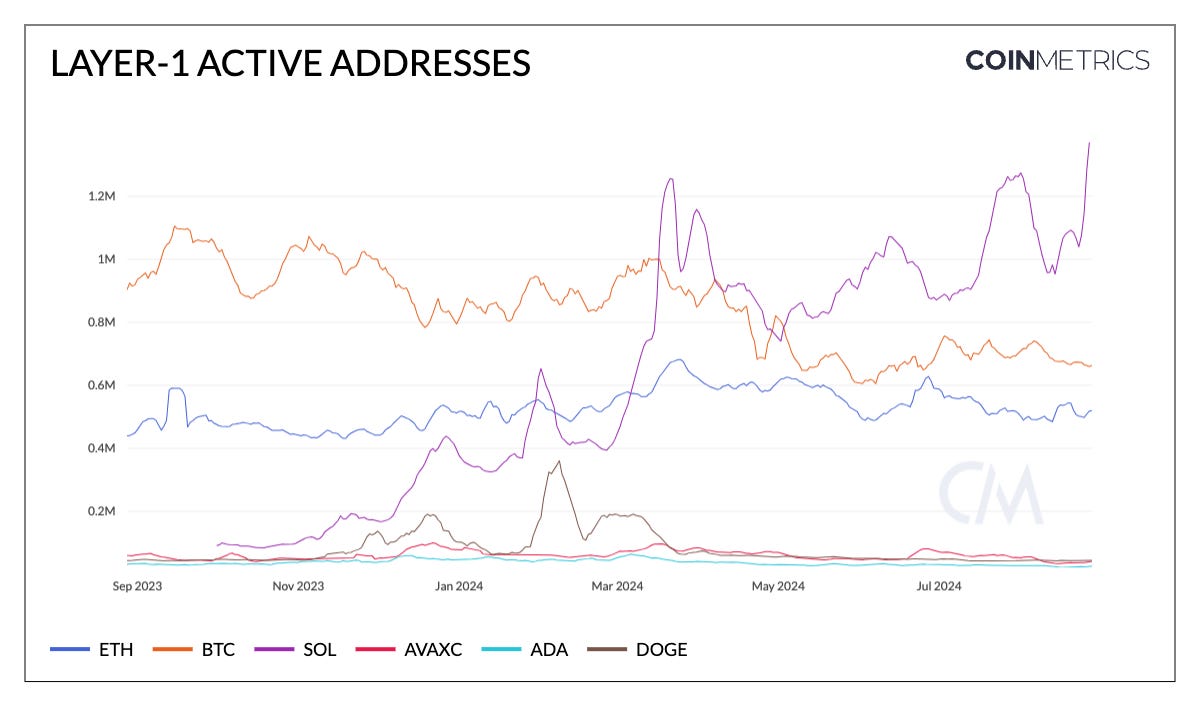
Source: Coin Metrics Network Data Pro
Daily active addresses across Layer–1s, representing the count of unique addresses active in the network each day, can serve as a proxy for blockchain adoption and activity. Bitcoin (672K) and Ethereum L1 (500K) have maintained relatively stable active address counts, while Solana has seen a ~219% increase in active wallets since January 2024—crossing 1.5M. When interpreting this metric, it's important to consider differences in blockchain architecture (UTXO vs. Account-based models), potential inflation due to bot activity and the distinction that an address does not necessarily equate to a unique user.
Conclusion
As the foundational layer for the on-chain ecosystem, Layer–1s will continue to garner significant attention. Looking ahead, technological improvements and the ability to attract adoption through its applications will shape the future of these networks. Ethereum’s upcoming Pectra upgrade, along with discussions around optimizing blob price discovery and L1 scalability, will enhance its performance and accessibility. Solana’s Breakpoint Conference could reveal key developments that further its high-throughput capabilities. Meanwhile, new entrants like Monad present opportunities for growth, adding to the competitive landscape.
While each Layer-1 follows along its roadmap, they will likely converge through different trade-offs—balancing scalability, security, and decentralization to meet the growing demands of blockchain adoption.
Network Data Insights
Summary Highlights
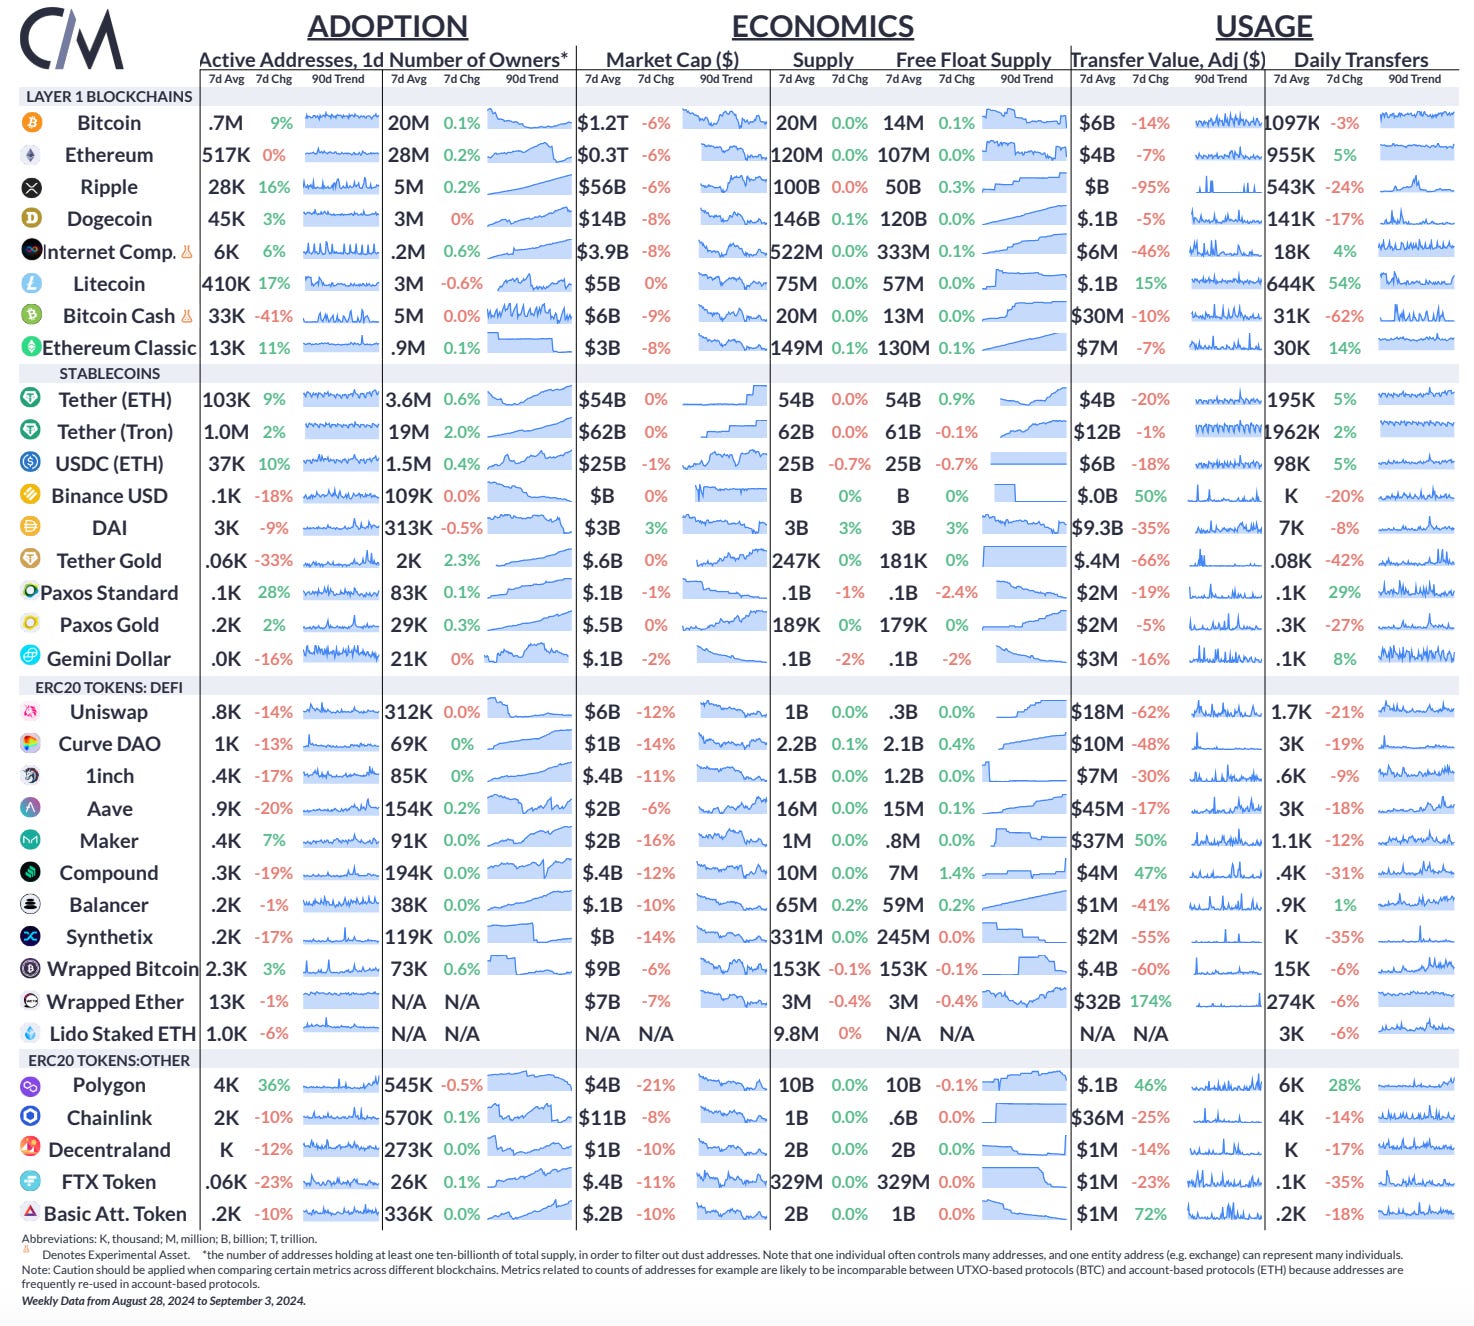
Source: Coin Metrics Network Data Pro
Daily active addresses on Bitcoin and Ripple rose by 9% and 16% over the week respectively. Polygon’s (MATIC) saw a 46% rise in USD adjusted transfer value and 28% increase in daily transfers as the MATIC token undergoes a transition to POL.
Coin Metrics Updates
This week’s updates from the Coin Metrics team:
Follow Coin Metrics’ State of the Market newsletter which contextualizes the week’s crypto market movements with concise commentary, rich visuals, and timely data.
Subscribe and Past Issues
As always, if you have any feedback or requests please let us know here.
Coin Metrics’ State of the Network, is an unbiased, weekly view of the crypto market informed by our own network (on-chain) and market data.
If you'd like to get State of the Network in your inbox, please subscribe here. You can see previous issues of State of the Network here.
© 2024 Coin Metrics Inc. All rights reserved. Redistribution is not permitted without consent. This newsletter does not constitute investment advice and is for informational purposes only and you should not make an investment decision on the basis of this information. The newsletter is provided “as is” and Coin Metrics will not be liable for any loss or damage resulting from information obtained from the newsletter.
Thanks for reading Coin Metrics' State of the Network! Subscribe for free to receive new posts and support my work.


