

Bitcoin (BTC) is at a crucial level after a sharp 15% drop from recent local highs. While analysts and crypto enthusiasts are speculating about the cause of this price drop, the general consensus is that demand is weakening.
Julio Moreno, head of research at CryptoQuant, provided an in-depth analysis of the situation, drawing on key market indicators and data to explain the ongoing shift.
His analysis suggests that the decline in demand is a factor driving BTC’s recent price action. As the crypto market navigates this turbulent period, uncertainty is increasing, making it difficult for investors to predict the next big move.
With widespread uncertainty among market participants, the coming days could be crucial for Bitcoin’s price trajectory as both bulls and bears battle it out at key levels. Will BTC recover, or is there more downside ahead? Investors are watching closely for signs of what’s to come.
Bitcoin (BTC) is currently facing significant selling pressure, mainly due to a significant decline in demand growth. According to Julio Moreno, head of research at CryptoQuant, this demand problem is reflected in various valuation metrics, which are stuck in bearish territory.
One of the clearest indicators is the current demand for BTC (30-day total), which has entered negative territory, indicating weak buying interest. Moreno Chia his analysis on X, noting that the most serious signals have appeared since July, when demand for BTC began to plummet.
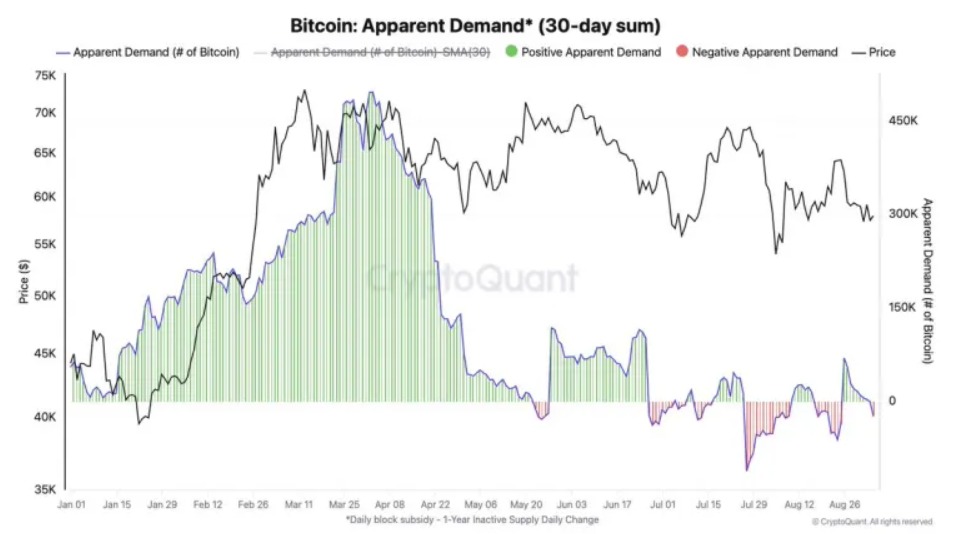
BTC Demand (30-day aggregate) is turning negative | Source: CryptoQuant Metrics
This sluggish demand growth is the core reason why Bitcoin price has struggled to recover and start a new uptrend. Although BTC attempted to recover earlier this year, the lack of new demand has prevented it from sustaining higher levels.
Moreno also pointed out that $55,500 is an important level to watch, representing the actual price of on-chain traders. The market could remain weak if it fails to reclaim this level, as it signals broader challenges in attracting new buyers. Investors are closely watching these indicators to determine whether the market can recover or if the decline will continue.
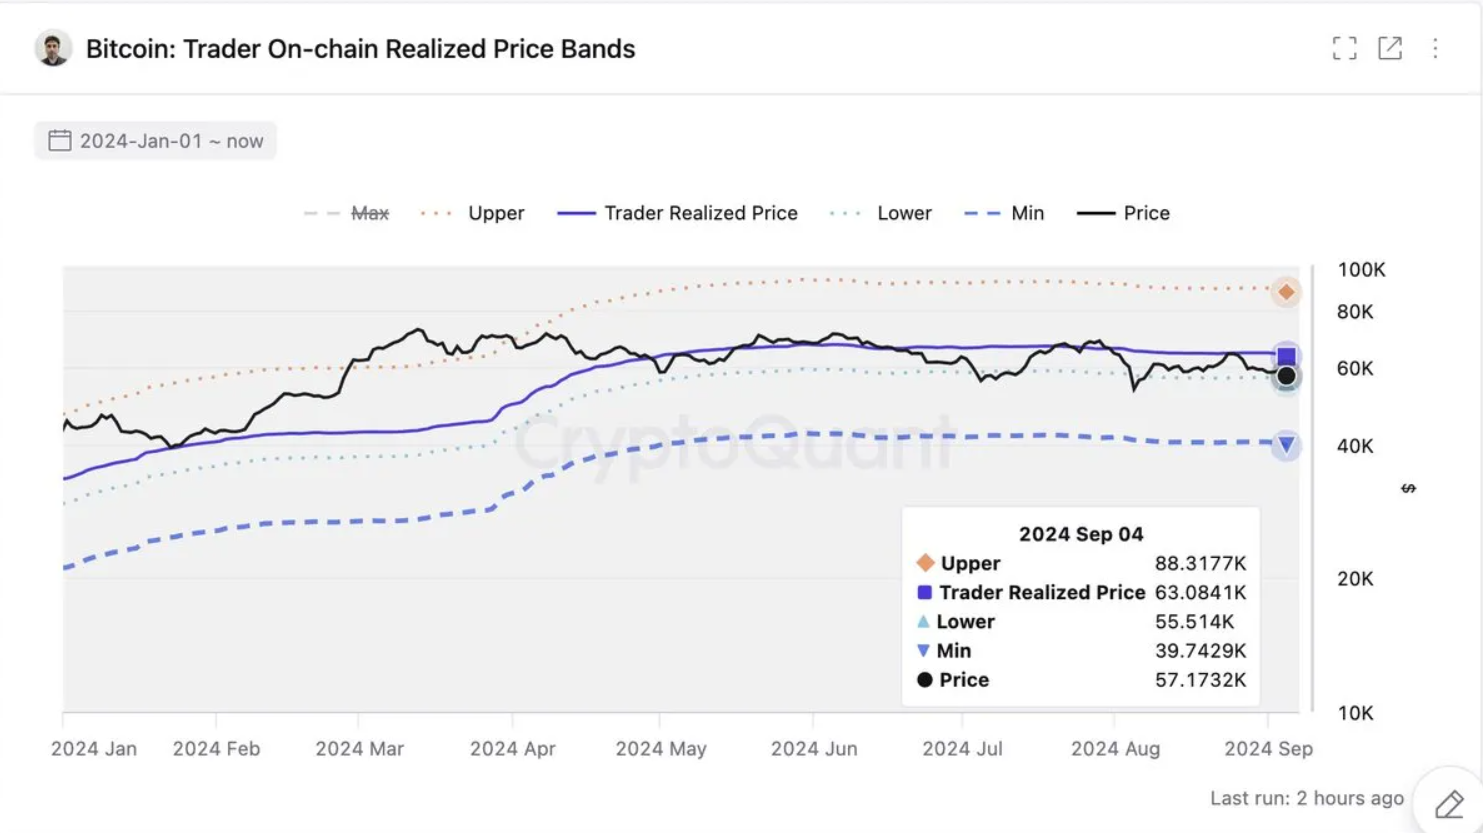
Source: CryptoQuant Metrics
Bitcoin (BTC) price has been trading inside a descending parallel channel since March 2024. This is a corrective pattern that usually leads to a breakout in the majority of cases.
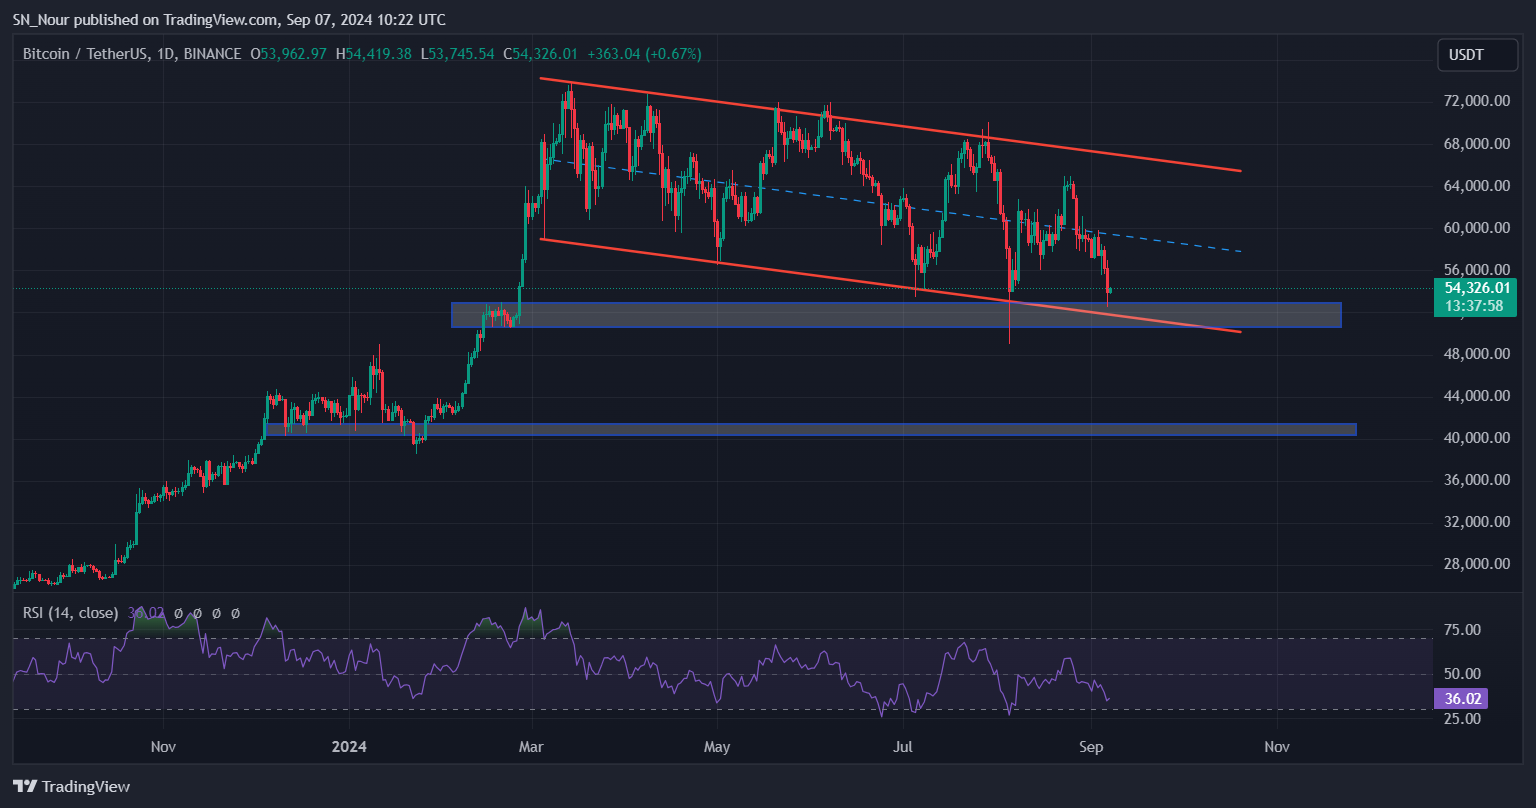
BTC/ USDT daily chart | Source: TradingView
Bitcoin (BTC) price is trading at $54,236, slightly below the important on-chain price level of $55,000. However, BTC price is still trading above the strong support zone of $50,000-$52,000, which coincides with the channel support line.
Therefore, demand could return when the price drops to this zone. A bounce from it could see BTC retest the channel midline at $58,500. However, a breakdown could lead to a sharp sell-off towards the next support zone at $40,000.
The daily RSI is forming hidden bullish divergences, supporting the recovery potential for BTC. So, a bounce from the $50,000-$52,000 support zone and the channel support line is higher.
You can XEM coin prices here.
Disclaimer: This article is for informational purposes only and is not investment advice. Investors should research carefully before making any decisions. We are not responsible for your investment decisions.
Join Telegram: https://t.me/tapchibitcoinvn
Follow Twitter: https://twitter.com/tapchibtc_io
Follow Tiktok: https://www.tiktok.com/@tapchibitcoin
SN_Nour
According to Bitcoinist


