


Get the best data-driven crypto insights and analysis every week:
By: Matías Andrade, Kevin Bornatsch
Key Takeaways:
Key health metrics include block time consistency, transaction inclusion rates, measures of centralization, and validator participation—informing critical institutional decisions.
Increased institutionalization has heightened the importance of network performance, making health monitoring essential for risk management.
Advanced market surveillance and risk management tools are becoming vital for institutions in the evolving crypto landscape.
Introduction
Network health has become a critical focus for institutional participants in the cryptocurrency space. As digital asset markets mature and attract more significant players, the demand for reliable, real-time metrics to assess network performance and stability has grown exponentially. In this week’s issue of Coin Metrics’ State of the Network, we explore the importance of network health, its impact on institutional operations, and how advanced surveillance tools are shaping risk management strategies in the crypto ecosystem.
What is Network Health and Why Does it Matter?
Network health is a comprehensive concept with varied interpretations across the industry. At the highest level, Coin Metrics considers network health to include all factors that indicate if the network is operating as expected. This can include factors such as: if blocks are being produced as expected (i.e., is the blockchain functional and capable of processing new transactions), if the mempool is receiving transactions at a normal rate (i.e., is the network undergoing a DDOS attack), if the number of transactions broadcast are within the expected range and if supply for the native asset that's being used to secure the network is behaving as expected (i.e., do economic security considerations for the network continue to apply).
While "Network Health" is a broad term, we consider it the most fundamental and overarching indicator of network functionality. Significant deviations from expected values in any of these areas may signal critical underlying network issues with far-reaching implications.
Network Health Metrics: The Vital Signs of Blockchain Networks
In traditional financial markets, institutions rely on a variety of indicators to gauge market health and inform their strategies. Similarly, in the crypto space, a set of key metrics has emerged to measure the robustness and efficiency of blockchain networks. These include:
Block Time Consistency: Regular block times are indicative of a well-functioning network.
Transaction Inclusion: Regular and timely inclusion of transactions in blocks reflects the network’s efficiency in processing transactions. High inclusion rates of transactions in the mempool suggest a healthy, uncongested network.
Decentralization & Censorship Resistance: Supply distribution shows the decentralization of the asset while compositions of consensus participants (i.e., miners or validators) is an indicator of how decentralized consensus is and by extension censorship resistant a network is.
Validator Participation Rates: Crucial in Proof-of-Stake networks like Ethereum, high participation rates indicate a secure and decentralized network.
For institutional customers, these metrics aren't just numbers—they're vital signs that inform critical operational and investment decisions, whether it's for tokenizing a fund or launching a layer-2. Each of these metrics provides crucial insights into different aspects of network performance.
The Stakes for Institutional Participants
The cryptocurrency market's increasing institutionalization has raised the stakes for network performance and reliability. Institutional players, including investment funds, banks, and financial service providers, operate in an environment where even minor disruptions can have significant consequences, as evidenced by the reluctance of institutional actors to adopt networks with downtime or other sources of execution risk.
Consider the following scenarios:
A hedge fund executing a time-sensitive arbitrage strategy across multiple exchanges and networks.
A custodian service ensuring the secure transfer of large volumes of assets for clients in a timely manner while minimizing fees paid to the network.
A DeFi protocol managing billions in total value locked (TVL) across various blockchain networks .
In each of these cases, network health isn't just a technical consideration—it's a critical business factor. Institutions require not just high performance, but also assurances and predictability. They need to know that transactions will be processed within expected timeframes, that the network can handle sudden spikes in activity, and that there are no looming security threats that could compromise their operations or assets.
This is where comprehensive network health monitoring becomes indispensable. By having access to real-time, accurate data on network performance, institutions can make informed decisions about transaction timing and fee allocation, provide better service and assurances to their clients, and manage risk more effectively across their digital asset operations.
In the section ahead, we lay out the major subcategories that comprise network health, including consensus health and centralization for Proof-of-work (PoW) and Proof-of-stake (PoS) networks.
Consensus Health
Proof-of-Work (PoW)
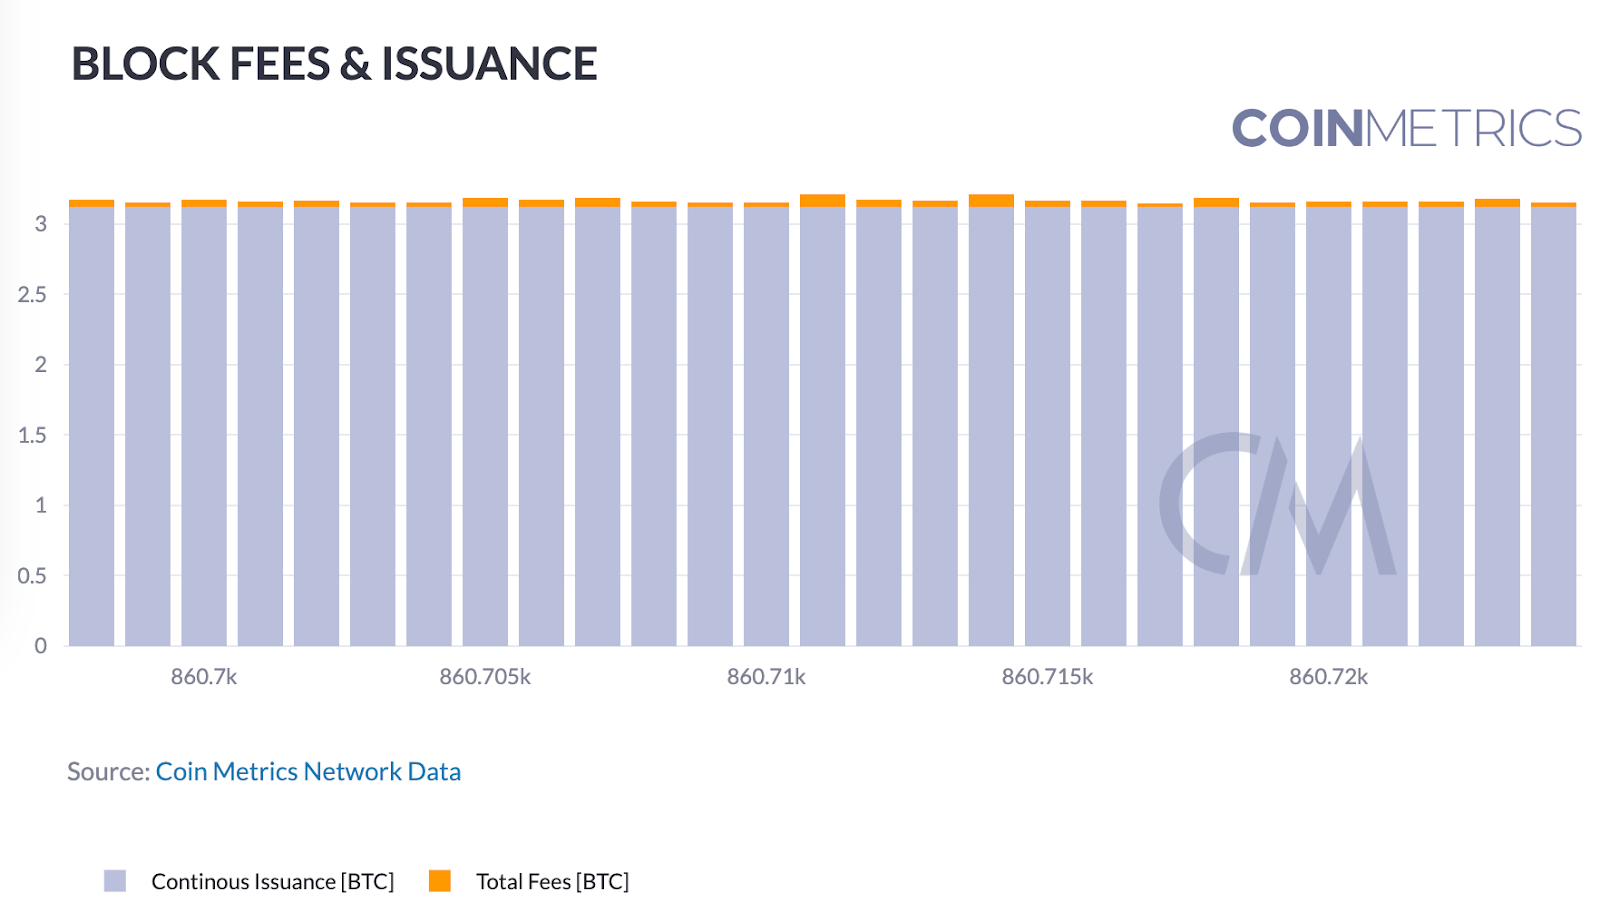
One key indicator of PoW consensus health is the relationship between block fees and issuance, which provides insights into the network's economic model and miner incentives. The chart below illustrates the remarkable stability of block fees and issuance for Bitcoin over recent blocks (860,545 to 860,57). This consistency is a positive sign for Bitcoin's network health, indicating a balanced and predictable reward structure for miners which secure the network.
Mining pool dynamics play a crucial role in the decentralization and overall health of Proof-of-Work networks like Bitcoin. The chart below illustrates two key metrics: the current average mining pool rewards (in BTC) and the spread across mining pools.
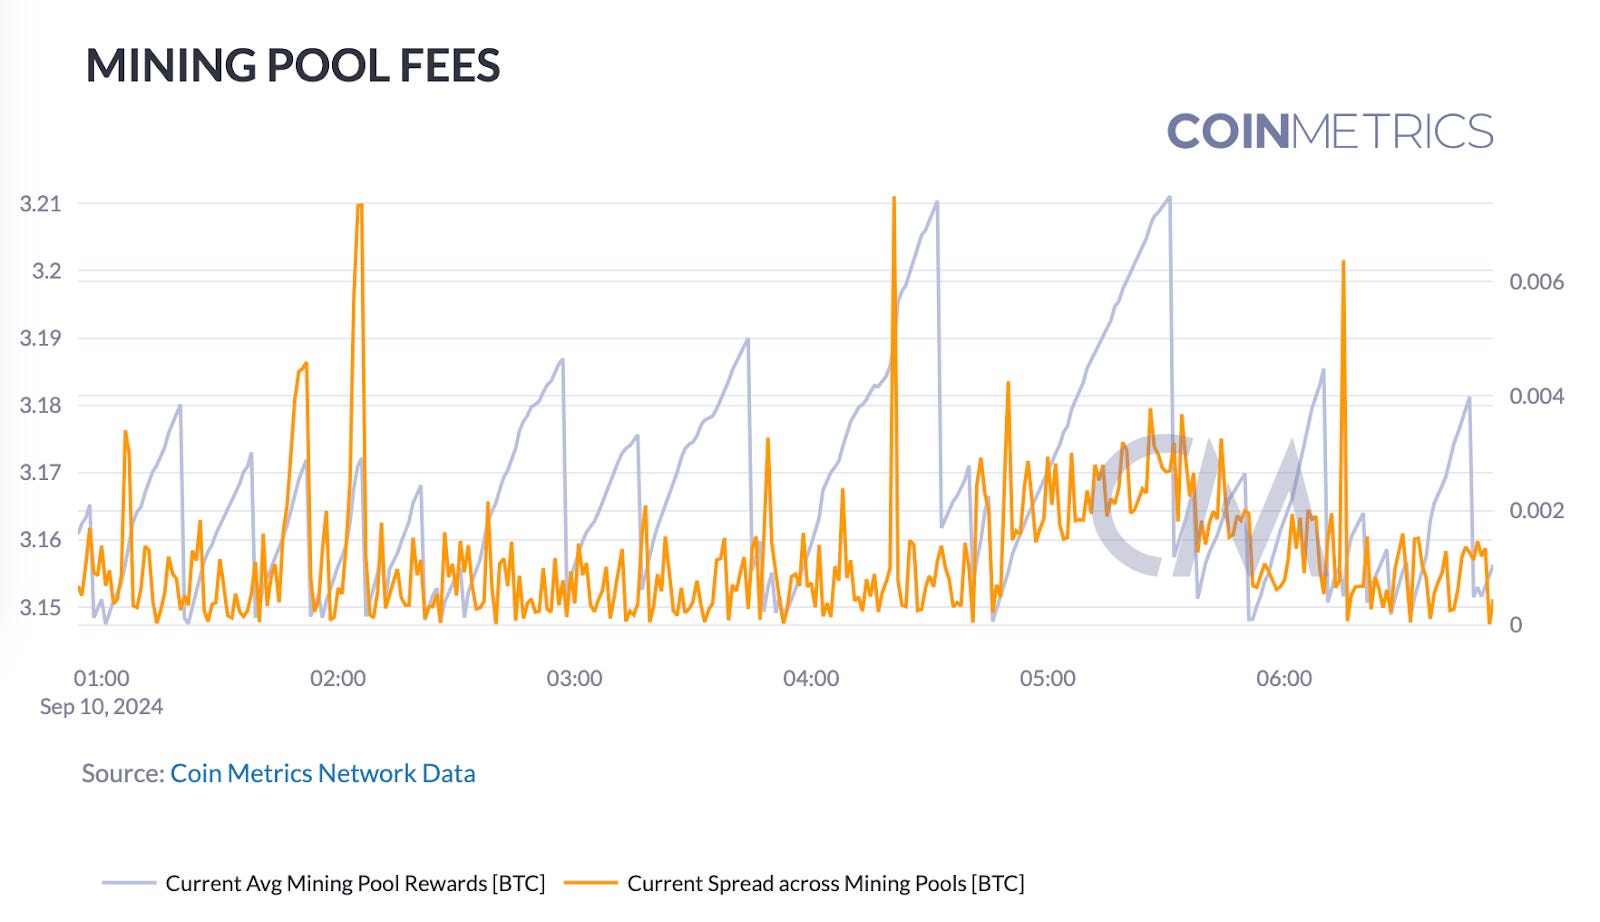
The average mining pool rewards (shown in blue) fluctuate between approximately 3.14 and 3.2 BTC per block. These fluctuations likely correspond to variations in transaction fees included in blocks. The spread across mining pools (in orange) remains relatively stable, hovering close to zero, with a few notable spikes. These spikes could indicate temporary shifts in hash rate distribution or strategic fee adjustments by certain pools. The overall stability suggests a competitive and relatively balanced mining ecosystem. On the other hand, a consistent, elevated spread across mining pools could indicate that certain mining pools are either under performing or that specific mining pools have access to a set of transactions that the rest of mining pools do not have access to.
Proof-of-Stake (PoS)
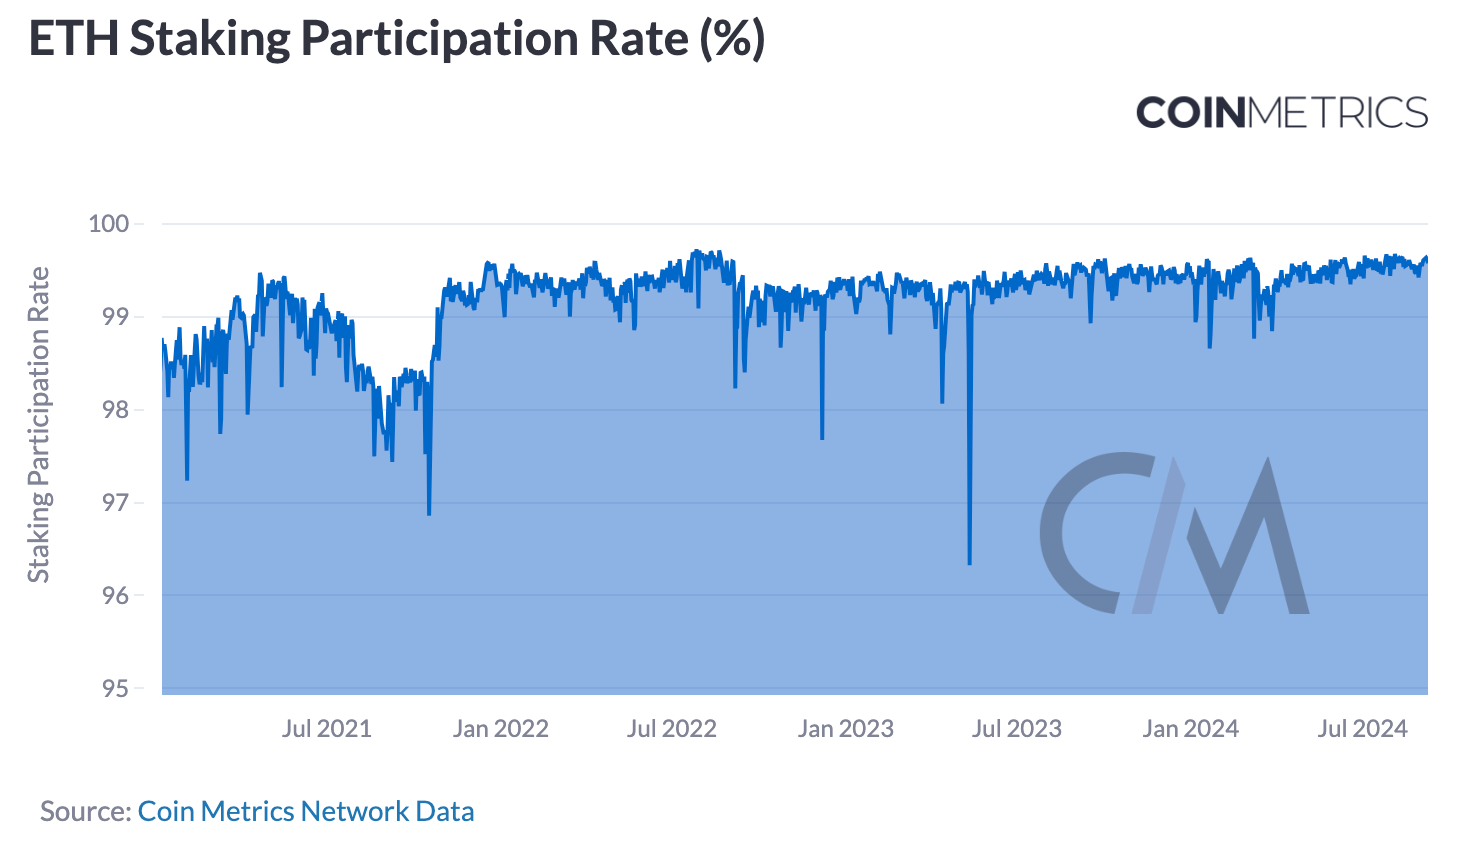
Proof-of-Stake networks rely on validator participation and adherence to protocol rules to maintain consensus and security. The charts below provide crucial insights into the health and stability of Ethereum.
The chart below shows the percentage of active validators that are successfully attesting to blocks. The rate consistently hovers above 99%, indicating a highly engaged validator set. However, we observe periodic dips. The fluctuations pictured below, while minor, could represent temporary network issues, validator maintenance, or other short-term disruptions, which in the past have been observed as a result of bugs in validator code and outages in cloud service providers, such as AWS.
The chart below provides a view of penalty and slashing activity in the Ethereum network, illustrating the network's disincentives against underperforming or misbehaving validators. The chart shows regular penalty events, likely reflecting missed attestations or proposals, aggregated across the ~1.07M active validators. Slashing events occur a lot less frequently, indicating that validators are overall performing their duties without any major disruptions or malicious behavior.
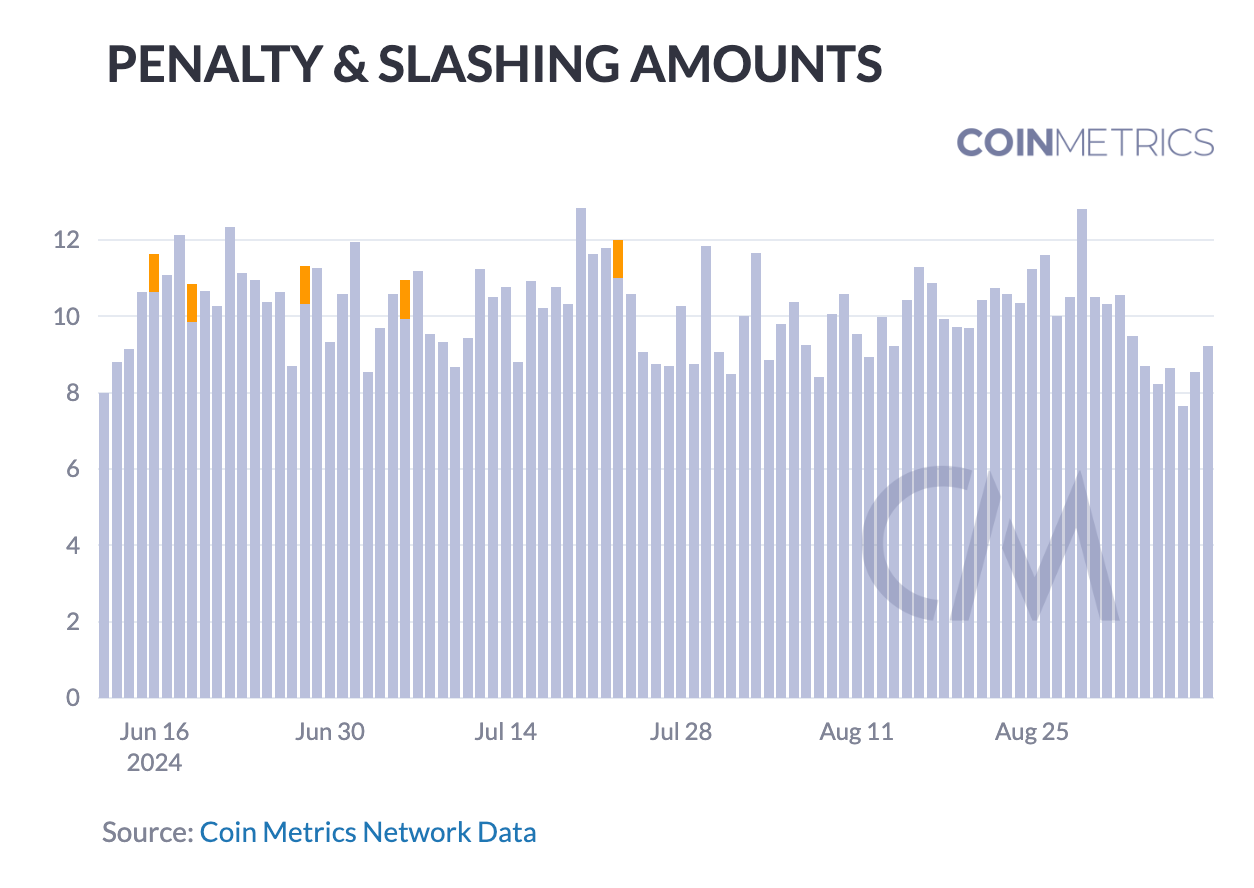
If Ethereum was under attack, or if it was facing mass outages among validators (which would not inherently affect network liveness), one would be able to respond rapidly by monitoring these metrics.
Centralization
The health and security of blockchain networks heavily depend on the distribution of mining power and block production. These charts provide crucial insights into the centralization trends of Bitcoin mining pools and Ethereum block builders over the past year.
Mining Pool Dominance
The chart below showcases the mining pool distribution for Bitcoin from September 2023 - early September 2024, revealing several noteworthy trends. Foundry, AntPool and MARA are evidenced as consistent hashrate leaders. Notably, the presence of numerous smaller miners, represented by “Other,” has remained relatively stable, suggesting a healthy level of decentralization within the Bitcoin mining ecosystem.
Future trends and consistency in the distribution of mining power is a critical metric to follow as it reduces the risk of censorship and potential manipulation. While the overall distribution is the key factor to monitor, previous research analyzing on-chain flows between miners has shown there that there might be additional factors that call into question into the independence of mining pool operations.
Block Builder/Validator Centralization (Ethereum)
The bottom chart shows the distribution of Ethereum block builders, revealing some interesting trends. Notably, beaverbuild.org and titanbuilder.xyz have emerged as the two most dominant block builders, particularly from early 2024 onwards, responsible for building nearly 80% of all blocks by September 2024. Despite this concentration, the presence of multiple smaller builders suggests an ongoing competition in the block building space. However, a trend towards centralization is evident, as a few major builders have consolidated their positions over time.
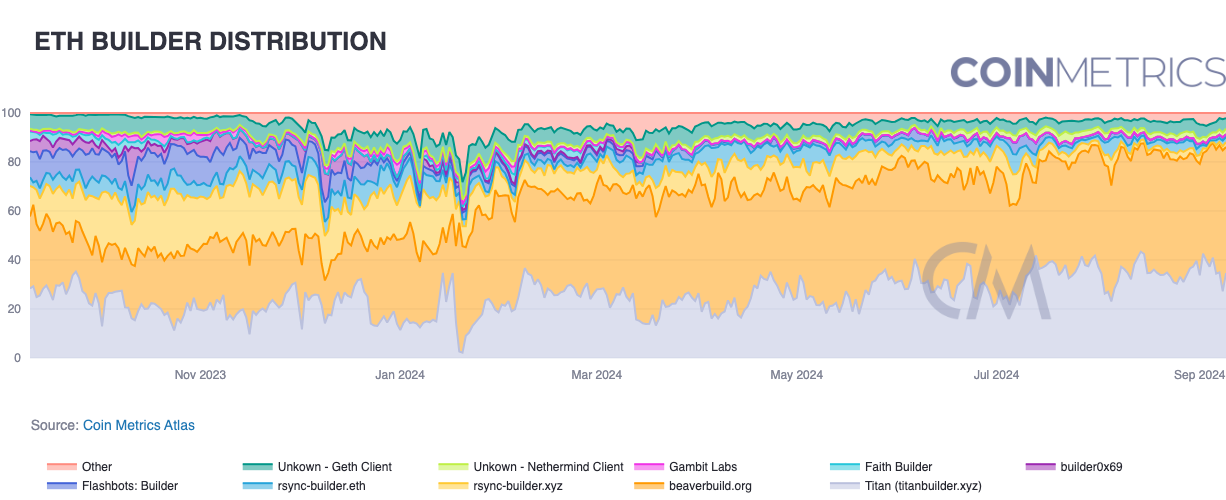
This gradual consolidation of block building power warrants close monitoring, as it could have potential implications for transaction ordering and Miner Extractable Value (MEV) within the Ethereum network, including time-attacks and transaction censorship.
Conclusion
The crypto market's rapid evolution has brought with it a new set of risks and challenges. For institutional participants, navigating these waters requires not just an understanding of network health, but also advanced tools for market surveillance and risk management. Coin Metrics' suite of data products stands at the forefront of this need, offering institutions the ability to monitor network health, assess liquidity risk using Coin Metrics’ order book data and liquidity metrics across various trading pairs and exchanges, and optimize operational efficiency, reduce downtime and minimize transaction failures.
As we look to the future, the role of network health monitoring and market surveillance in the institutional crypto space is set to grow even further. The institutions that thrive will be those that not only understand the importance of these metrics but also actively incorporate them into their decision-making processes. For institutional participants, staying ahead of this curve isn't just an advantage—it's a necessity.
Network Data Insights
Summary Highlights
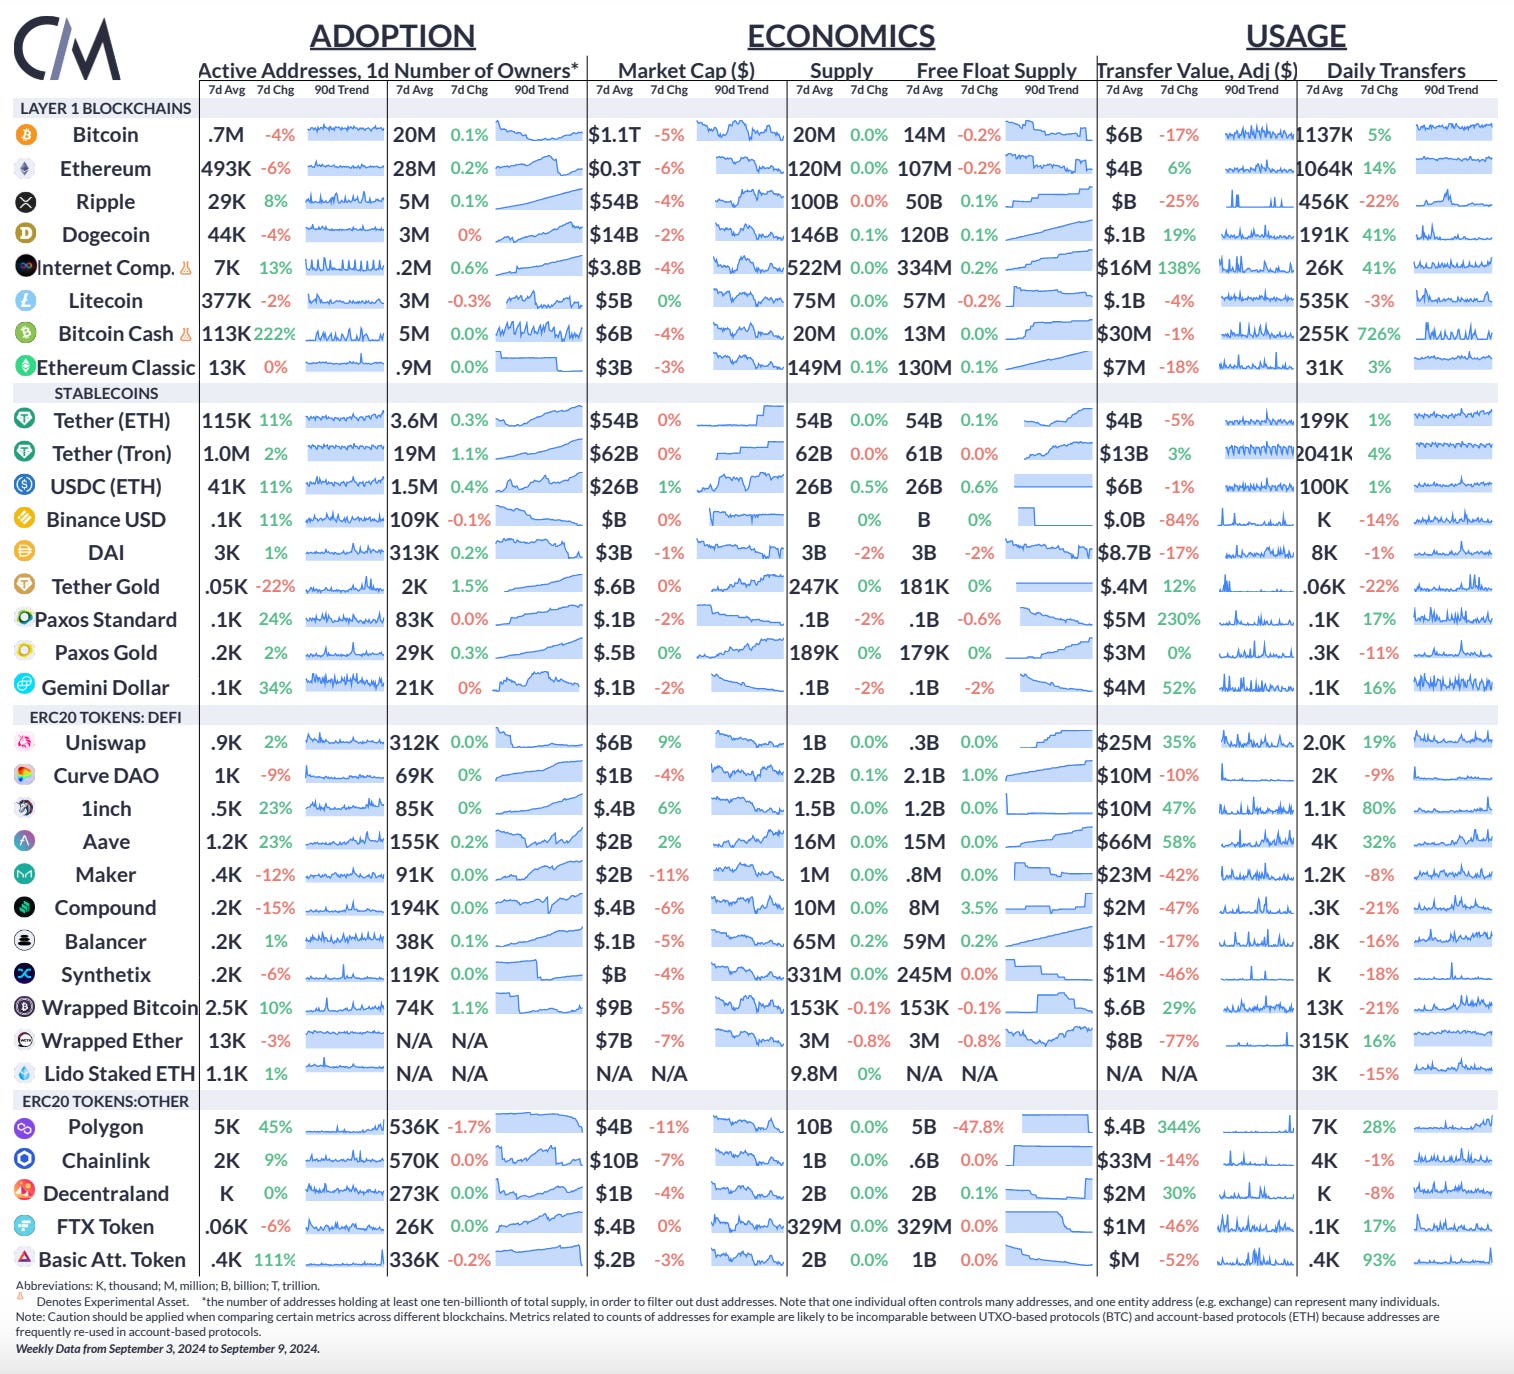
Source: Coin Metrics Network Data Pro
Several ERC-20s including 1INCH and AAVE displayed heightened activity, while active addresses for Polygon’s MATIC increased by 45% as users migrate, bridge or swap to POL amid its transition.
Coin Metrics Updates
This week’s updates from the Coin Metrics team:
Follow Coin Metrics’ State of the Market newsletter which contextualizes the week’s crypto market movements with concise commentary, rich visuals, and timely data.
Subscribe and Past Issues
As always, if you have any feedback or requests please let us know here.
Coin Metrics’ State of the Network, is an unbiased, weekly view of the crypto market informed by our own network (on-chain) and market data.
If you'd like to get State of the Network in your inbox, please subscribe here. You can see previous issues of State of the Network here.


