

summary
- The hash rate remains slightly below its all-time high, and continued investment by miners despite falling revenues demonstrates tremendous confidence in the Bitcoin network.
- Investor interaction with exchanges is decreasing, and an overall decline in trading volumes suggests a weakening of investor and trading interest.
- Both Bitcoin and Ethereum ETFs have seen outflows, however, investor interest in Bitcoin ETFs remains significantly larger in size and volume
miner
Miners remain the fundamental participants of the Bitcoin network and the main source of new coin production. Miners provide the hashing power used to discover the next valid block, and the network automatically rewards them with newly issued coins and transaction fees.
This makes mining an extremely challenging industry as they have no control over either the input cost of energy or the output cost of BTC.
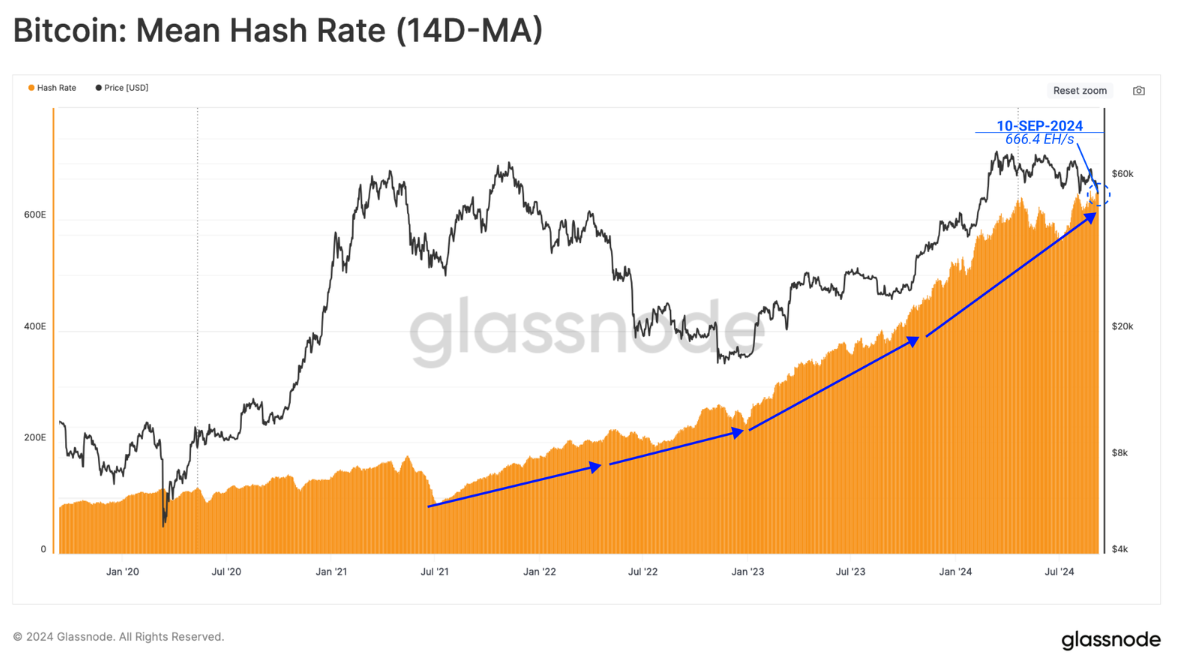
Despite volatile and uncertain market conditions, Bitcoin miners continue to install new ASIC hardware, pushing up the overall hash rate (14D-MA) to 666.4EH/s, just 1% below the ATH.
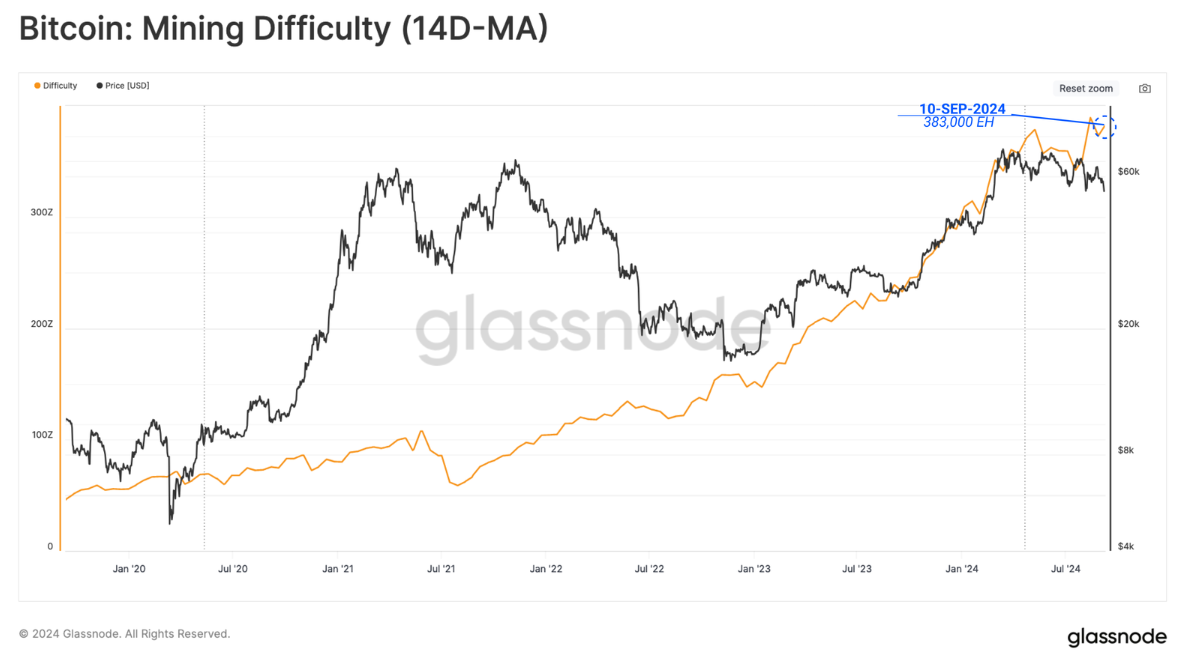
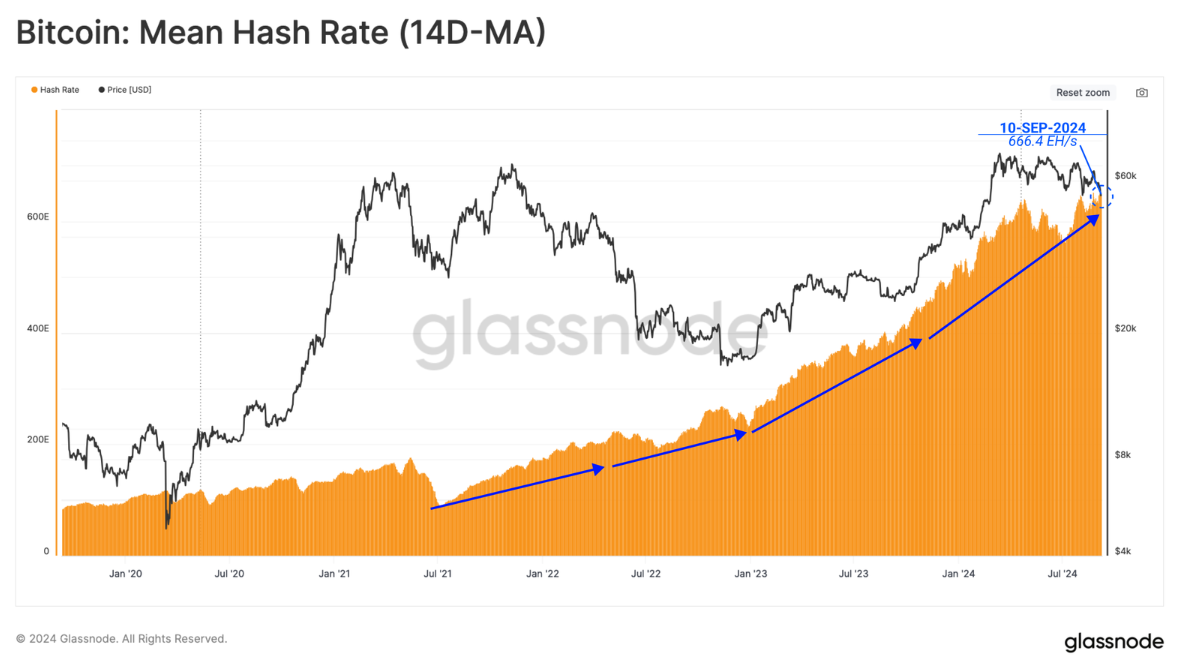 As the hash rate increases, the target difficulty for successfully mining a valid block also increases. The Bitcoin protocol automatically adjusts the difficulty to accommodate increases and decreases in the hash rate on the network.
Currently, the average hashrate required to mine a block is 338k exahash. This is the second-highest difficulty in Bitcoin’s history, highlighting the growing competition in the mining industry.
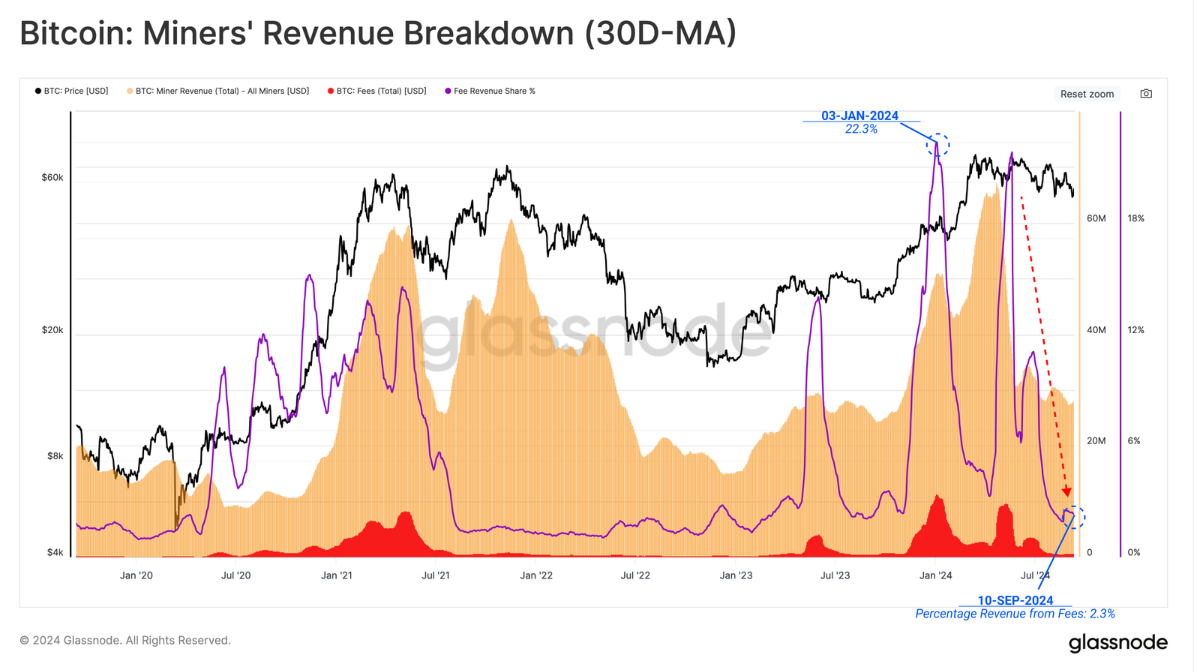
However, since the market price hit a new high in March, miner revenue has fallen significantly. A large part of the decline in revenue can be attributed to the decline in fee pressure. This is due to the decline in demand for currency transfers and the decline in fees generated by rune and inscription related transactions.
With spot prices above $55,000, miner revenues related to block subsidies remain relatively high, but are still around 22% below their previous highs.
- Block subsidy revenue: $824 million
- Transaction fee income: $20 million
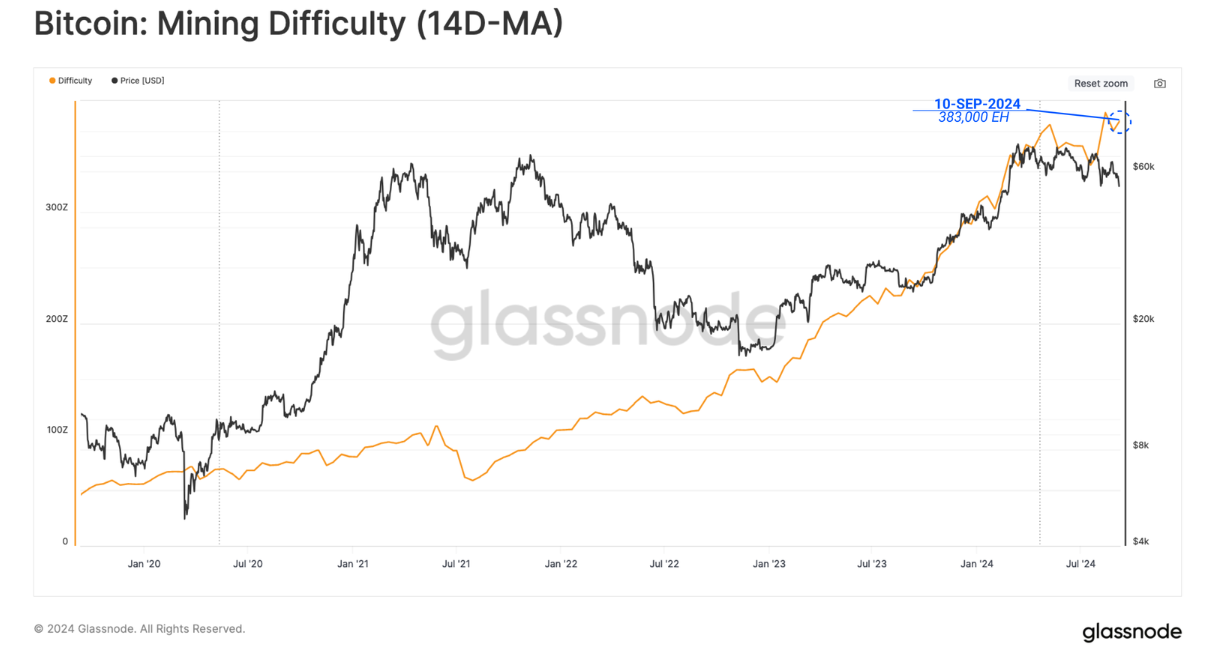
As the hash rate increases, the target difficulty for successfully mining a valid block also increases. The Bitcoin protocol automatically adjusts the difficulty to accommodate increases and decreases in the hash rate on the network.
Currently, the average hashrate required to mine a block is 338k exahash. This is the second-highest difficulty in Bitcoin’s history, highlighting the growing competition in the mining industry.
However, since the market price hit a new high in March, miner revenue has fallen significantly. A large part of the decline in revenue can be attributed to the decline in fee pressure. This is due to the decline in demand for currency transfers and the decline in fees generated by rune and inscription related transactions.
With spot prices above $55,000, miner revenues related to block subsidies remain relatively high, but are still around 22% below their previous highs.
- Block subsidy revenue: $824 million
- Transaction fee income: $20 million
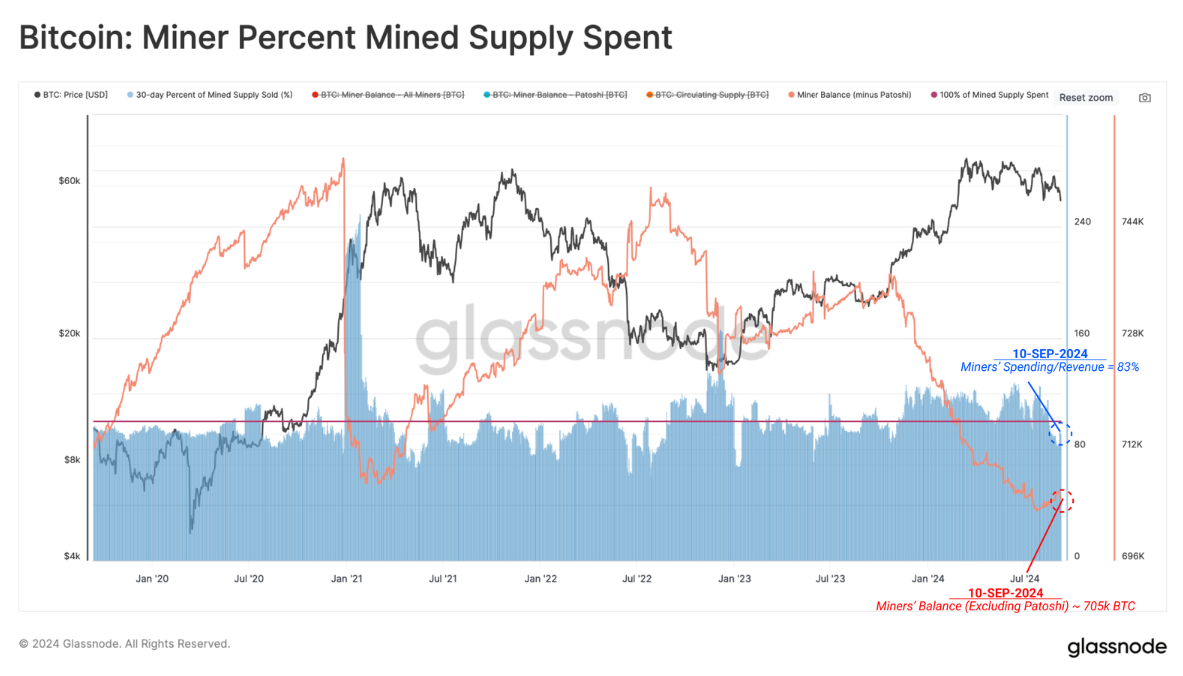
As revenues decline, we can infer that some level of revenue pressure may be setting in. We can estimate the percentage of mining supply that miners spend over a 30-day period to gauge whether this is the case.
Due to the competitive and capital-intensive nature of the mining industry, miners have historically needed to allocate a large portion of mined coins to cover input costs. Interestingly, miners have shifted from making a net allocation of mined coins to now retaining a portion of mined coins in their treasury reserves.
This highlights an interesting development, as miners tend to be pro-cyclical, being sellers during dips and holders during rallies. Rising hash rate and difficulty mean that BTC is becoming increasingly expensive to produce, which could adversely affect miner profitability in the near future.
Settlements slow down
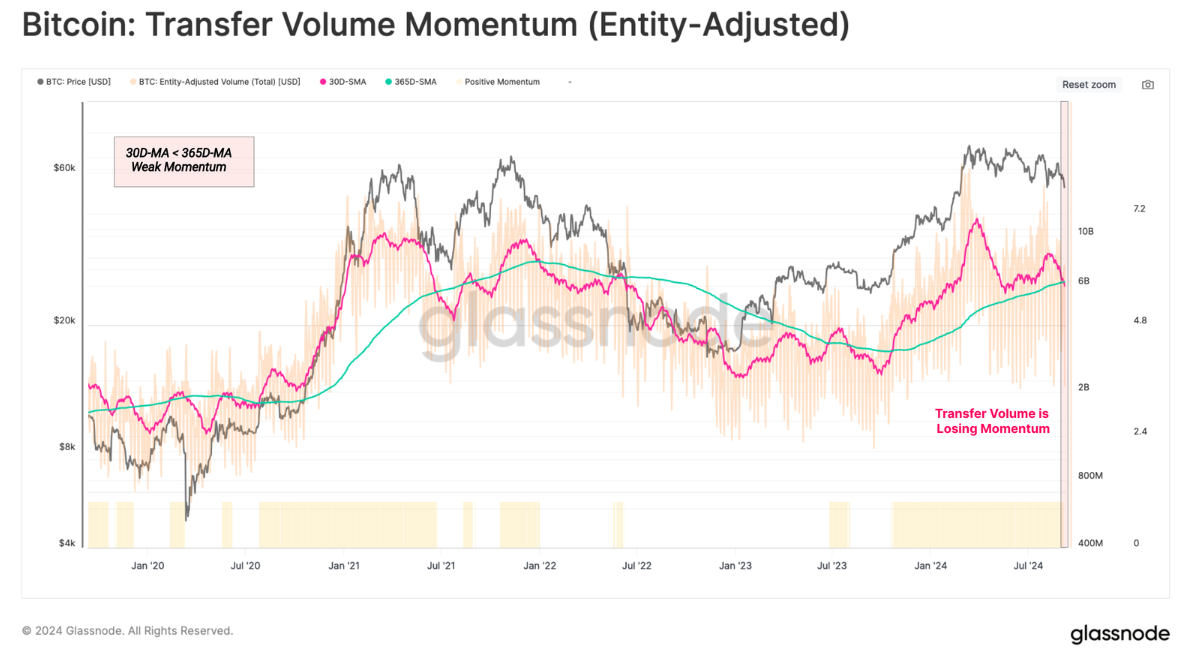
The amount of transactions settled on-chain can also reflect the level of adoption and health of the network. When filtering for entity-adjusted transaction volume, the network currently processes and settles approximately $6.2 billion in transactions per day.
However, settlement volumes are beginning to decline towards their annual averages, indicating a clear decline in network usage and throughput. Overall, this is a net negative observation.
Declining willingness to trade
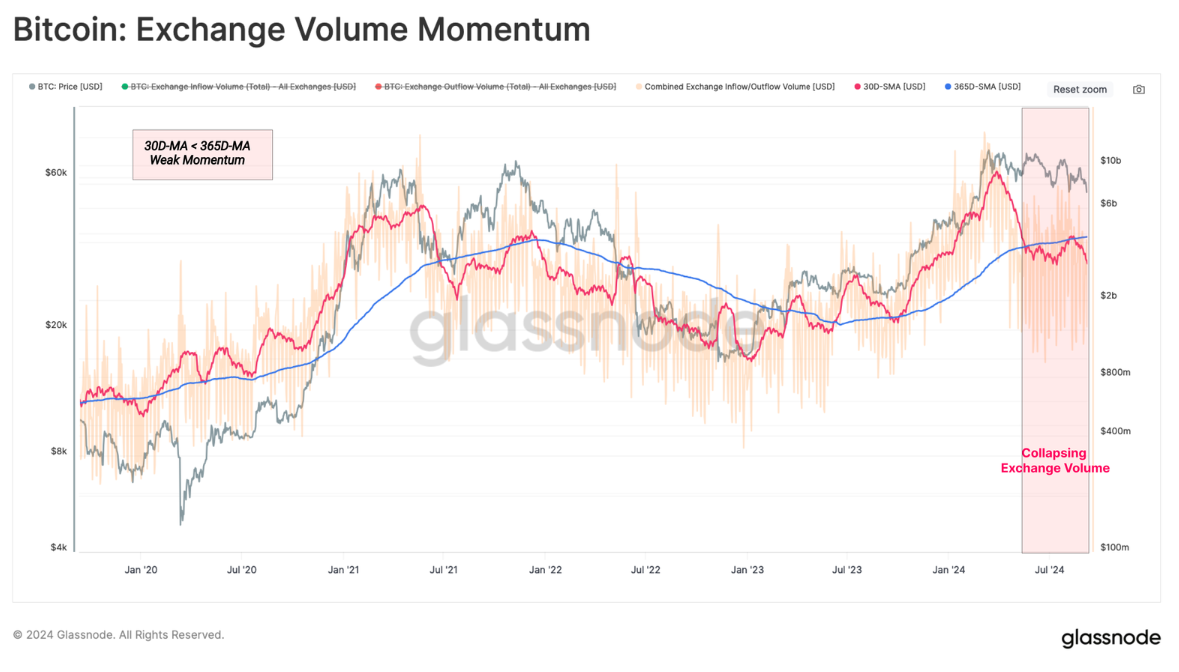
Centralized exchanges have been central venues for speculative activity and price discovery in a changing market landscape. Therefore, we can assess the on-chain volume of these venues as an indicator of investor activity and speculative interest.
Performing a similar 30/365 day momentum crossover for exchange related inflows and outflows, we can see that the monthly average volume is well below the annual average volume. This highlights the decline in investor demand and the reduction in speculative trading within the current price range.
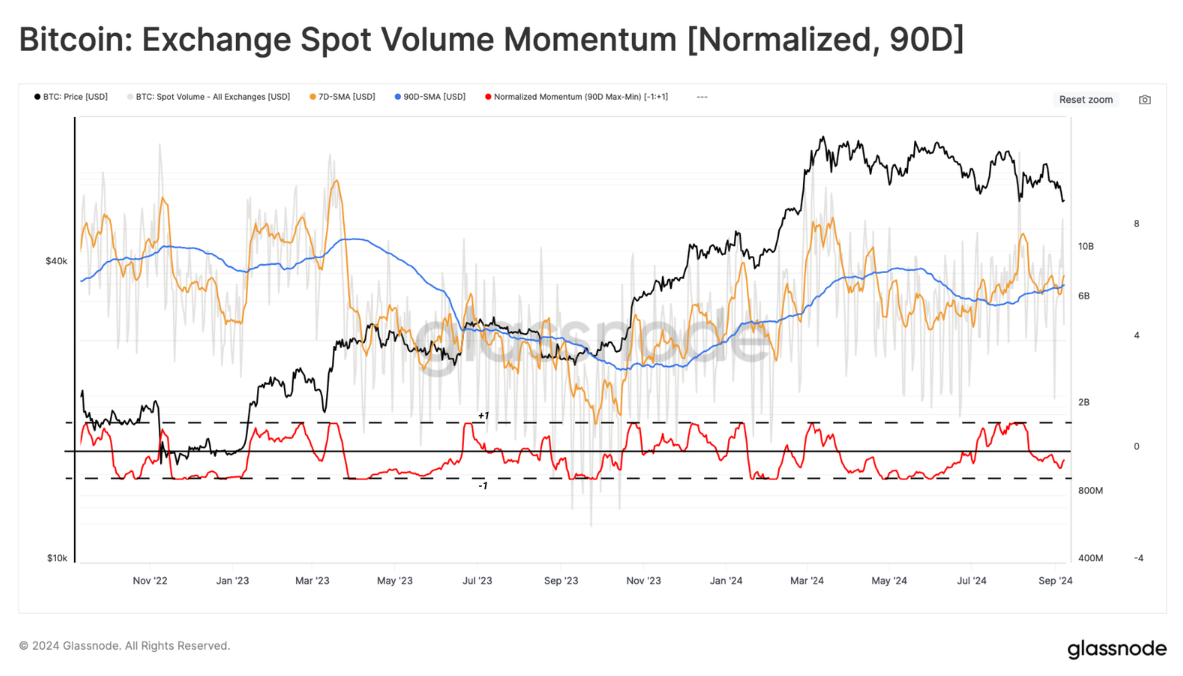
 Next, we will look at the spot volume on the exchange. Here we apply the 90d MinMax scalar, which normalizes the value set relative to the maximum and minimum values of the selected period in the range 1 to -1.
This shows that spot volume momentum continues to weaken, which is similar to previous observations. This further confirms the view that trading activity has clearly declined in the last quarter.
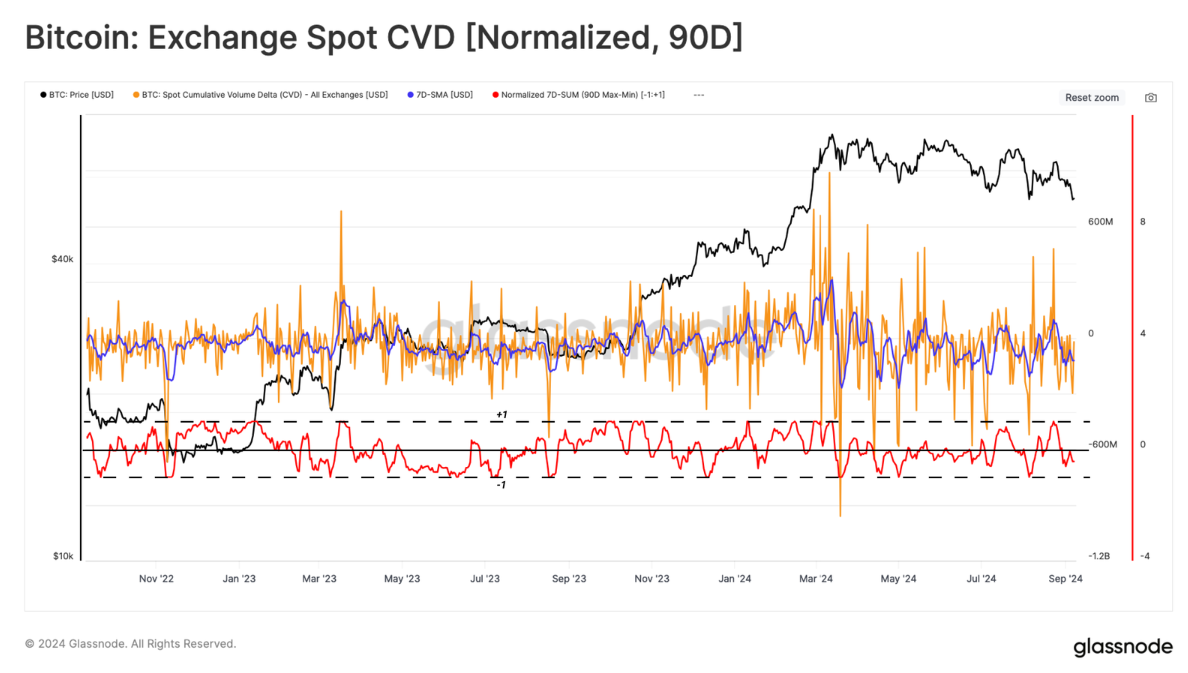
The CVD indicator estimates the current net balance between buying and selling pressure in the spot market. Using the same methodology, we note that investor selling pressure has been increasing over the past 90 days, causing price action to slope downward.
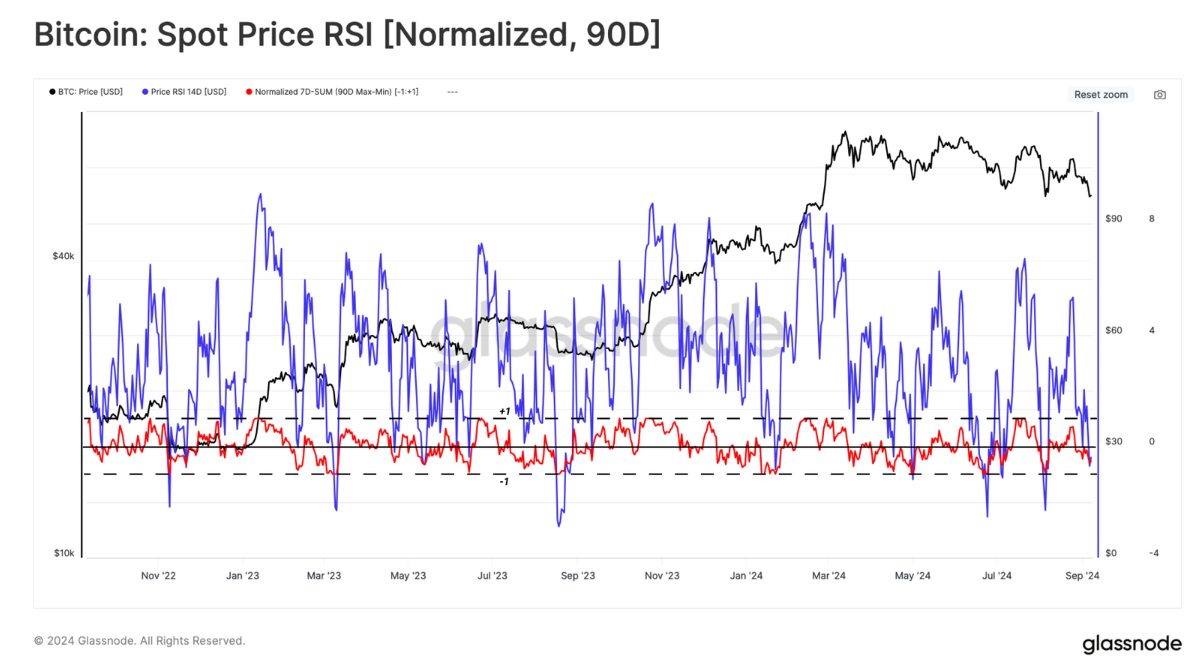
Finally, we can assess the momentum of Bitcoin’s price. Here, we can see a degree of indecision, with both positive and negative data points occurring in August. This is in stark contrast to the two indicators highlighted previously, both of which were clearly negative during the same period.
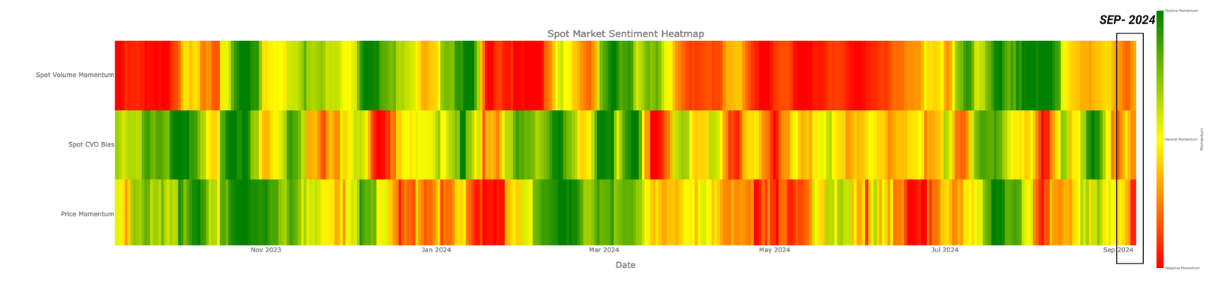
Combining the MinMax transformation of volume, CVD, and price action separately, we are able to generate a sentiment heatmap of feature values between 1 and -1. We can think of this in the following framework:
- 🟢 A value of 1 indicates a higher risk
- 🟡 0 means medium risk
- 🔴 -1 means low risk
All three indicators suggest that the market is entering a low risk zone relative to the past 90 days of data points. This convergence between the spot indicators discussed can translate into decreasing (spot volume momentum) selling volume (CVD < 0) while price action is slowly declining. This structure could be vulnerable to external forces and could break out on either side if the situation changes.
 ETF
ETF
The Ethereum ETF has now followed the launch of the U.S. Bitcoin ETF in August. These two events marked a “Rubicon crossing” event for the digital asset ecosystem, providing traditional U.S. markets with an easy entry point to the leading two cryptocurrencies.
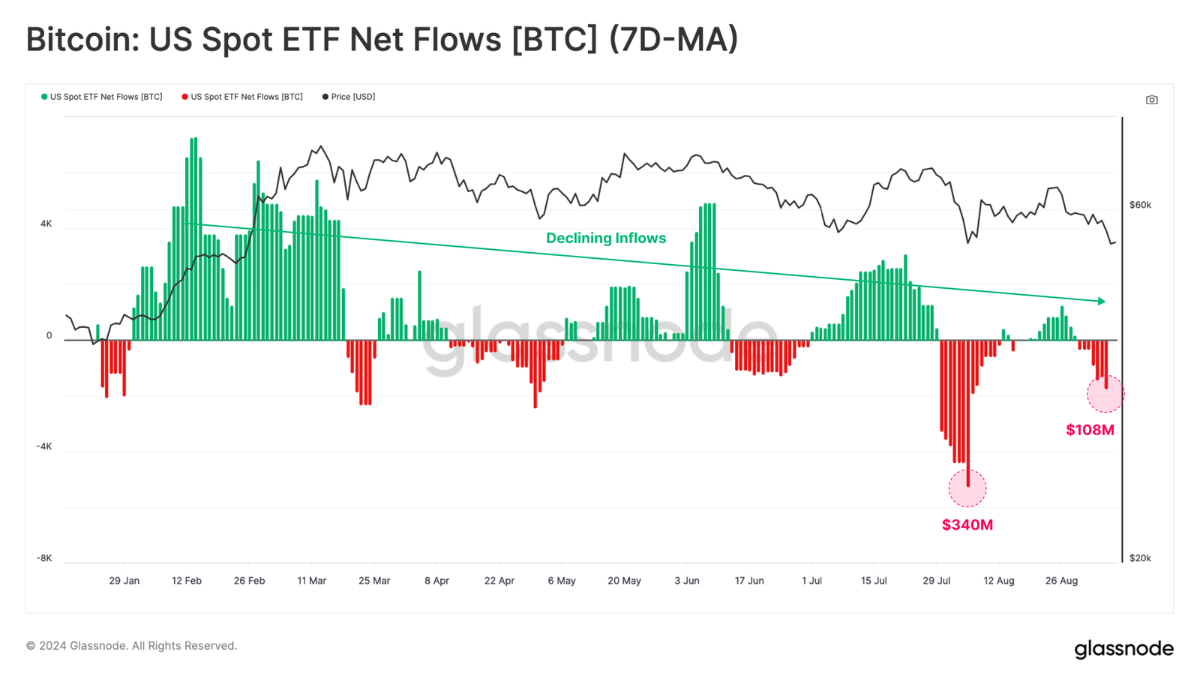
Starting with Bitcoin ETFs, we can see that net capital flows in USD have weakened since August 2024, with weekly outflows currently at $107 million.
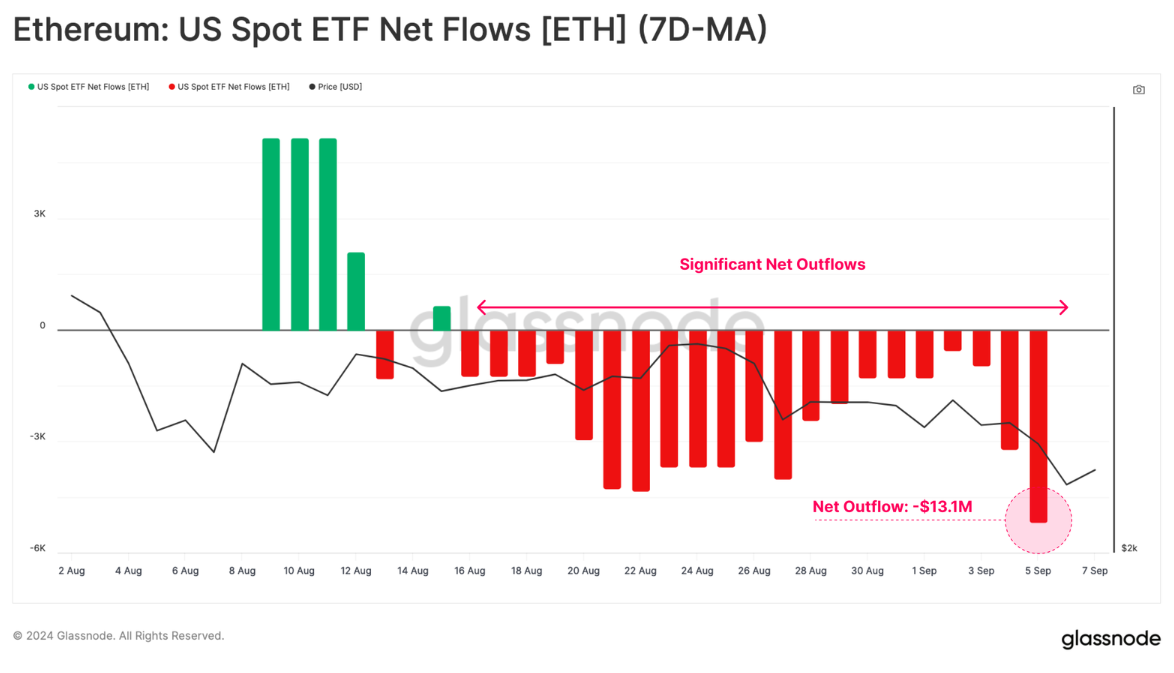
Ethereum ETFs have seen relatively low demand recently, with net negative outflows. This is mainly due to redemptions from Grayscale’s ETHE product, while inflows from other instruments have not been sufficient to offset this demand.
Overall, Ethereum ETFs have seen total outflows of $13.1 million. This highlights the difference in demand size between BTC and ETH, at least in current market conditions.
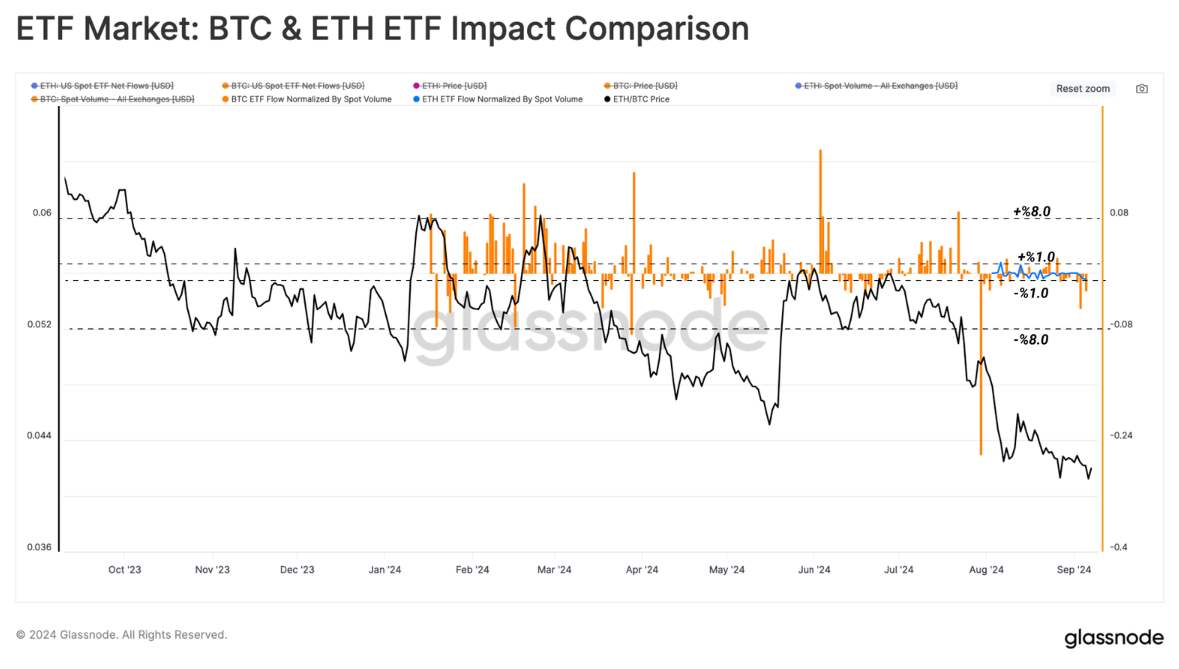
To approximate the impact of ETFs on the Bitcoin and Ethereum markets, we have normalized the ETF net flow deviation by the corresponding spot volume. This ratio allows us to directly compare the relative weight of ETFs in each market.
As shown in the chart below, the relative influence of ETFs on the Ethereum market is equivalent to ±1% of spot trading volume, while the Bitcoin ETF is ±8%. This shows that although the Bitcoin ETF has normalized, people's interest in Bitcoin ETFs is still an order of magnitude greater than that of Ethereum ETFs.
Summarize
Miners continue to show great confidence in the Bitcoin network, with hash rate remaining slightly below all-time highs despite a significant drop in revenue . However, as miners tend to be pro-cyclical, being sellers during declines and holders during rises, some level of seller pressure can be expected if further declines occur.
At the same time, investor interaction with exchanges continued to decline, and trading volumes shrank across the board, indicating a weakening interest in both investors and trading. This was also evident among institutional investors, with both Bitcoin and Ethereum ETFs experiencing net outflows.


