
DOT’s fate may soon change. Here are some of the things that may happen next:
- DOT shows signs of bottoming, could break out of descending channel, target $7
- Momentum appears to be building, with whale accumulation evident
If you want to know more about the crypto and get first-hand cutting-edge information, please visit Weibo Dolphin 1 for more good articles .
Polkadot [DOT] is once again in the spotlight today as the coin appears to be bottoming out after a long downtrend on the charts.
DOT could be ready for a big rally, with a bullish rally expected in the fourth quarter. His analysis points to clear signs of accumulation — a sign that DOT could be preparing for a big move higher.
At press time, DOT is trading at $4.32, up 2.27% over the past 24 hours. Now, this suggests that there could be potential for a breakout, but how convincing is this prospect?
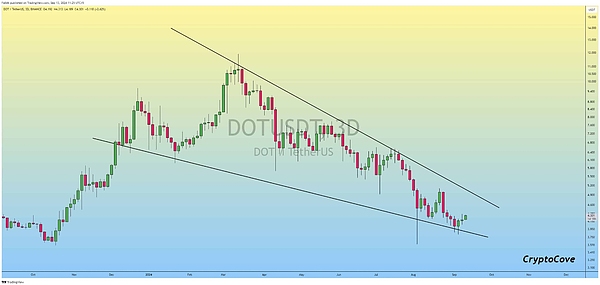
Key Technical Setup – Breakout of Downtrend
The price of DOT has been trapped in a descending channel since the beginning of 2024, with the Altcoin’s value steadily declining. However, recent charts show that the coin is currently rebounding from a descending support line at $4.19. A descending channel is a pattern that, when broken to the upside, often signals a trend reversal and renewed bullish momentum.
The above analysis also shows that DOT may have bottomed out around $4. This provides a solid base for further accumulation. If DOT breaks out of this channel, the next key resistance level will be between $5 and $6, with a potential upside target of up to $7 in the fourth quarter.
On-chain activity: Whale accumulation is increasing
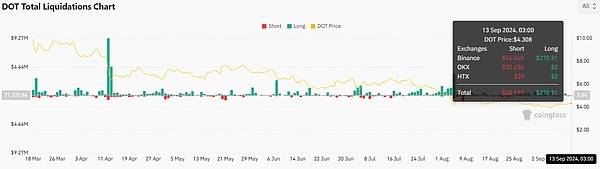
On-chain data shows that whales have been actively accumulating DOT — a sign that they are very confident in the asset’s long-term performance. The circulating supply of DOT is 1.492 billion, and the Altcoin has a market cap of $6.44 billion.
Additionally, 24-hour trading volume reached $86.22 million, indicating that liquidity remains stable despite recent market turmoil. Liquidations also showed that $48.69 million of short positions were liquidated, suggesting a possible short squeeze.
Technical indicators – Is momentum building?
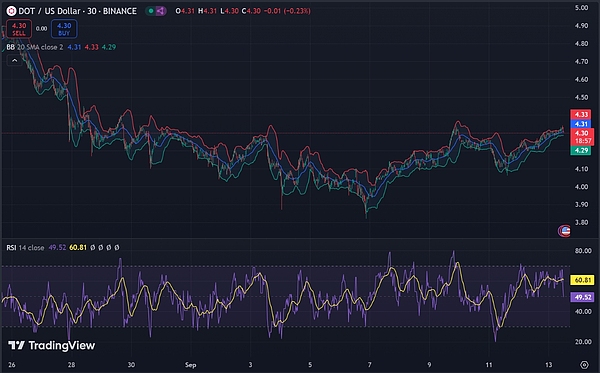
At press time, the relative strength index (RSI) had improved, rising from oversold territory to 60.81 - a sign that bullish momentum could be building.
Additionally, the Bollinger Bands (BB) show that DOT may be testing its upper limit at $4.33. This usually indicates increasing buying pressure on the chart. If the price continues to approach the upper limit, it may signal an imminent breakout.
Is DOT ready for a Q4 bull run?
With an improving technical setup and increasing whale accumulation, DOT appears poised for a breakout in Q4.
A breakout above the critical resistance level of $5 to $6 could push prices higher, possibly to $7, as historical patterns suggest. However, a confirmed breakout remains crucial to solidify this bullish outlook.
The article ends here. Follow Weibo Dolphin Dolphin 1 for more good articles. If you want to know more about the relevant knowledge of the crypto and first-hand cutting-edge information, please consult me. We have the most professional communication community, publishing market analysis and high-quality potential currency recommendations every day. There is no threshold to join the group, and everyone is welcome to communicate together!


