

Ethereum (ETH) has been performing sharply against Bitcoin (BTC) since July 24, with the ETH/BTC pair now at its lowest point in three years. As market sentiment for ETH becomes increasingly bearish, many analysts are predicting further declines in the coin’s value.
This article analyzes the key insights that ETH holders need to know as the situation continues to unfold.
Ethereum Overshadowed by Bitcoin Due to Weak Network Activity
The ETH/BTC pair represents the price ratio of Ethereum (ETH) to Bitcoin (BTC). An increase in this ratio means that ETH is rising faster than BTC or that BTC is falling. A decrease in the ratio means that BTC is rising faster than ETH or that ETH is underperforming.
The current ETH/BTC rate is 0.039, the lowest level since April 2021. The decline began on July 24 after the pair broke below the horizontal channel where it was trading.
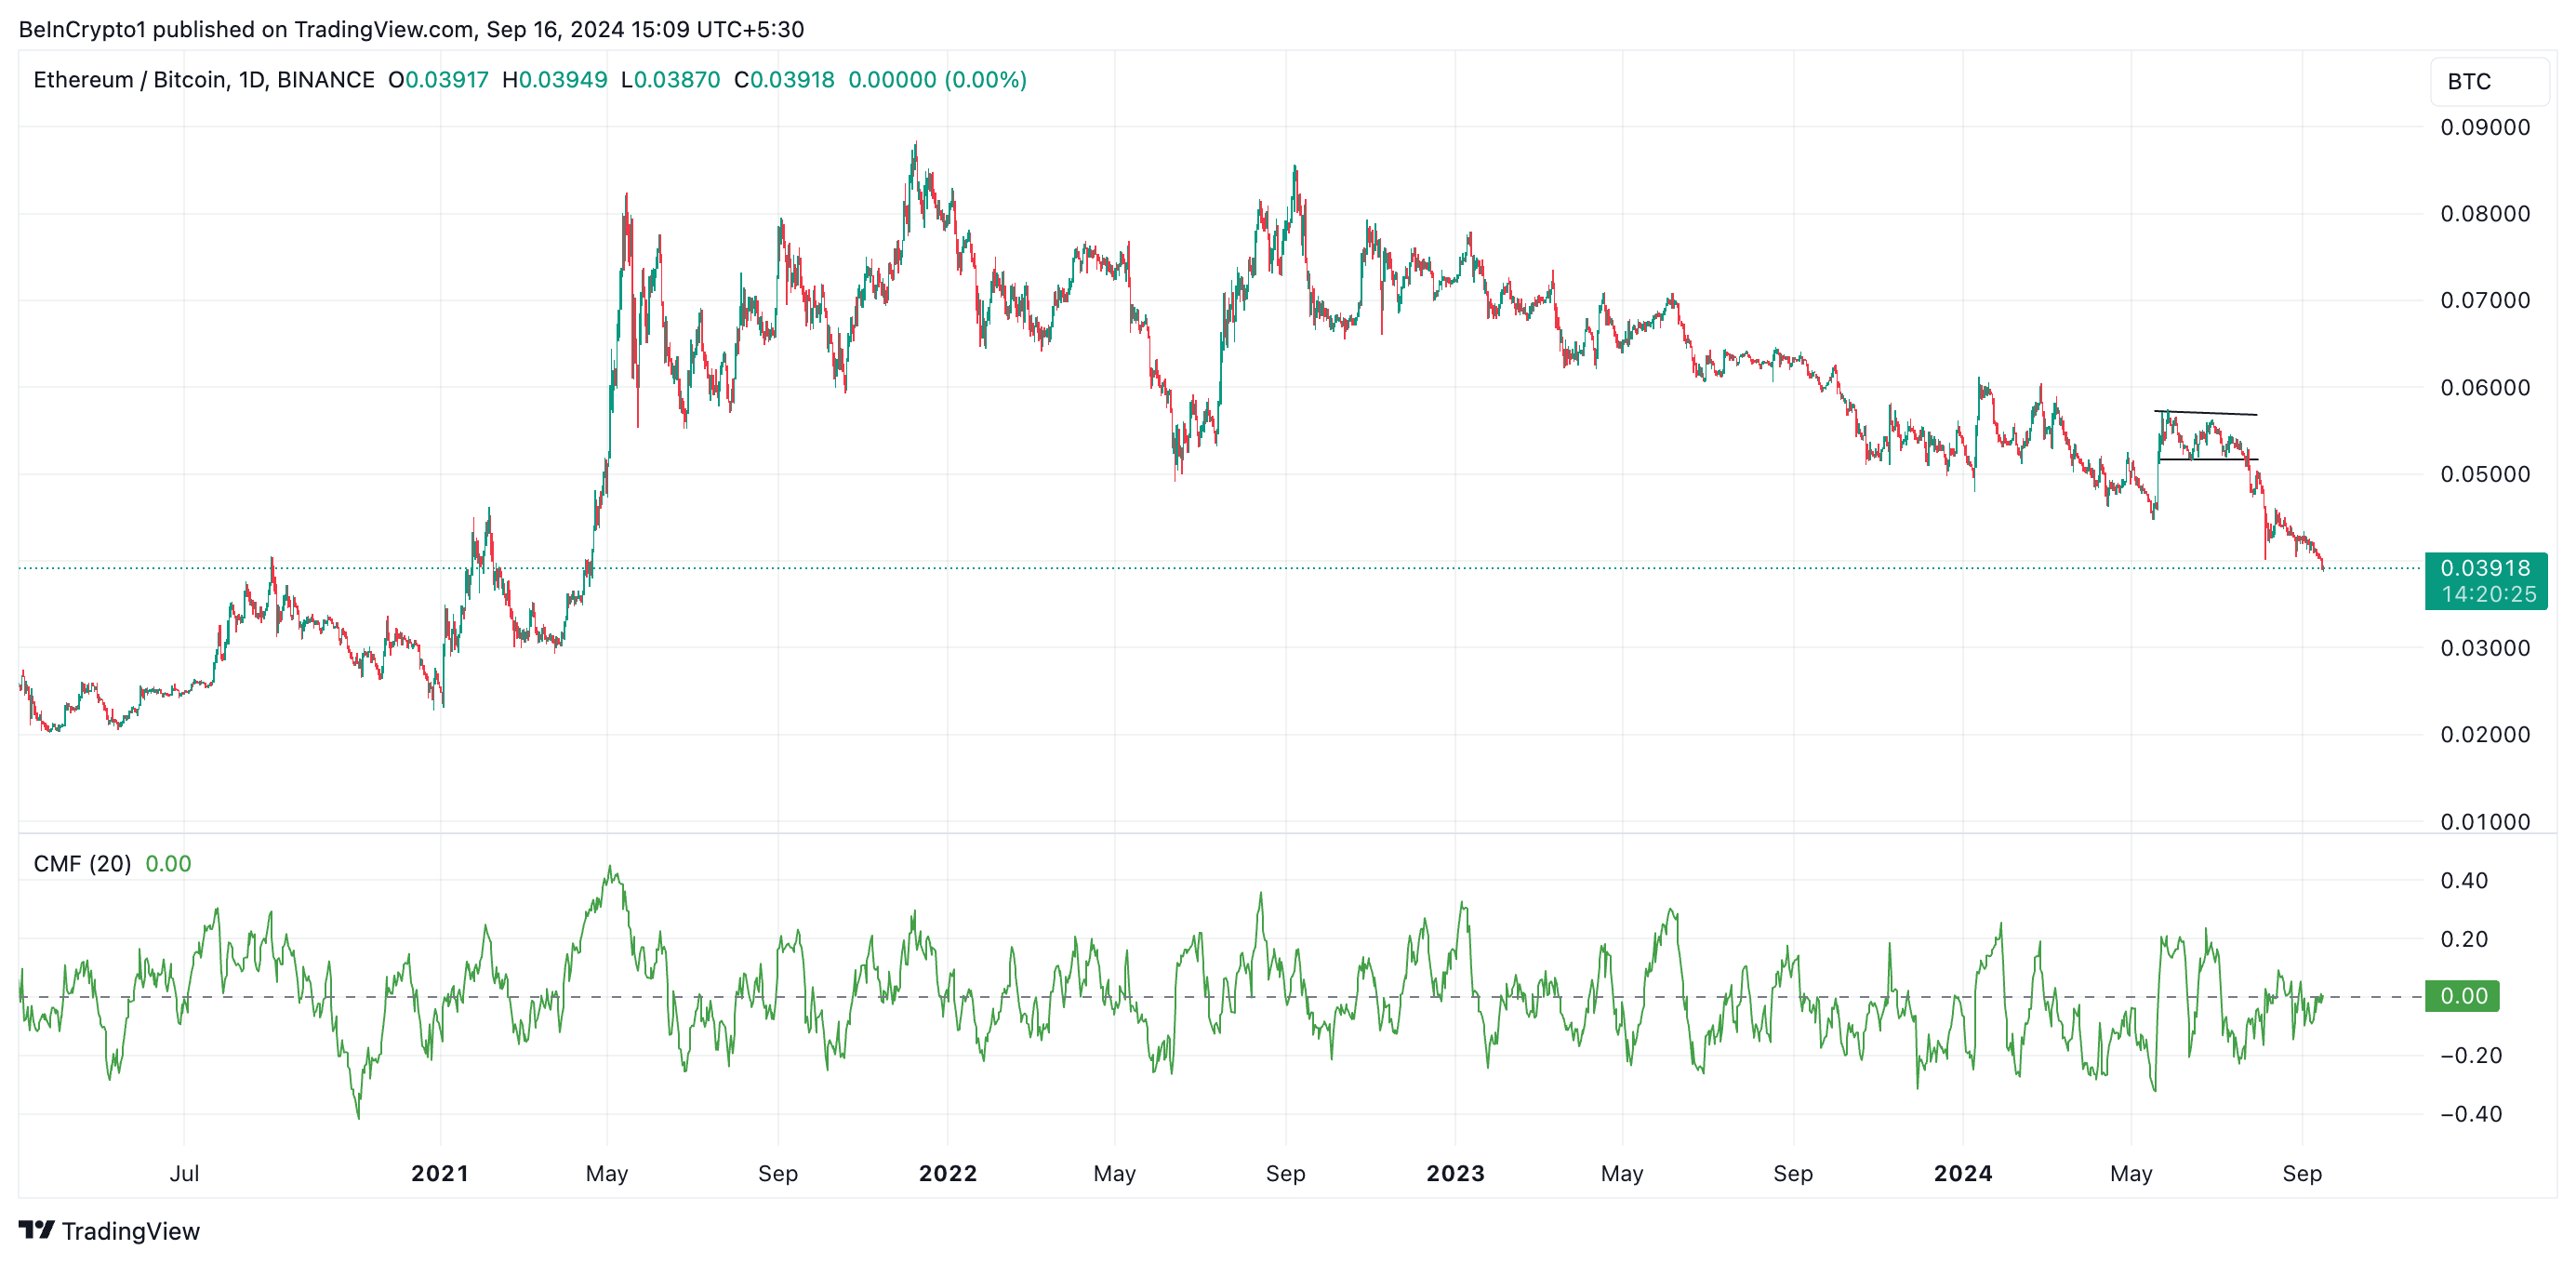
Interestingly, despite Bitcoin (BTC) struggling to break $65,000 in recent months, its market dominance (BTC.D) has steadily increased, currently standing at 57.95%, its highest level since April 2021.
The simultaneous decline in the ETH/BTC pair and the rise in BTC dominance indicate a loss of Ethereum market share and a consolidation of Bitcoin in the market. The decline in Ethereum network activity in recent months is likely to have contributed to this change.
Reduced network usage is reducing the burn rate of ETH, increasing the circulating supply and putting pressure on the price.
Read more: 9 Best Places to Stake Ethereum in 2024
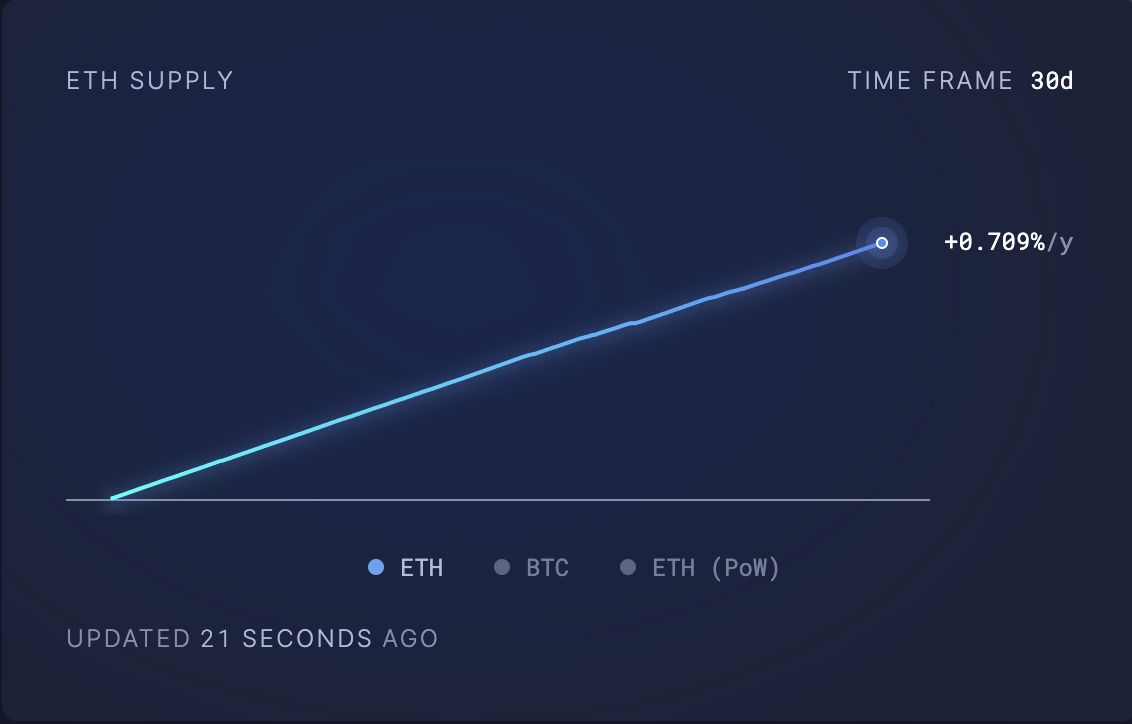
According to data from Ultrasoundmoney, 70,111 ETH have been added to the circulating supply in the last 30 days, worth over $163 million. As the token increases in the market, the increase in supply exceeds demand, putting downward pressure on the price.
ETH Price Prediction: Underlying Demand Is There… Short-Term Price Unknown
The US Federal Reserve is expected to announce a rate cut on September 18, which could lead to market volatility in the coming days. However, the rise in Ethereum’s Chaikin Money Flow (CMF) indicates a cumulative trend, and if demand momentum remains strong, the price could move higher.
Currently, the CMF for ETH is at 0.12, which is forming a bullish divergence despite the recent price drop and showing an upward trend. This indicates underlying demand for ETH, which could lead to positive price movements in the short term.
If this demand continues, the price of Ethereum could bounce back to the resistance level of $2579 . A break above this barrier could open up further gains, taking the price to $2868.
Read more: How to Buy Ethereum (ETH) and Everything You Need to Know
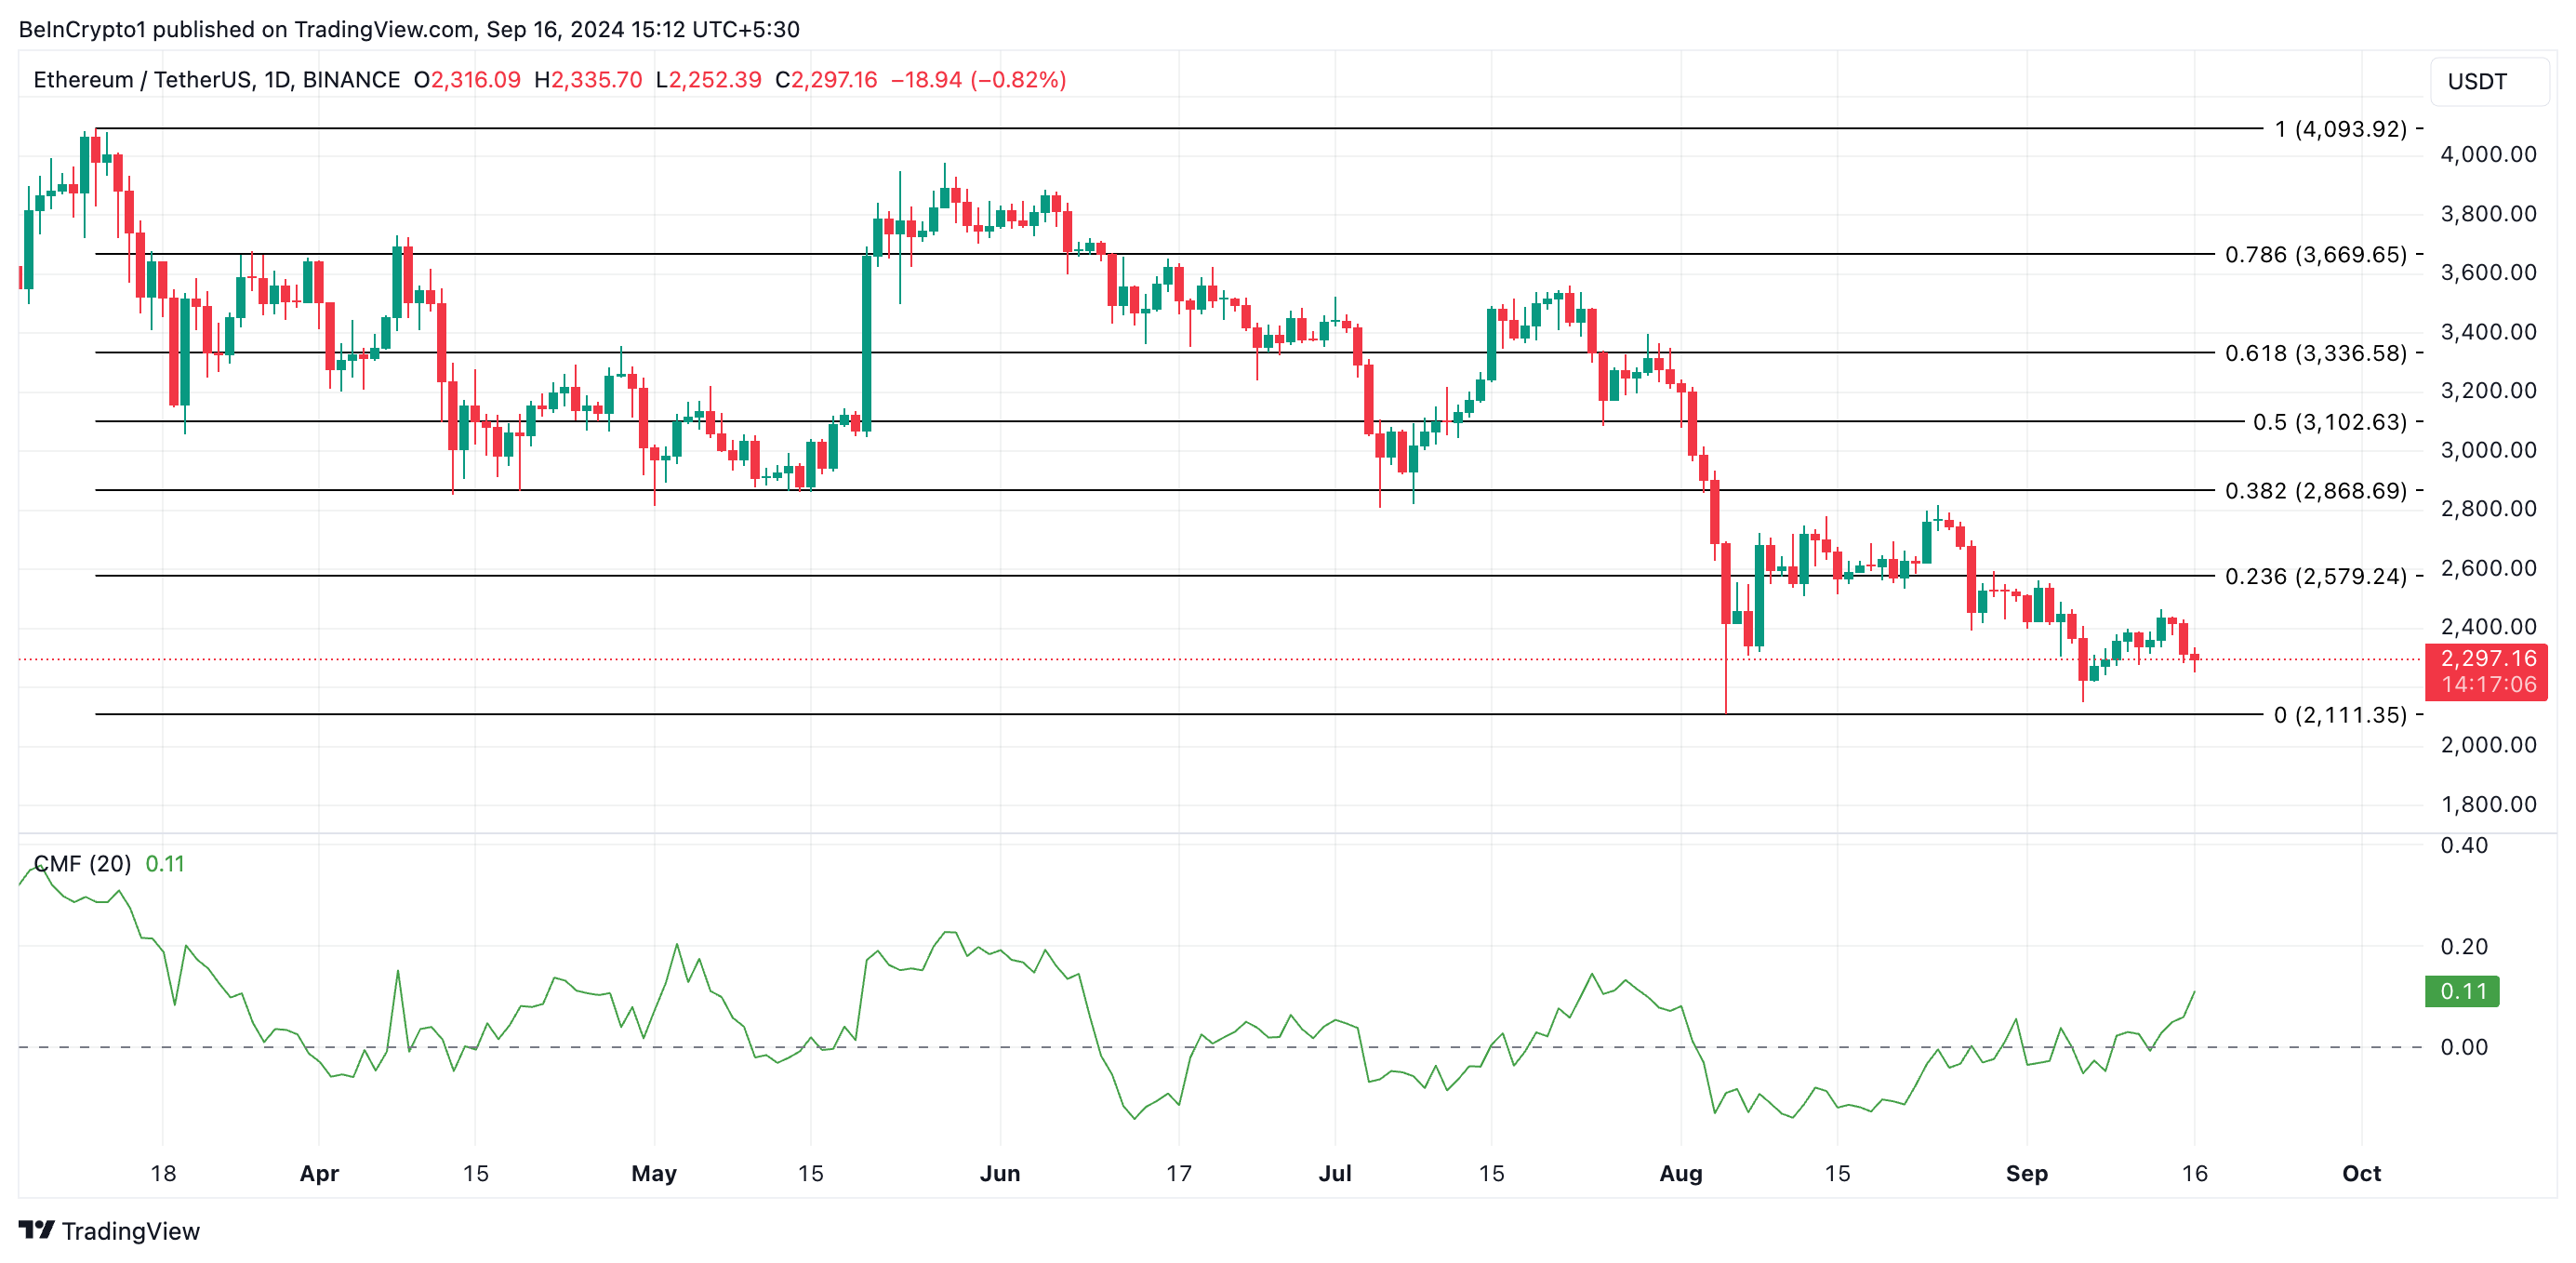
However, if demand weakens in the coming days, this bullish outlook could be invalidated, leading to a drop towards the August 5 low of $2,111.


