Ripple [XRP] has been in a consolidation phase since the beginning of August. A symmetrical triangle pattern can be seen on its daily price chart. Recently, the Altcoin price has been in a bullish phase since it broke below the critical support level of $0.519 in September. As of the time of writing, XRP is testing the key symmetrical triangle resistance level of $0.58.

Whales dominate XRP supply
Ripple has seen a surge in whale activity over the past 24 hours. According to Santiment, whales holding more than $5 million currently hold 55% of the total supply. The high concentration among a few major holders suggests that the XRP market could see wild volatility in the near future. Historically, whales have played a role in XRP's price movements, and their dominance to some extent suggests that they will play a key role in future market movements.
Rising social dominance
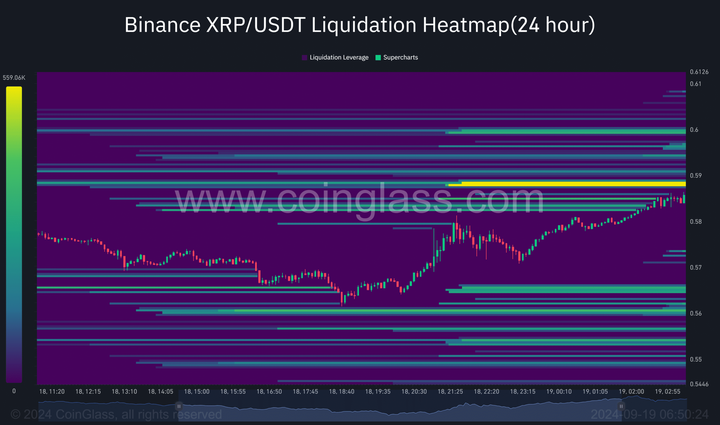
In addition to whale activity, XRP's social dominance has also surged over the past few days. Increased discussions on social platforms often hint at increased interest or anticipation for major events that may occur in the market. As more traders and investors begin to pay attention to XRP, the surge in social activity may also drive market momentum to the next level. Looking further at Coinglass's liquidation heat map data, XRP shows a clear bullish bias. A total of 559k XRP gathered at the $0.5881 price level, indicating strong buyer interest.
This positive sentiment indicates that investors are gaining confidence in a potential bullish rally for XRP and are holding long positions in search of further gains. As XRP’s market metrics continue to improve, the combination of whale control, social dominance, and bullish liquidations could drive further price action in the near future.
XRP price expected to breakout to the upside
XRP price formed a bottom above $0.5620 and started a fresh increase like bitcoin and Ethereum. The price was able to break the $0.5720 and $0.5850 resistance levels. There was a break above a major bearish trend line with resistance at $0.5720 on the hourly chart of the XRP/USD pair. The bulls even pushed the price above the 61.8% Fibonacci retracement level of the down move from the $0.5932 high to $0.5622 low. The price is currently trading above the $0.580 level and the 100 hourly simple moving average. The price is currently consolidating near the 76.4% Fibonacci retracement level of the down move from the $0.5932 swing high to $0.5622 low. On the upside, the price is likely to face resistance near the $0.5880 level. The first major resistance is near the $0.5920 level. The next key resistance could be at $0.600. If the price clearly breaks above the $0.600 resistance, it could drop towards the $0.6160 resistance.
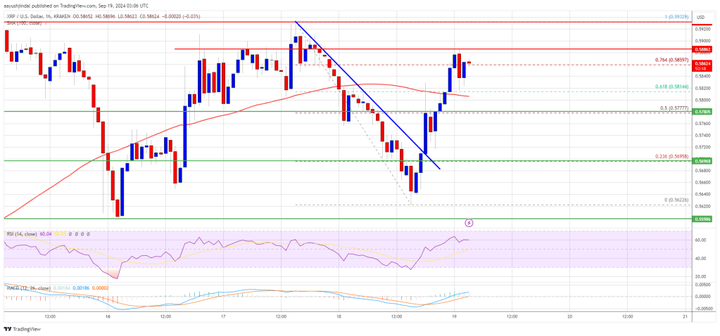
The next major resistance is near the $0.6220 level. If there is further gains, the price might drop towards the $0.6320 resistance level or even $0.6350 in the near term. If XRP fails to break above the $0.5920 resistance zone, it might decline again. An initial support on the downside is near the $0.580 level and the 100 hourly simple moving average. The next major support is near the $0.5690 level. If there is a downside break and close below $0.5690, the price might continue to decline towards the $0.5620 support level in the near term. The next major support is at $0.5550.