Bitcoin’s breakout above $65,000 and solid buying in spot BTC ETFs have traders convinced that the bull market is back in full force.
Bitcoin BTC fell to $65,879.29. The breakout above $66,000 on September 27 indicated the start of a march toward $70,000. The breakout above $65,000 on September 26 boosted buying of U.S. spot Bitcoin exchange-traded funds, with inflows reaching $365.7 million, according to Farside Investors.
The rally is not limited to Bitcoin, with select Altcoin also rising sharply from recent lows. This shows that the sentiment in the cryptocurrency industry has turned positive.
“A rebound in Q4 is highly likely and the gains may have already started,” Markus Thielen, head of research at 10x Research, said in a Sept. 27 report seen by Cointelegraph.
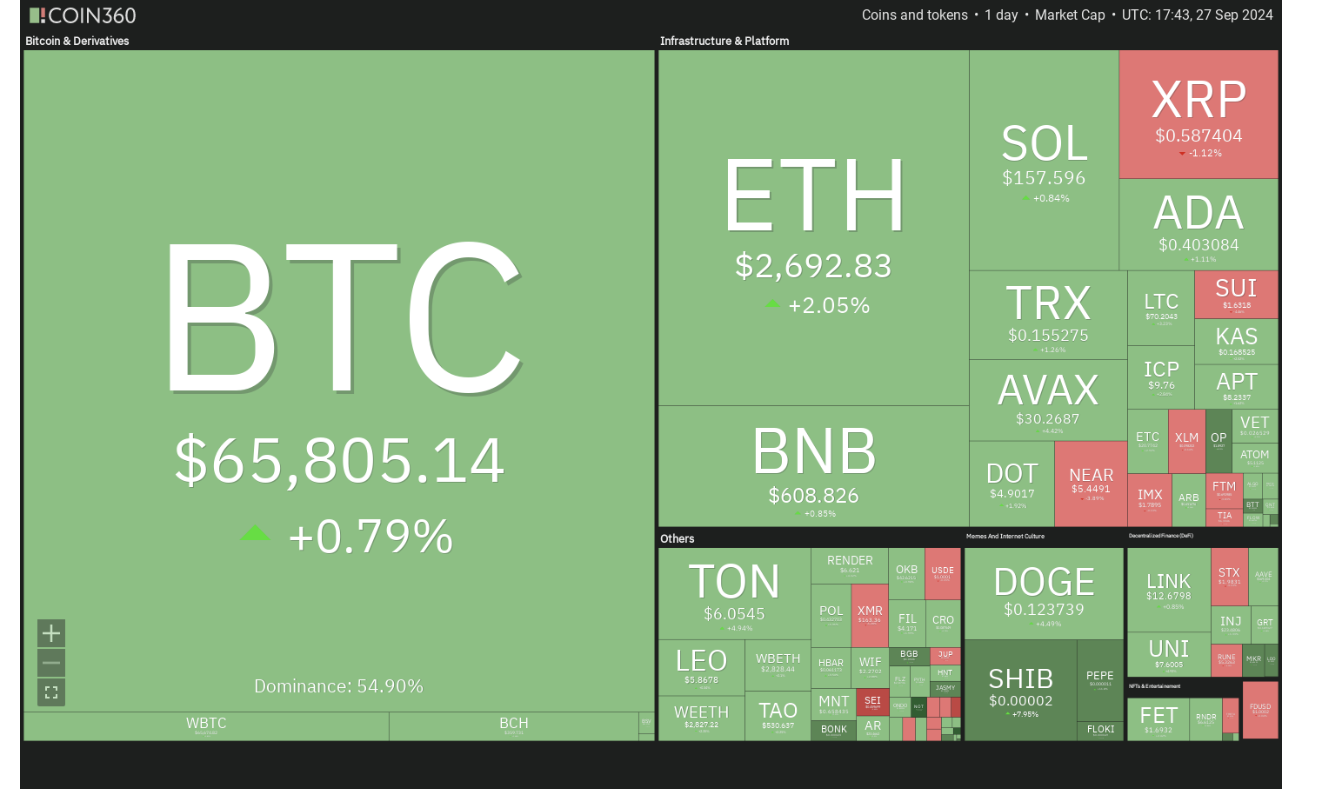
A daily view of cryptocurrency market data. Source: Coin360
Bitcoin is up 12% in September, easily surpassing its previous best performance of 6.04% in 2016. This is a bullish sign because whenever Bitcoin rises in September, it performs exceptionally well in the fourth quarter, as it did in 2015, 2016, and 2023.
Can Bitcoin maintain its gains in September, further fueling Altcoin buying? Let’s analyze the charts of the top 10 cryptocurrencies to find out.
Bitcoin Price Analysis
Bitcoin formed an outside daily candlestick pattern on September 26 and broke above the $65,000 resistance level, indicating that the bulls have overwhelmed the bears.
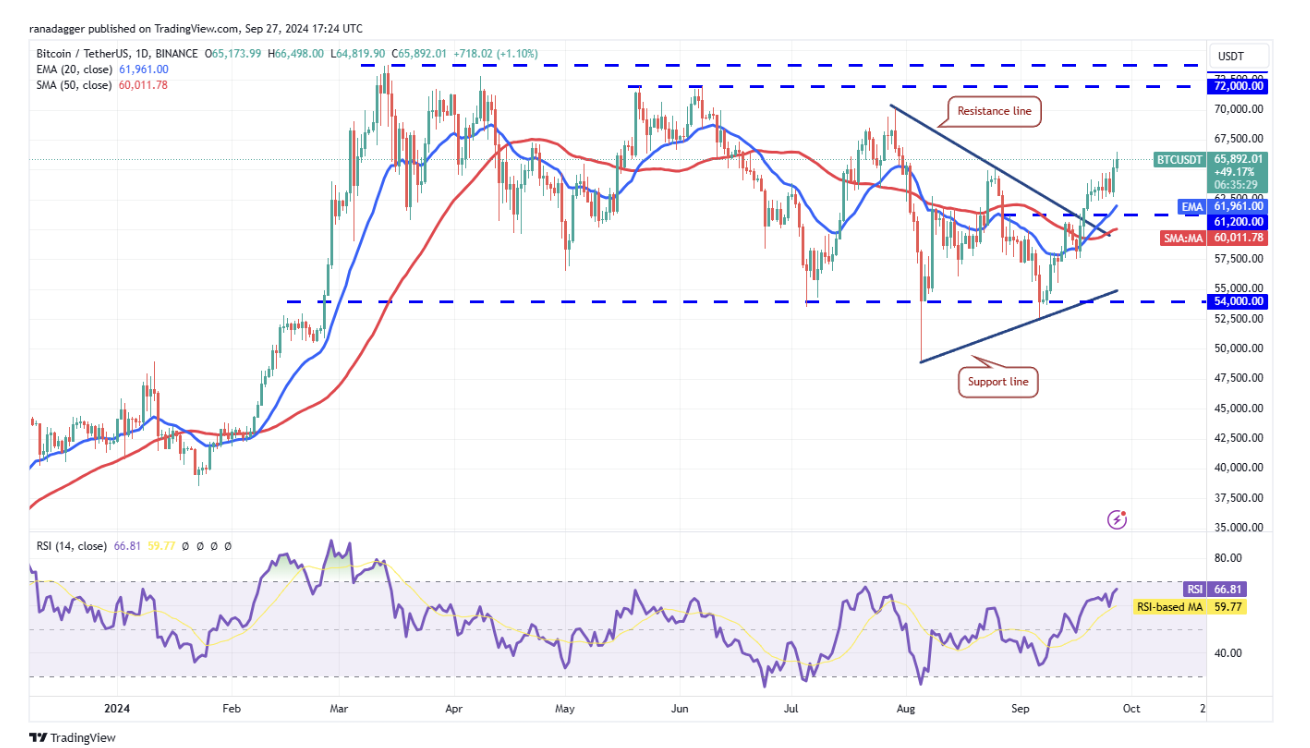
BTC/USDT daily chart. Source: TradingView
If the price sustains above $65,000, it will indicate that the bulls have turned this level into a support. This could push the price to the $70,000–$73,777 zone where the bulls are likely to face heavy selling pressure.
A breakout and close below $65,000 will indicate a fading bullish momentum. The advantage will tilt in favor of the bears if the bears sink the pair below $61,200. Such a move will indicate that the breakout above $65,000 could be a bull trap.
Ethereum Price Analysis
Ethereum (ETH) price at $2,691.97 turned down from the resistance line on September 23 but found support at the moving averages, suggesting buying on dips.
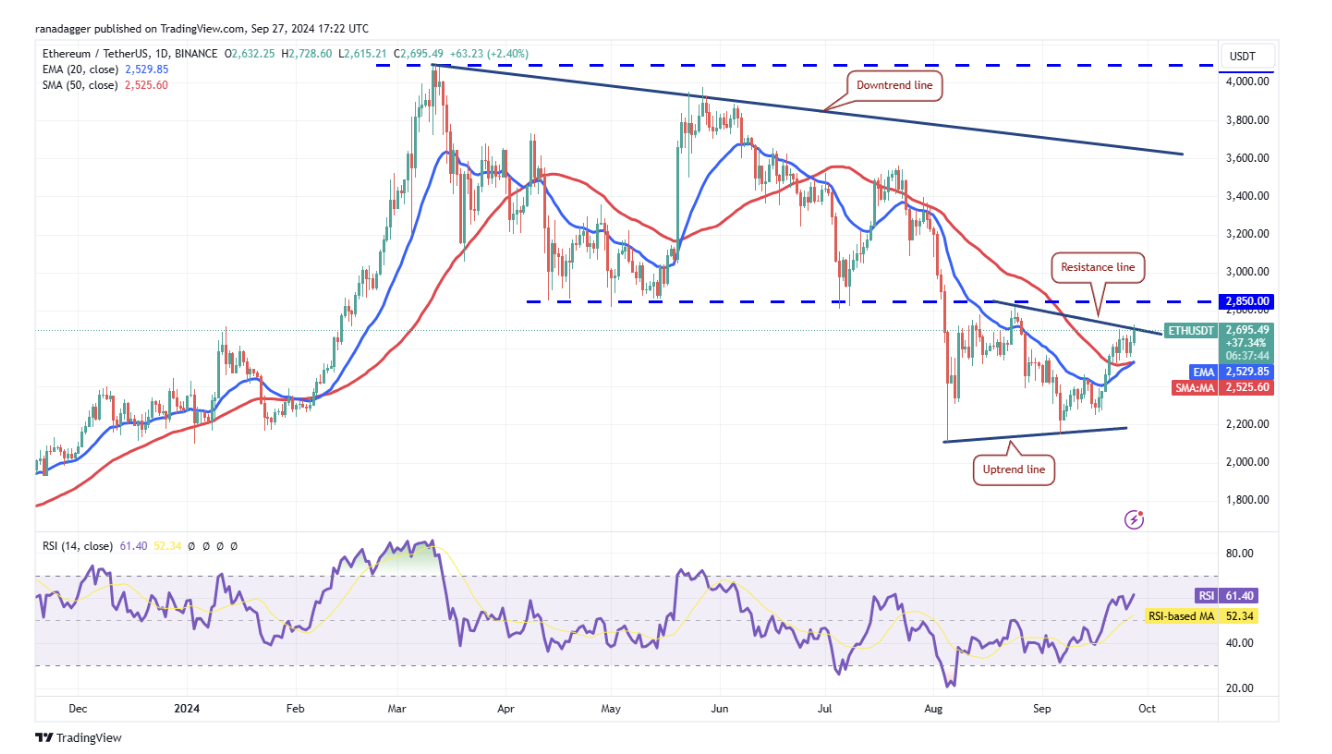
ETH/USDT daily chart. Source: TradingView
The 20-day exponential moving average ($2,529) is sloping up and the relative strength index (RSI) is in the positive territory, which suggests that buyers have the upper hand. If the bulls push and sustain the price above the resistance line, the ETH/USDT pair will complete a breakout from the symmetrical triangle. The pattern target of this setup is $3,409.
The sellers may have other plans. They will try to defend the area between the resistance line and $2,850. If the price turns down sharply from the upper area and breaks below the moving averages, it will indicate that the price will remain range bound between $2,111 and $2,850 for a while.
BNB Price Analysis
BNB price is $609.79. It fell from $616 on September 23, but the bears could not sink the price below the 20-day EMA ($570).
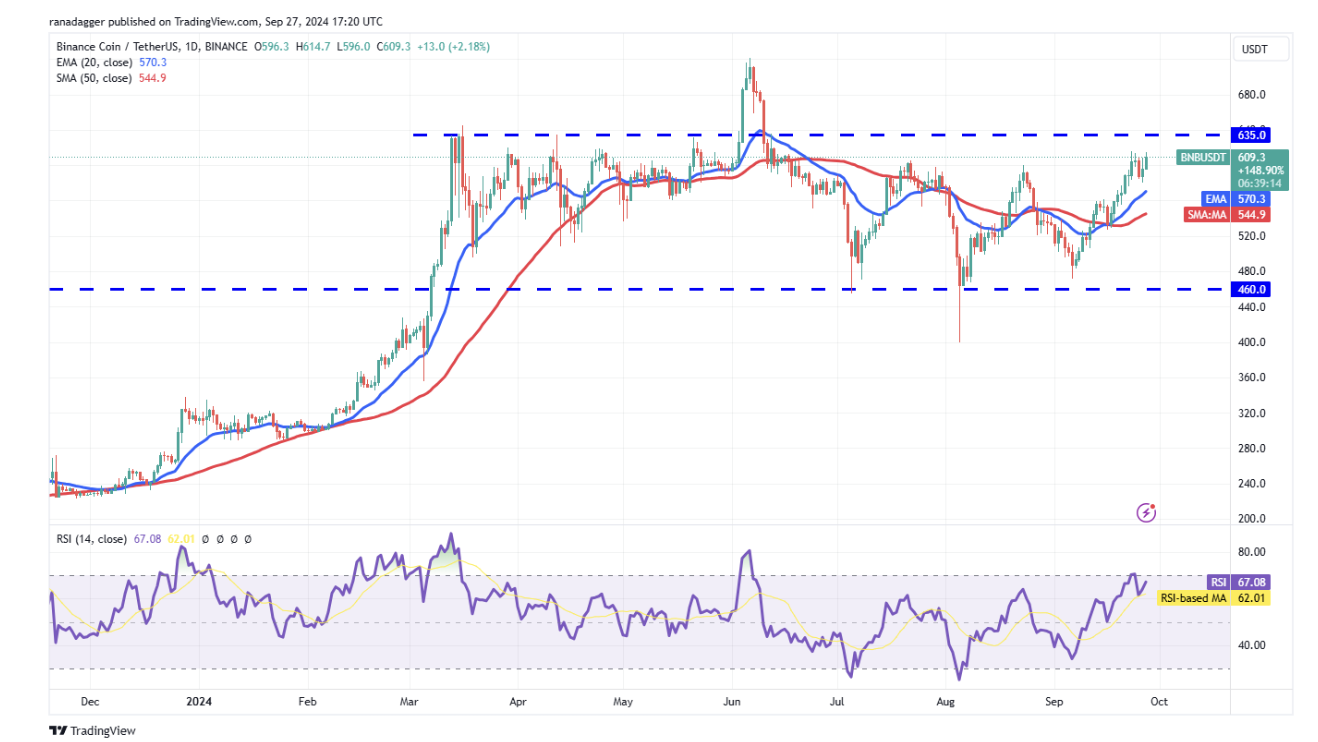
BNB/USDT daily chart. Source: TradingView
This shows that the bulls are buying on minor dips. The bulls will once again try to push the price above $635, which might be a tough hurdle to cross. If the price turns down sharply from $635 and breaks below the moving averages, it will suggest that the BNB/USDT pair might continue to stay inside the range.
Conversely, if the buyers do not give up much room from $635, it will improve the prospects of a breakout. The pair could then rally to $722.
Solana Price Analysis
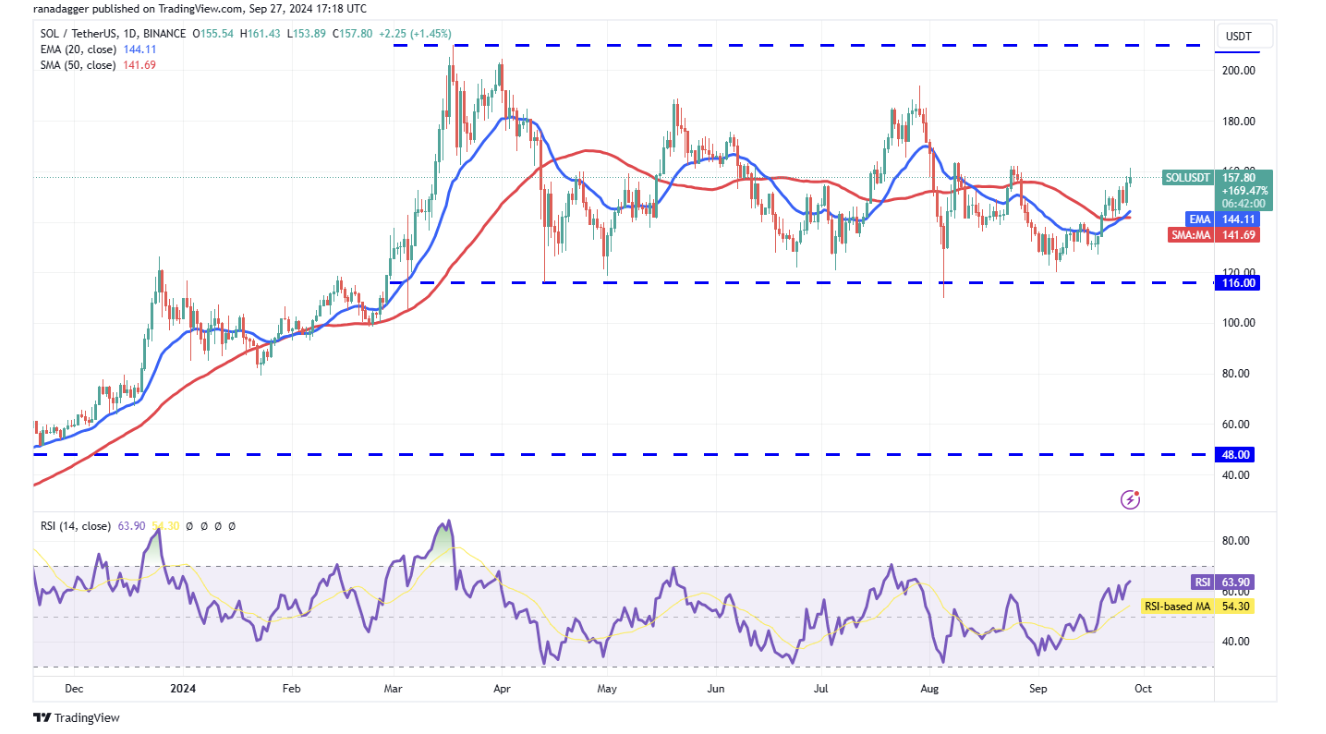
Solana (SOL) priced at $158.43 has gradually moved higher towards the overhead resistance at $164, which suggests strong demand from the bulls.
SOL/USDT daily chart. Source: TradingView
Sellers will try the same again as they failed to recover at $164 in two previous attempts. If the price turns down sharply from the overhead resistance and breaks below the 20-day EMA ($144), it will suggest that the SOL/USDT pair might remain in the lower half of the $116–$210 range.
Alternatively, a breakout and close above $164 will indicate that the pair could rise to $190 and then fall to the range resistance at $210.
XRP Price Analysis
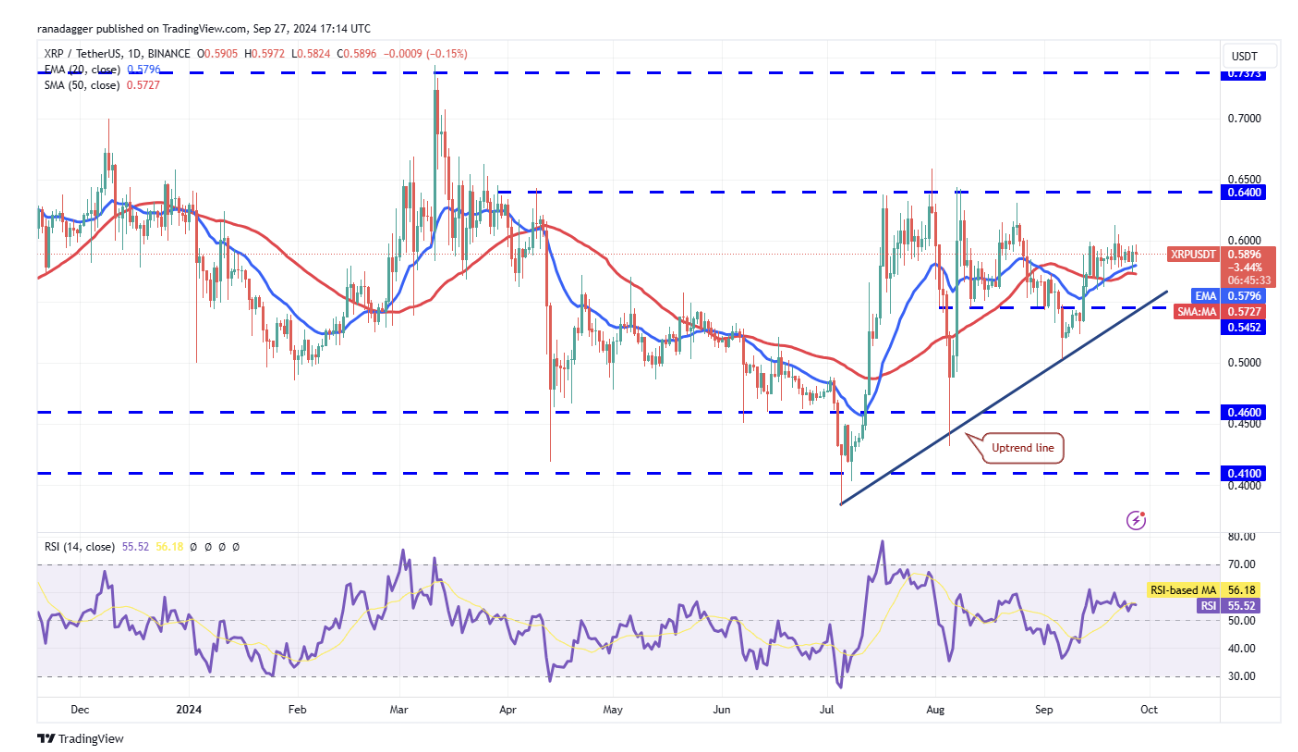
The bulls failed to carry the XRP (XRP) price above the $0.5889 to $0.60 resistance level, but a positive sign is that they did not allow the price to sink below the moving averages.
XRP/USDT daily chart. Source: TradingView
This increases the possibility of an upside breakout. If this happens, the XRP/USDT pair could move up to $0.64. Buyers might hit a solid barrier at $0.64, but if they push all the way up, the pair could surge to $0.74.
Conversely, if the price turns down and breaks below the moving averages, it will suggest that the bulls have given up. The pair can then slide towards the uptrend line and below it to $0.50.
Dogecoin Price Analysis
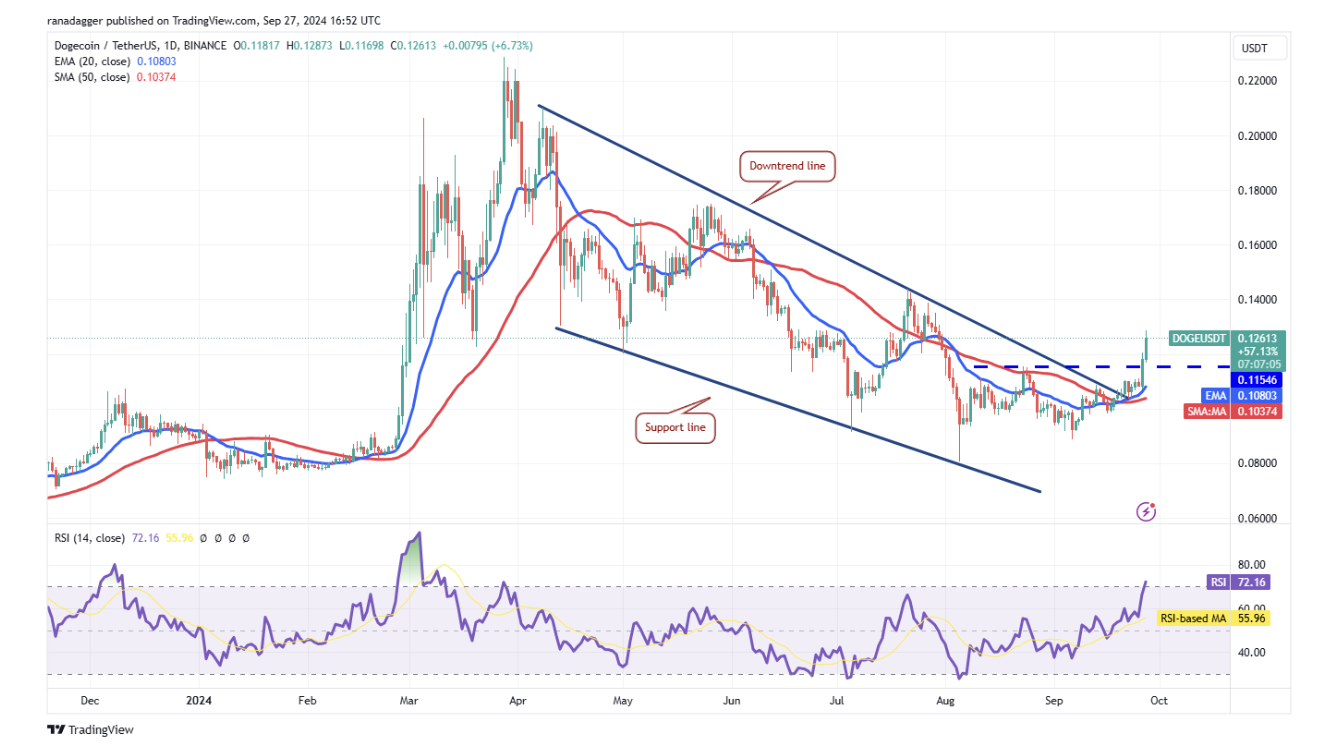
Dogecoin (DOGE) price $0.1248. It rose sharply from the 20-day EMA ($0.11) on September 26 and broke through the nearest resistance.
DOGE/USDT daily chart. Source: TradingView
This clears the way for a possible rally to $0.14. The bears will try to stall the gains to $0.14, but if the bulls break above the resistance, the rally is likely to continue northwards to $0.18.
The moving averages are the key supports to watch out for on the downside. A breakout and close below the moving averages will indicate that the bears are back in the game. The DOGE/USDT pair can then drop to $0.09.
Toncoin Price Analysis
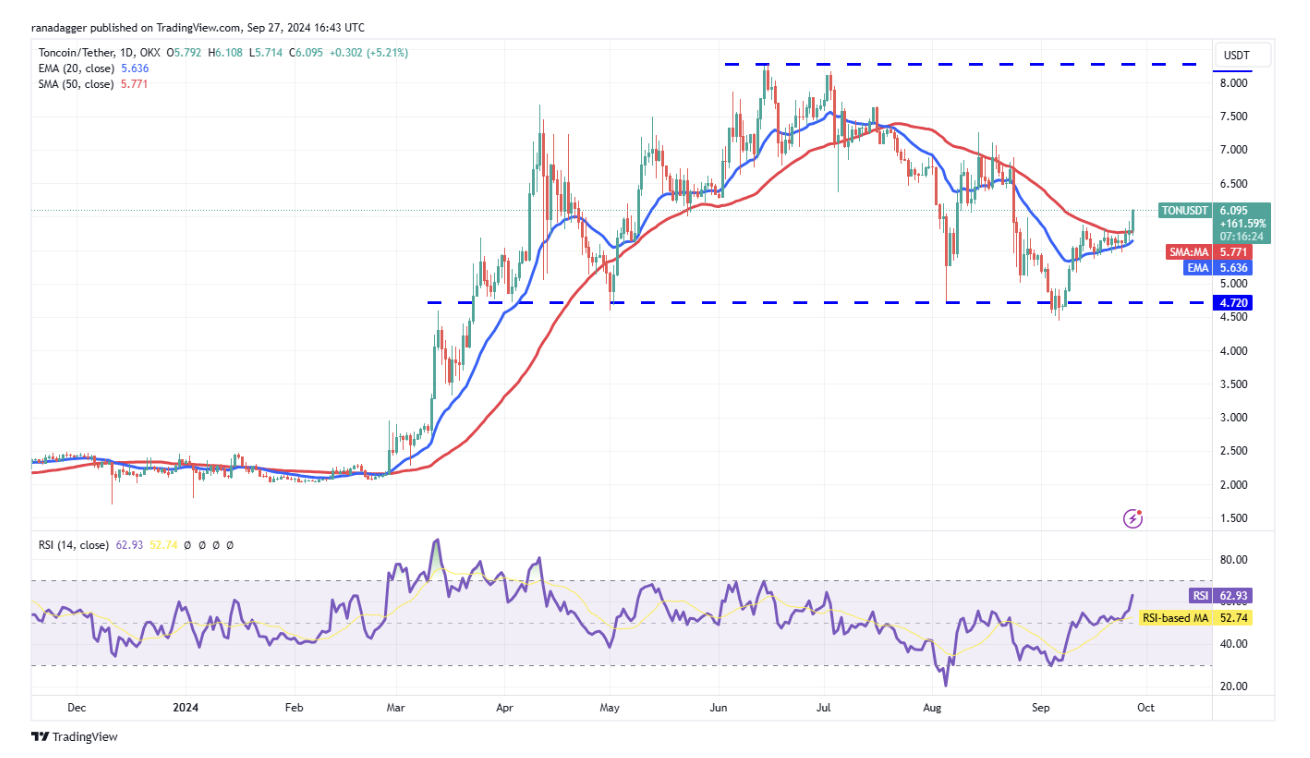
Toncoin’s (TON) price is $5.98. The tight consolidation between the moving averages ended on September 27, with the range expanding to the upside.
TON/USDT daily chart. Source: TradingView
If the buyers sustain the price above $6, the TON/USDT pair is likely to accelerate gains towards $7. The bears are expected to mount a strong defense at $7, but if the bulls do not give in to the bears, the uptrend is likely to extend to $8.29.
This positive view will be negated in the short term if the price falls sharply and breaks below the 20-day EMA ($5.63). The pair can then drop to the critical support at $4.44.
Cardano Price Analysis
Cardano (ADA) price is $0.3997. It broke above the $0.40 overhead resistance on September 27. If the price closes above $0.40, it will complete a Double Botto pattern.
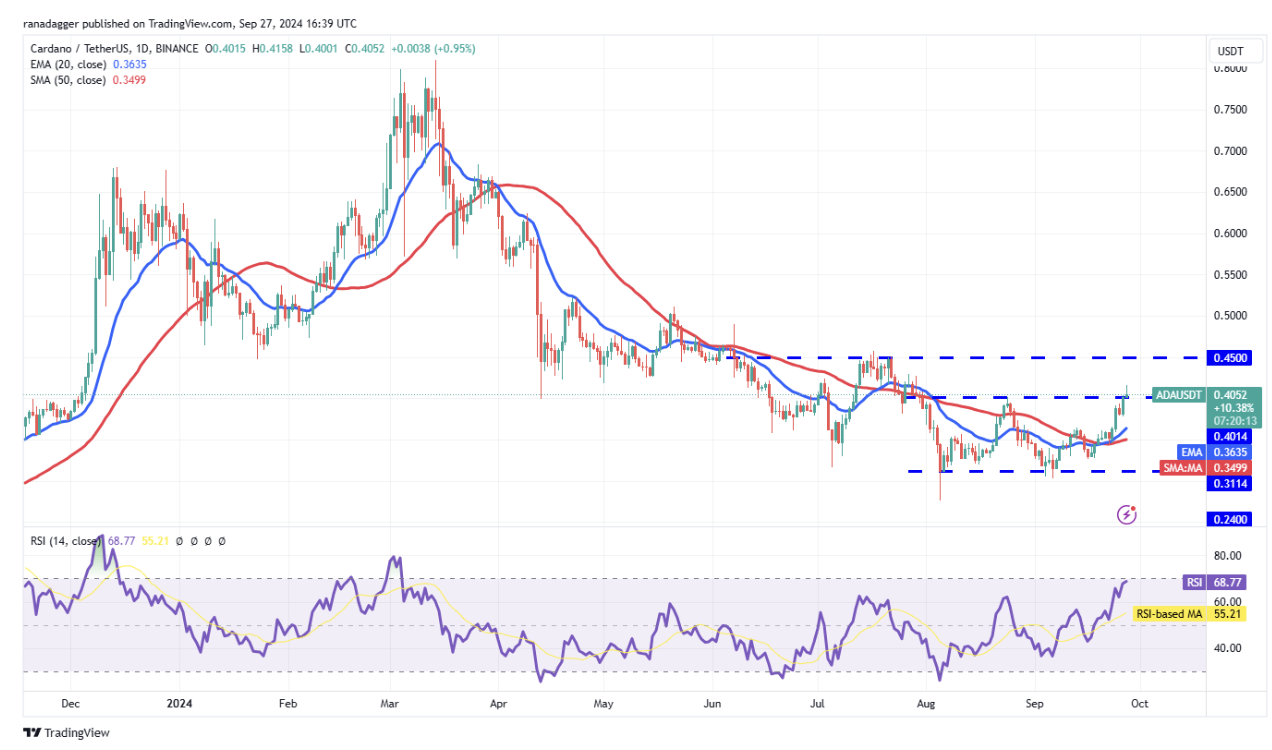
ADA/USDT daily chart. Source: TradingView
The reversal pattern has a target objective of $0.49, but the bulls are likely to face stiff resistance at $0.45. If the price turns down from $0.45 but rebounds from $0.40, it will indicate a shift in sentiment from selling on rallies to buying on dips. This will improve the prospects of a rally to $0.49.
Conversely, if the price fails to sustain above $0.40, it will suggest that the market has rejected the breakout. A break below the 20-day EMA ($0.36) will suggest that the ADA/USDT pair might remain range-bound between $0.31 and $0.40 for a while.
Avalanche Price Analysis
Avalanche (AVAX) price is $29.88. It was consolidating tightly around the $29 decline level and moved upward on September 26.
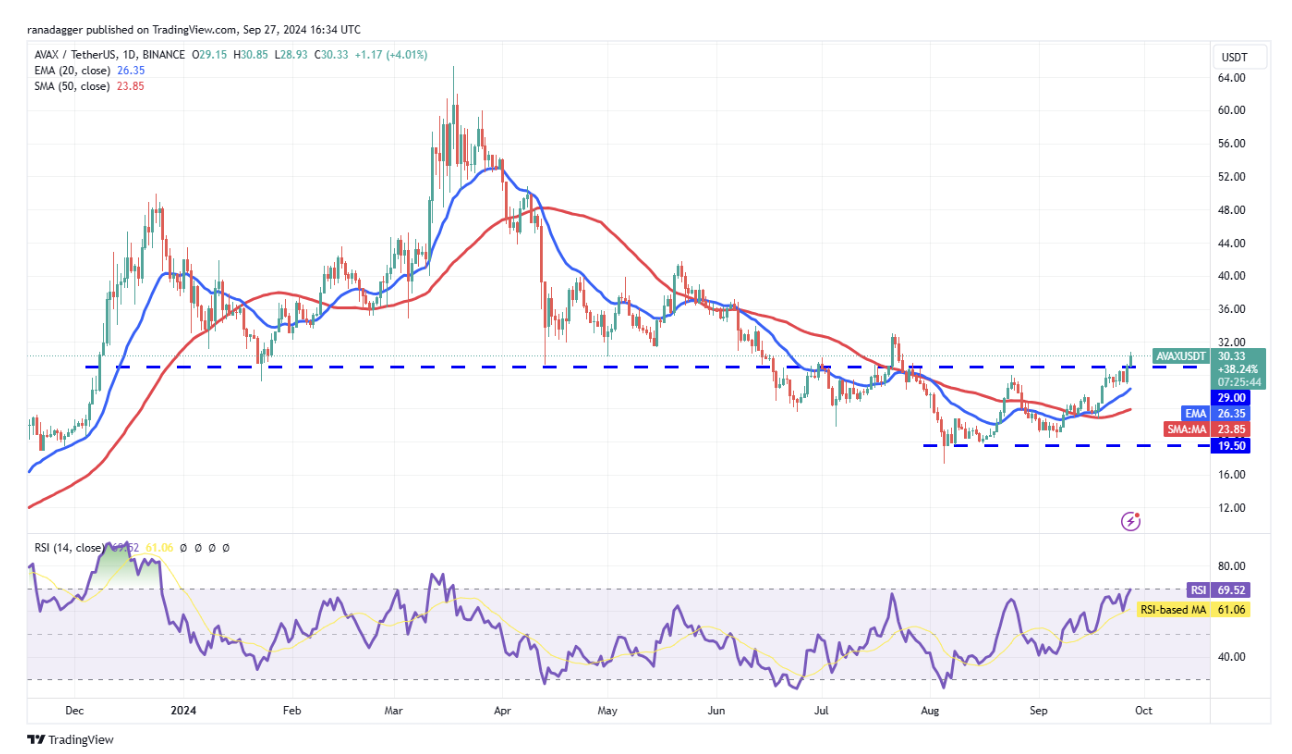
AVAX/USDT daily chart. Source: TradingView
If the buyers sustain the price above $29, the AVAX/USDT pair could move up to $33, which might act as a minor resistance. However, if the bulls do not allow the price to sink back below $29, the possibility of a rally to $42 increases.
If the bears want to stall the upside, they will have to quickly pull the price back below $29. If they do so, the aggressive bulls might get stuck. The selling is likely to increase if the 20-day EMA ($26.35) level cracks.
Shiba Inu Price Analysis
Shiba Inu (SHIB), priced at $0.00002057, gained momentum after breaking above the immediate resistance at $0.000016 on September 26.
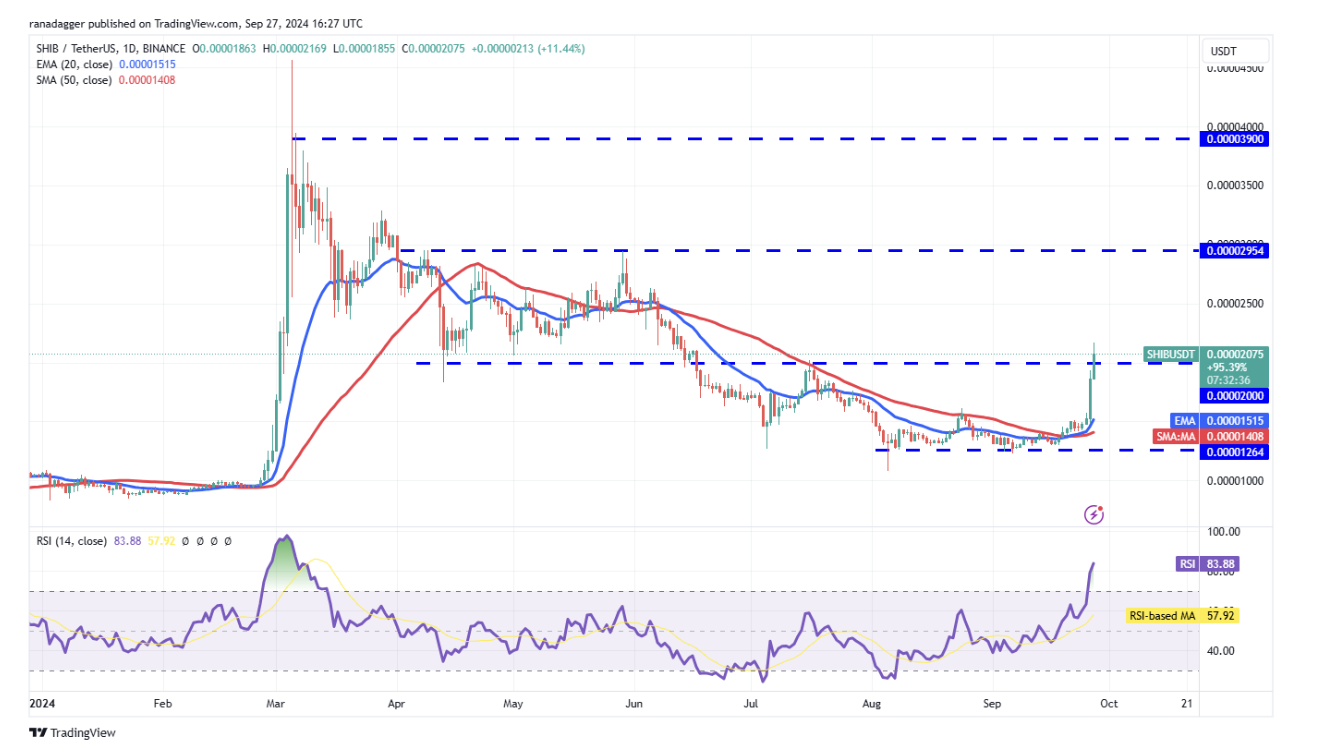
SHIB/USDT daily chart. Source: TradingView
The SHIB/USDT pair continued to move higher and surpassed the $0.000020 breakout level on September 27. If the bulls can settle above $0.000020, the pair is likely to extend its gains towards $0.000029.
Contrary to this assumption, if the price turns down sharply from the current levels, it will indicate selling on rallies. A break below $0.000018 will indicate a range-bound movement between $0.000012 and $0.000022 for a few days.


