

Bitcoin (BTC) is seeing volatility and succumbed to selling pressure on September 30, falling below $64,000. Even after losing its gains, Bitcoin recorded its best monthly gain in September at 7.35%, surpassing the 6.04% gain in 2016, according to CoinGlass data.
Traders are likely to be bullish on Bitcoin heading into Q4 as October was one of its strongest months , with an Medium gain of 22.90% and a Medium gain of 27.70%. If history repeats itself, a new ATH is likely to be reached in the coming months.
ZX Squared Capital chief investment officer CK Zheng said that the US presidential election is another bullish driver for Bitcoin as neither the Republicans nor the Democrats “adequately addressed the growing US debt and deficit in this election.”
Interestingly, Bitcoin increased by 168% in the fourth quarter of 2020, which saw the halving event and the US presidential election.
Can Bitcoin and altcoins surge in October? Let's analyze the charts to find out.
The S&P 500 has held above the breakout level of 5,670, but the move has lacked momentum, suggesting hesitation to continue buying at higher levels.
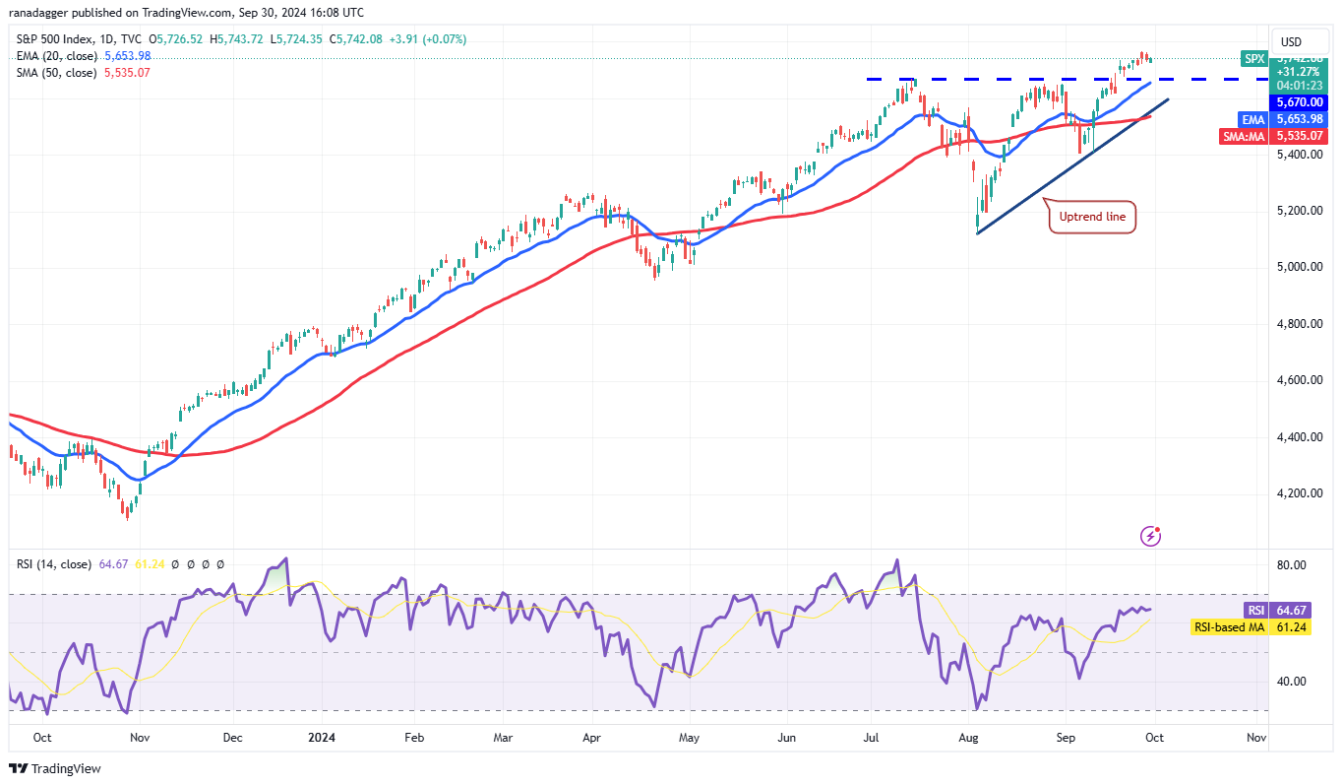
SPX Daily Chart | Source: TradingView
The price could correct down to 5,670, which is likely to Vai as strong support. If the price rebounds from 5,670 with strength, it would signal that the bulls have flipped this level into support. That would improve the upside prospects for a move to 6,000.
Instead, if the price turns down and breaks below the 20-day exponential moving Medium (5,653), it will indicate that short-term traders are taking profits. If this support level is also broken, the index could plunge to the uptrend line. This is an important level to watch because a break below this level could accelerate the selling process.
Short sellers have repeatedly thwarted recovery attempts at the 20-day exponential moving Medium (100.99), suggesting that the US Dollar Index (DXY) remains in a downtrend.
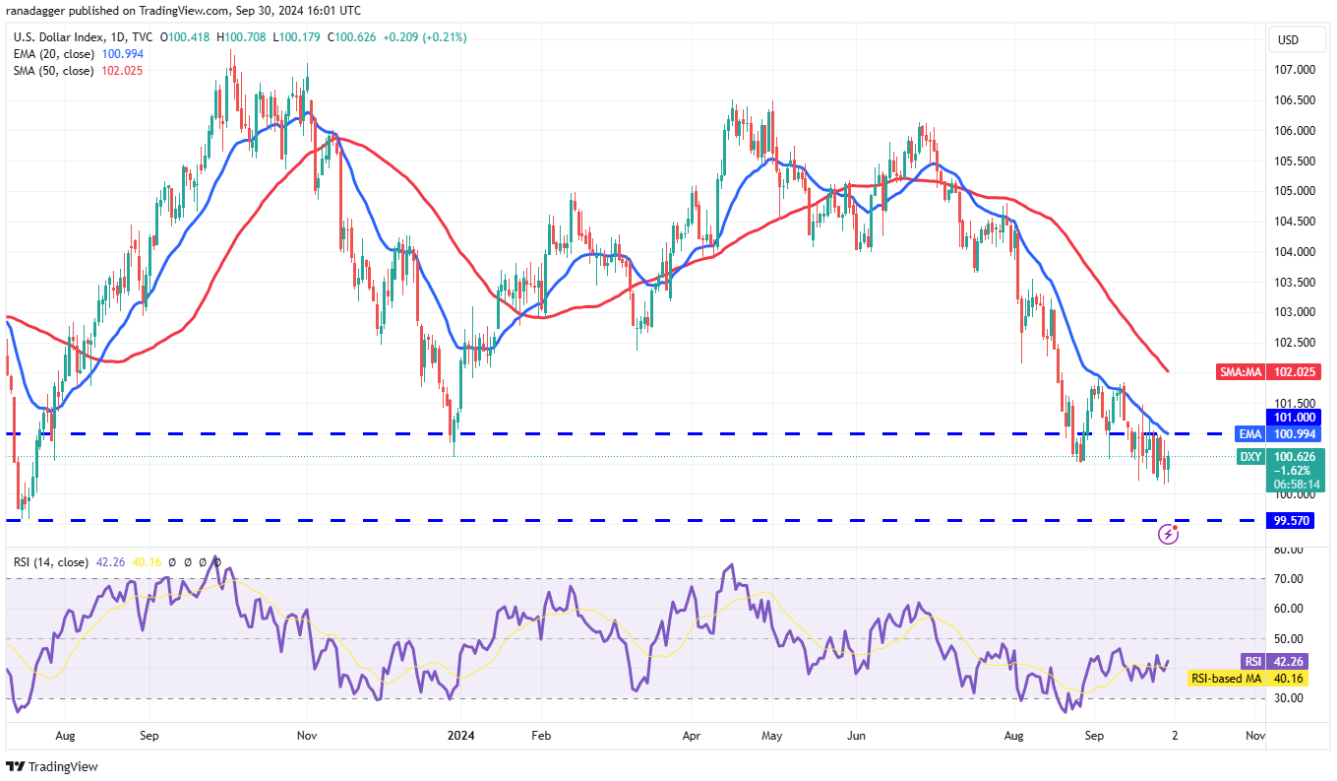
DXY Daily Chart | Source: TradingView
Sellers will try to strengthen their position by pulling the price down to the important support level of 99.57. This level has previously Vai as strong support, so buyers will try to defend it aggressively. If the price recovers from 99.57 but fails to break above the 20-day EMA , it will signal that bears are selling on the rise. This will increase the risk of a break below 99.57.
If buyers want to halt the decline, they will have to push and sustain the price above the 20-day EMA. The uptrend could continue its upward momentum above 102.
Bitcoin closed above $65,000 on September 26, but the failure to push the price higher attracted short-term traders to take profits. That pulled the price back below the breakout level on September 30.
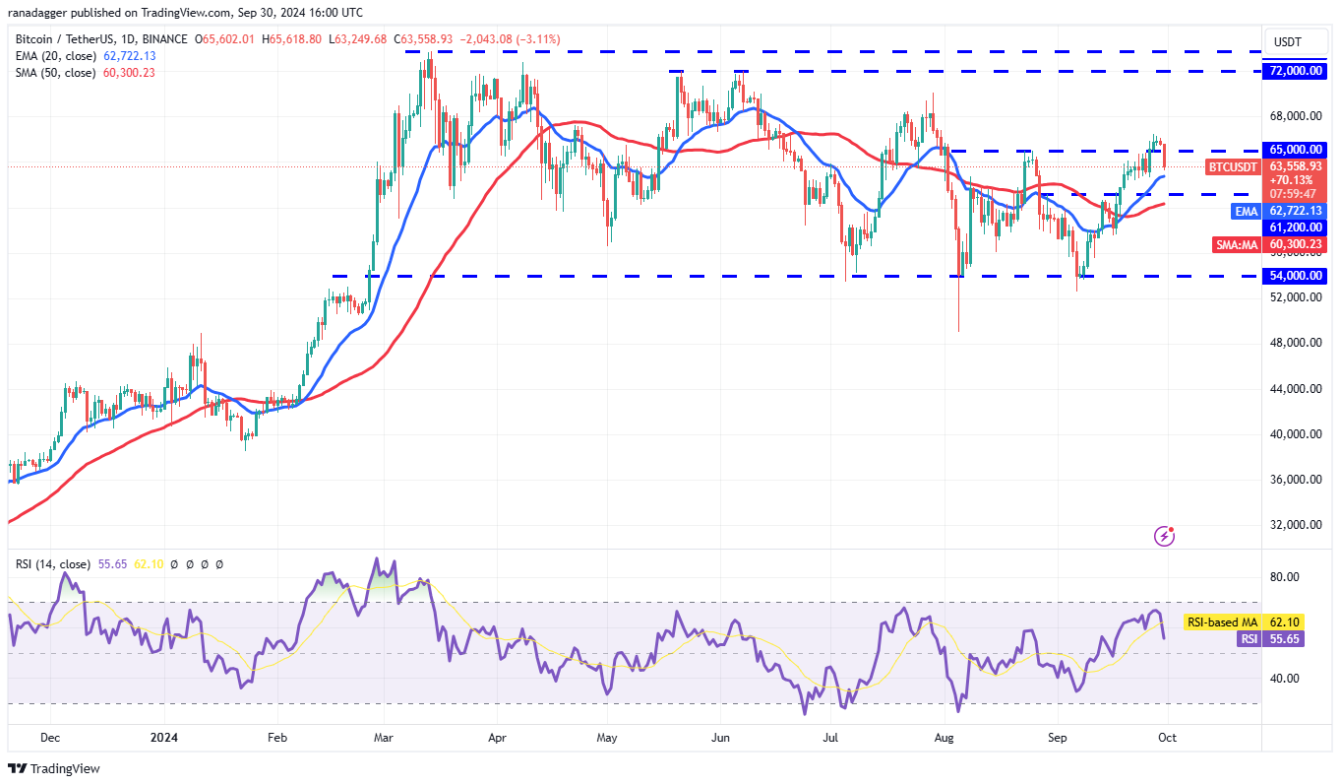
BTC/ USDT daily chart | Source: TradingView
The 20-day EMA ($62,722) is a key level for the bulls to defend. If the price bounces off the 20-day EMA, the bulls will attempt to push the price above $66,500. If they can do so, the BTC/ USDT pair could rise to $70,000.
Conversely, a break below the 20-day EMA would signal weakening bullish momentum. The pair could then drop to the 50-day SMA ($60,300). That could keep the pair in the $54,000 to $65,000 range for some time.
The bulls failed to push and sustain Ether (ETH) above the resistance line on September 27, which suggests that the bears are defending this level.
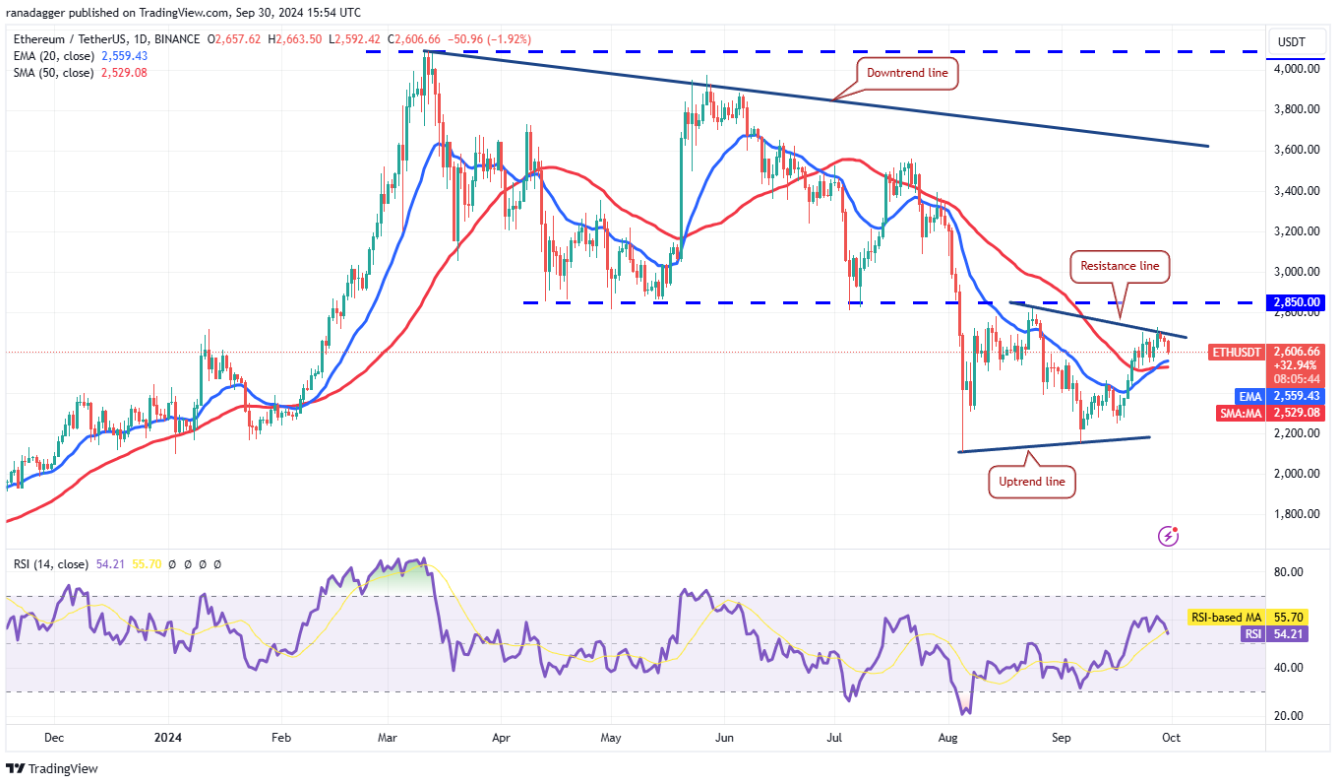
ETH/ USDT daily chart | Source: TradingView
The price is currently stuck between the 20-day EMA ($2,559) and the resistance line. This narrow range trading is unlikely to continue for long. If the price rises, the ETH/ USDT pair could rise to $2,850 and then $3,400.
This bullish view will be negated in the coming period if the price continues to decline and breaks below the moving Medium . That could keep the pair in a symmetrical triangle pattern for a few more days.
BNB (BNB) declined from $618 on September 28, showing that traders are selling near the overhead resistance at $635.
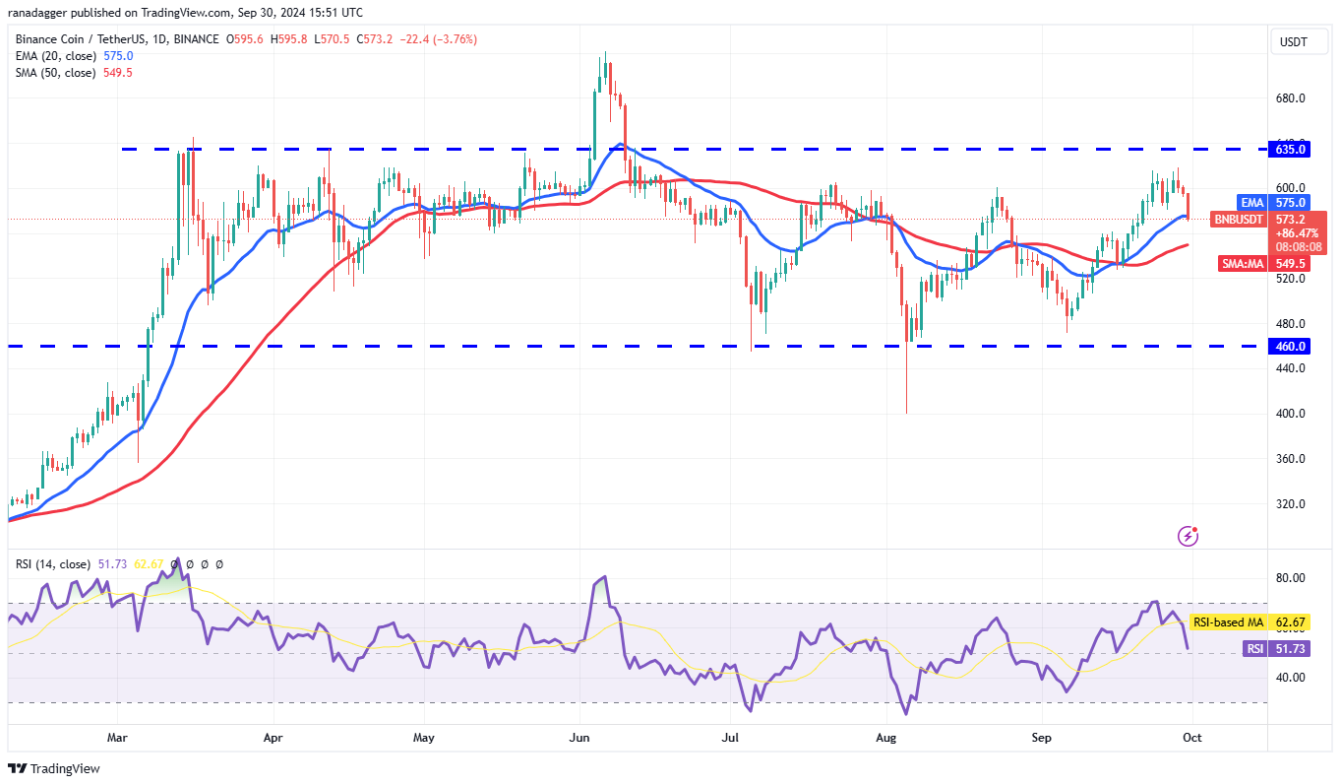
BNB/ USDT daily chart | Source: TradingView
The price has reached the 20-day EMA ($575), an important level to watch. If the price rebounds sharply from the 20-day EMA, the bulls will make another attempt to break above the overhead barrier. If they succeed, the BNB/ USDT pair could surge to $722.
On the other hand, if the price closes below the 20-day EMA, it will signal that the bulls have given up. That could keep the pair stuck in the $460 to $635 range for some time.
The bulls are struggling to push Solana (SOL) above the overhead resistance at $164, which suggests selling on rallies.
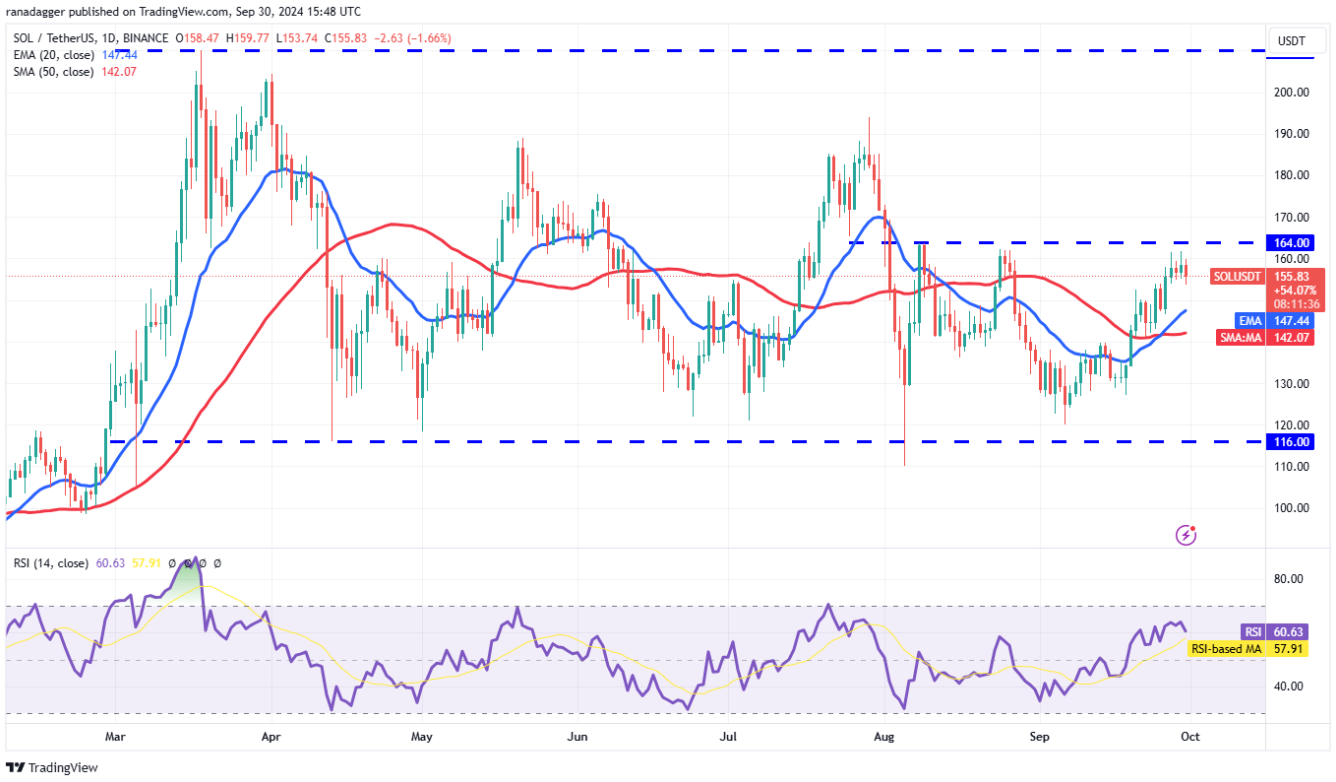
SOL/ USDT daily chart | Source: TradingView
A small positive for the bulls is that they are not giving up much ground to the bears. The rising 20-day EMA ($147) and the RSI in the positive zone suggest that the path of least resistance is to the upside. If the bulls push the price above $164, the SOL/ USDT pair could rise to $188.
Conversely, if the price declines and breaks below the 20-day EMA, it would suggest that the pair could continue to range between $116 and $164 for some time.
XRP (XRP) rose above the $0.64 resistance on September 29, but the long wick on the candlestick suggests that bears are selling on rallies.
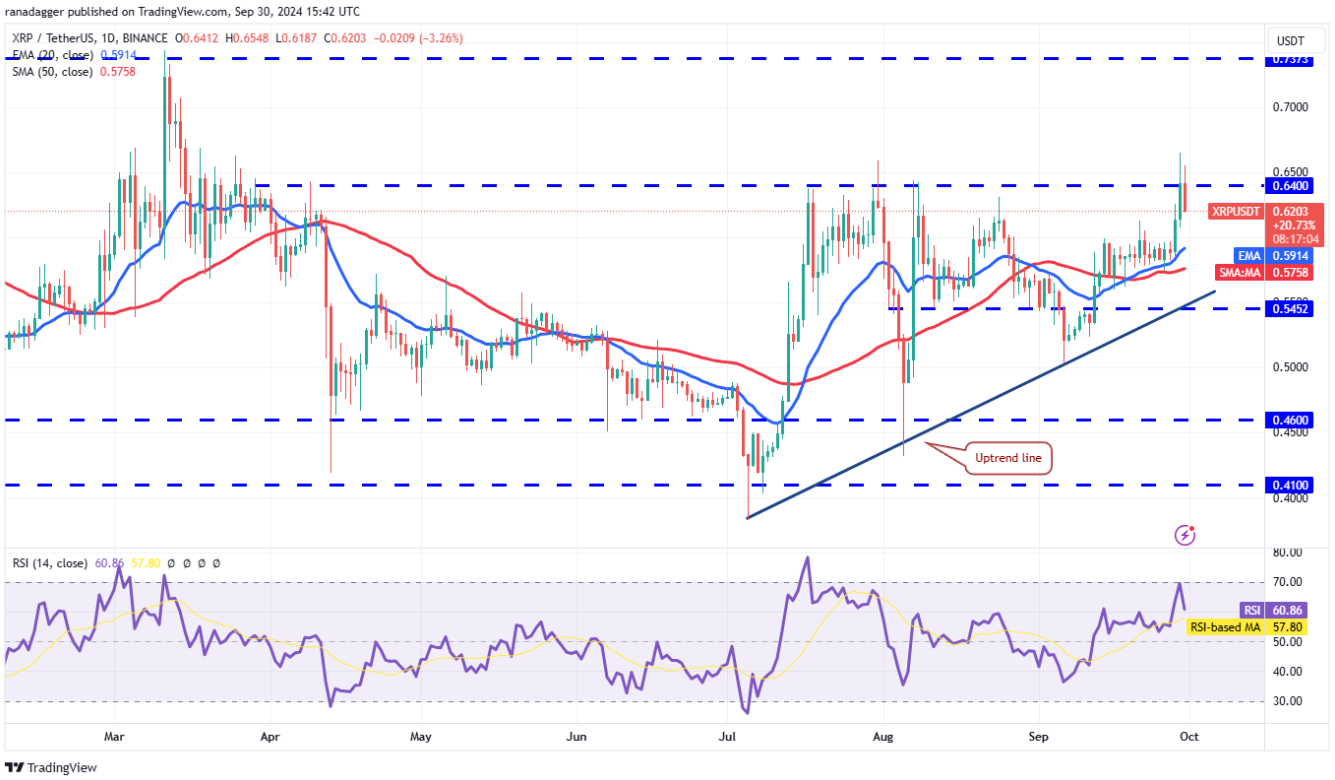
XRP/ USDT daily chart | Source: TradingView
The bulls again attempted to sustain the price above $0.64 on September 30, but the bears refused to budge. This suggests that the market has rejected the breakout. The XRP/ USDT pair could drop to the 20-day EMA ($0.59).
If the price bounces from the current levels or the 20-day EMA with strength, it will suggest that the bulls are still buying on dips. Buyers will have to push the price above $0.66 to clear the way for a rally to $0.74.
Dogecoin (Doge) is recovering and facing selling at $0.13, which has pulled the price to a breakout near $0.12.
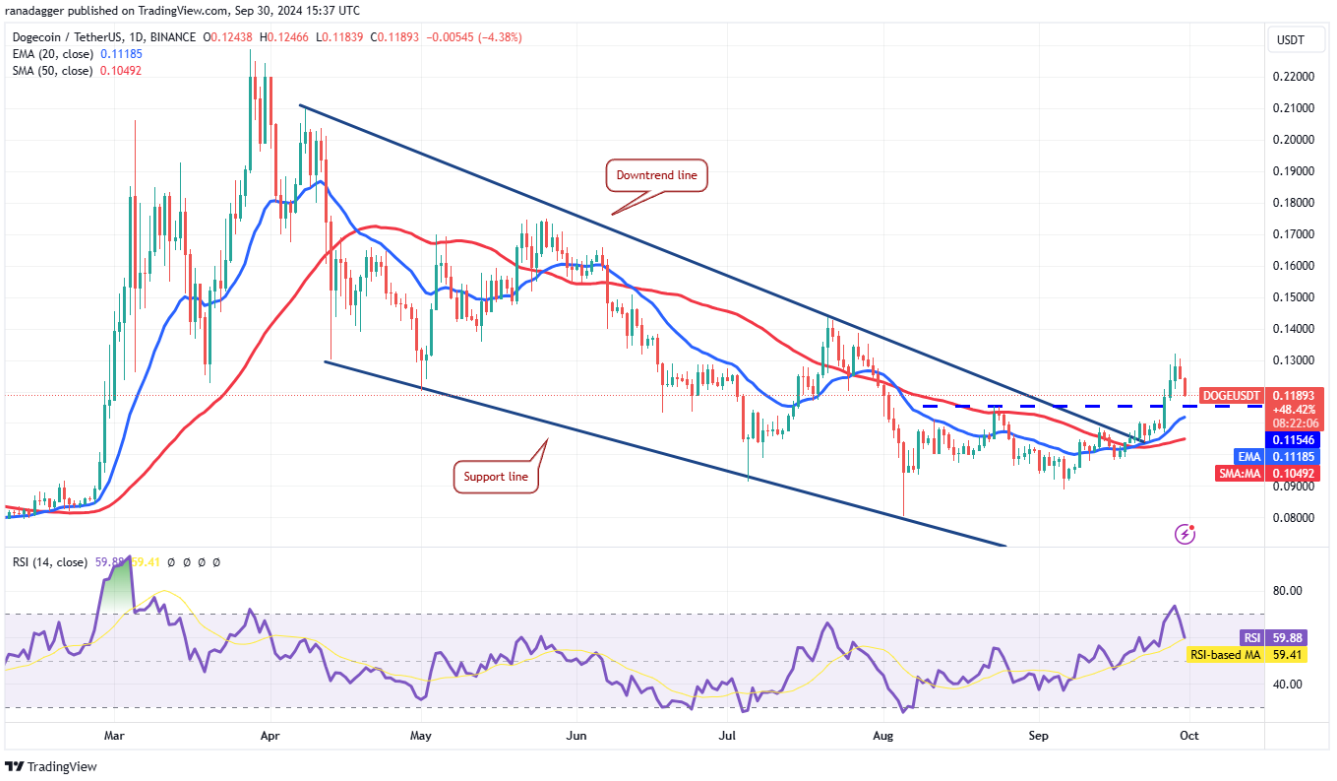
Doge/ USDT daily chart | Source: TradingView
The 20-day EMA ($0.11) has started to turn up and the RSI is in the positive zone, suggesting a slight advantage to the bulls. If the price bounces off the 20-day EMA and rises above $0.13, the Doge/ USDT pair could reach $0.14. This level could Vai as resistance, but if crossed, the rally could reach $0.18.
Conversely, if the price turns down and breaks below the 20-day EMA, it will suggest that bears are active at higher levels. That could result in a range formation between $0.09 and $0.13 for a few days.
Toncoin (TON) is facing selling above $6, but a positive sign is that the bulls are not allowing the price to slide below the moving Medium .
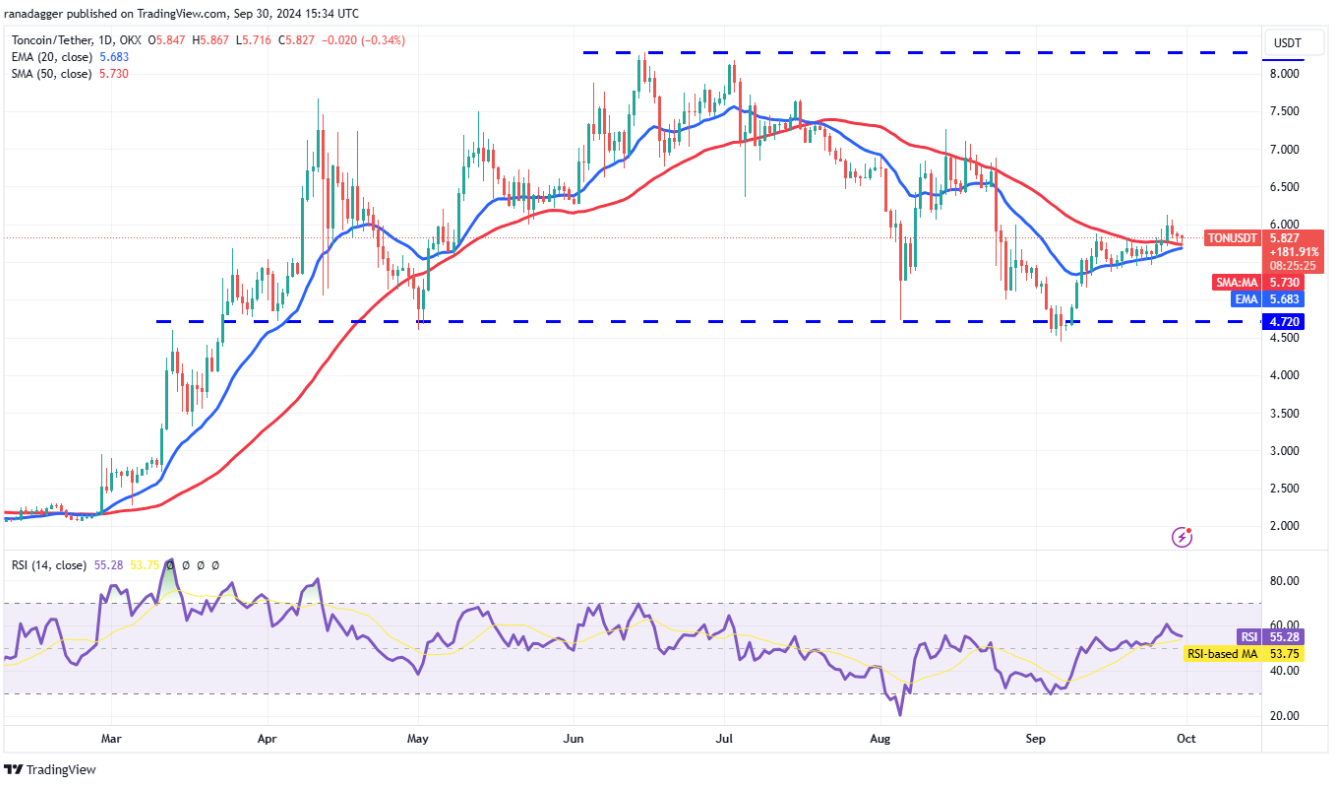
TON/ USDT Daily Chart | Source: TradingView
If the price rises from the moving Medium and breaks above $6, it will signal the start of a move to $7. The bears could pose a strong challenge at $7, but if the bulls prevail, the rally could extend to $8.29.
This bullish view will be invalidated in the near term if the TON/ USDT pair breaks sharply below the moving Medium and the $5.37 support. That could open the doors for a drop to the $4.72-$4.44 support zone.
Cardano (ADA) rose above the $0.40 resistance on September 27, but the long wick on the candlestick shows strong selling pressure at higher levels.
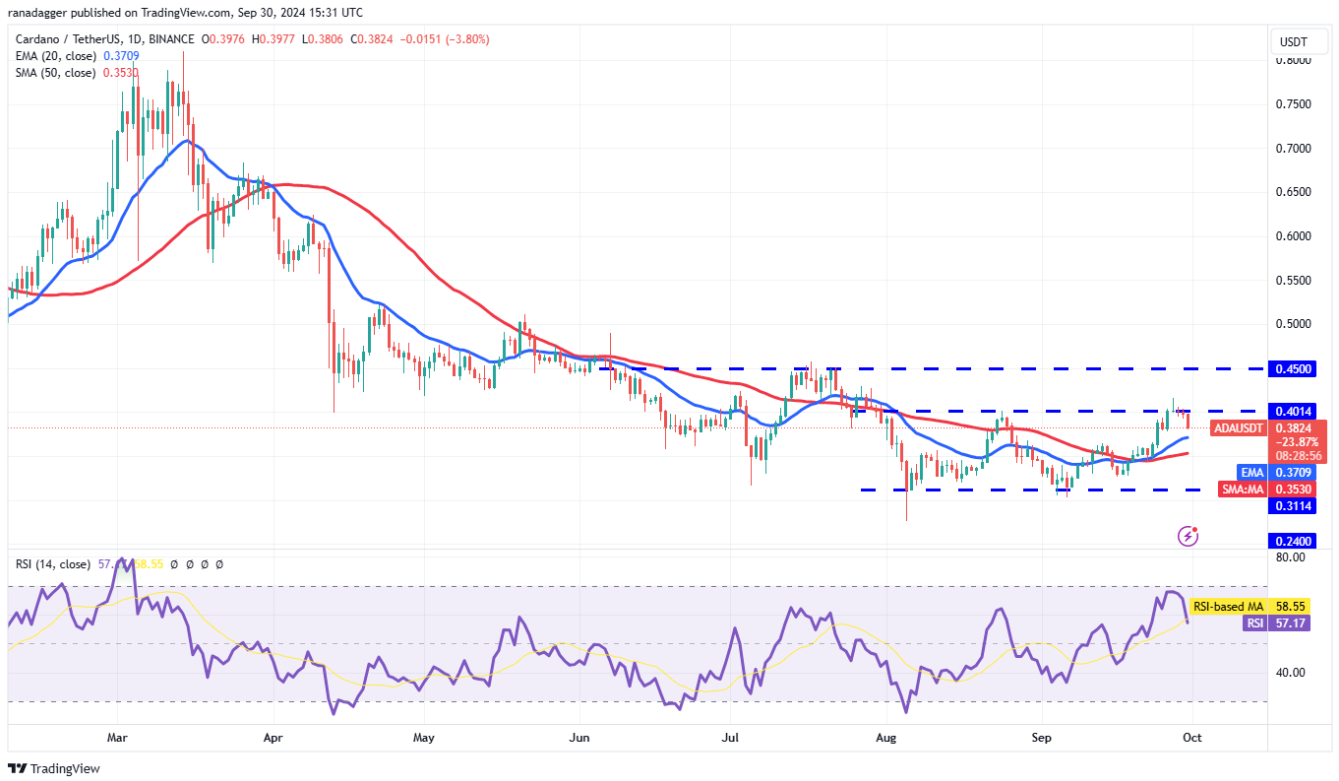
ADA/ USDT daily chart | Source: TradingView
The price has declined towards the 20-day EMA ($0.37). If the price rebounds off the 20-day EMA with strength, the bulls will again attempt to push the ADA/ USDT pair above $0.40. If successful, the pair could rally to $0.46. Buyers will have to overcome this hurdle to signal the start of a new uptrend.
On the other hand, if the price slides below the 20-day EMA, it will suggest that the pair could extend its stay within the $0.31 to $0.40 range for a few more days.
You can XEM coin prices here.
Disclaimer: This article is for informational purposes only and is not investment advice. Investors should research carefully before making any decision. We are not responsible for your investment decisions.
Join Telegram: https://t.me/tapchibitcoinvn
Follow Twitter: https://twitter.com/tapchibtc_io
Follow Tiktok: https://www.tiktok.com/@tapchibitcoin
SN_Nour
According to Cointelegraph


